- Electric and Telecom Plans Free
- Fire and Emergency Plans Free
- Floor Plans Free
- Plant Layout Plans Free
- School and Training Plans Free
- Seating Plans Free
- Security and Access Plans Free
- Site Plans Free
- Sport Field Plans Free
- Business Process Diagrams Free
- Business Process Mapping Free
- Classic Business Process Modeling Free
- Cross-Functional Flowcharts Free
- Event-driven Process Chain Diagrams Free
- IDEF Business Process Diagrams Free
- Logistics Flow Charts Free
- Workflow Diagrams Free
- ConceptDraw Dashboard for Facebook Free
- Mind Map Exchange Free
- MindTweet Free
- Note Exchange Free
- Project Exchange Free
- Social Media Response Free
- Active Directory Diagrams Free
- AWS Architecture Diagrams Free
- Azure Architecture Free
- Cisco Network Diagrams Free
- Cisco Networking Free
- Cloud Computing Diagrams Free
- Computer Network Diagrams Free
- Google Cloud Platform Free
- Interactive Voice Response Diagrams Free
- Network Layout Floor Plans Free
- Network Security Diagrams Free
- Rack Diagrams Free
- Telecommunication Network Diagrams Free
- Vehicular Networking Free
- Wireless Networks Free
- Comparison Dashboard Free
- Composition Dashboard Free
- Correlation Dashboard Free
- Frequency Distribution Dashboard Free
- Meter Dashboard Free
- Spatial Dashboard Free
- Status Dashboard Free
- Time Series Dashboard Free
- Basic Circle-Spoke Diagrams Free
- Basic Circular Arrows Diagrams Free
- Basic Venn Diagrams Free
- Block Diagrams Free
- Concept Maps Free
- Family Tree Free
- Flowcharts Free
- Basic Area Charts Free
- Basic Bar Graphs Free
- Basic Divided Bar Diagrams Free
- Basic Histograms Free
- Basic Line Graphs Free
- Basic Picture Graphs Free
- Basic Pie Charts Free
- Basic Scatter Diagrams Free
- Aerospace and Transport Free
- Artwork Free
- Audio, Video, Media Free
- Business and Finance Free
- Computers and Communications Free
- Holiday Free
- Manufacturing and Maintenance Free
- Nature Free
- People Free
- Presentation Clipart Free
- Safety and Security Free
- Analog Electronics Free
- Audio and Video Connectors Free
- Basic Circuit Diagrams Free
- Chemical and Process Engineering Free
- Digital Electronics Free
- Electrical Engineering Free
- Electron Tube Circuits Free
- Electronic Block Diagrams Free
- Fault Tree Analysis Diagrams Free
- GHS Hazard Pictograms Free
- Home Automation and Wiring Free
- Mechanical Engineering Free
- One-line Diagrams Free
- Power Сircuits Free
- Specification and Description Language (SDL) Free
- Telecom and AV Circuits Free
- Transport Hazard Pictograms Free
- Data-driven Infographics Free
- Pictorial Infographics Free
- Spatial Infographics Free
- Typography Infographics Free
- Calendars Free
- Decision Making Free
- Enterprise Architecture Diagrams Free
- Fishbone Diagrams Free
- Organizational Charts Free
- Plan-Do-Check-Act (PDCA) Free
- Seven Management and Planning Tools Free
- SWOT and TOWS Matrix Diagrams Free
- Timeline Diagrams Free
- Australia Map Free
- Continent Maps Free
- Directional Maps Free
- Germany Map Free
- Metro Map Free
- UK Map Free
- USA Maps Free
- Customer Journey Mapping Free
- Marketing Diagrams Free
- Matrices Free
- Pyramid Diagrams Free
- Sales Dashboard Free
- Sales Flowcharts Free
- Target and Circular Diagrams Free
- Cash Flow Reports Free
- Current Activities Reports Free
- Custom Excel Report Free
- Knowledge Reports Free
- MINDMAP Reports Free
- Overview Reports Free
- PM Agile Free
- PM Dashboards Free
- PM Docs Free
- PM Easy Free
- PM Meetings Free
- PM Planning Free
- PM Presentations Free
- PM Response Free
- Resource Usage Reports Free
- Visual Reports Free
- House of Quality Free
- Quality Mind Map Free
- Total Quality Management TQM Diagrams Free
- Value Stream Mapping Free
- Astronomy Free
- Biology Free
- Chemistry Free
- Language Learning Free
- Mathematics Free
- Physics Free
- Piano Sheet Music Free
- Android User Interface Free
- Class Hierarchy Tree Free
- Data Flow Diagrams (DFD) Free
- DOM Tree Free
- Entity-Relationship Diagram (ERD) Free
- EXPRESS-G data Modeling Diagram Free
- IDEF0 Diagrams Free
- iPhone User Interface Free
- Jackson Structured Programming (JSP) Diagrams Free
- macOS User Interface Free
- Object-Role Modeling (ORM) Diagrams Free
- Rapid UML Free
- SYSML Free
- Website Wireframe Free
- Windows 10 User Interface Free
Flowcharts
Many professionals related to business and project management are required to solve problems of different complexity every day. Currently, there are many tools helpful for project managers to manage their daily tasks and scheduling. Flowchart is one of the most popular of them. It is a graphical tool useful for breaking down a process.
The flowcharts are widely used in project management. They identify the key elements of the process and separate any steps that are unessential or extreme. The design of a process algorithm contributes to better understanding when there is a problem in a process, or there is a need to determine how to improve a process.
A flowchart depicts the structure of a process, procedure, workflow, or step-by-step progression in an intuitive and clear format using connecting lines and a set of conventional flowchart symbols and shapes. Connecting lines with branching possibilities help to indicate the flow's direction. The flowcharts show all activities involved in a given project, decision points, branching loops, parallel paths, etc.
Flowcharts are designed vertically or horizontally and have one or more starting and ending points represented by ovals or rounded rectangles and identified by the words "Start" or "End". All steps in a flowchart are shown as specific shapes (flow chart symbols), and the process flow is presented through arrows that connect the objects.
Flowchart diagrams are widely used for designing, documenting, analyzing, and managing complex processes and programs in various fields such as education, business, software development, analytics, engineering, architecture, science, manufacturing, and administration.
The Flowcharts Solution for ConceptDraw DIAGRAM software with a large set of included pre-made design elements, icons, and symbols is a powerful assistant in flowchart design. The included examples and samples help to overview the advantages of flowcharts and what is a flowchart used for.
-
Install this solution Free -
What I need to get started -
Solution Requirements - This solution requires the following products to be installed:
ConceptDraw DIAGRAM v18 - This solution requires the following products to be installed:
-
Compatibility - Sonoma (14), Sonoma (15)
MS Windows 10, 11 - Sonoma (14), Sonoma (15)
-
Support for this Solution -
Helpdesk
The Flowcharts Solution for ConceptDraw DIAGRAM is a comprehensive set of examples and samples in several different color themes for professionals that need to graphically represent a process. Solution value is added by basic flow chart template and shapes' library of Flowchart notation. ConceptDraw DIAGRAM flow chart creator lets one depict processes of any complexity and length, as well as design the flowcharts either vertically or horizontally.
The Flowcharts solution contains 13 examples and 3 libraries containing 74 vector graphics and icons, to allow you to create professional-looking documents.
Design Elements — Flowcharts Rapid Draw

Design Elements — Flowcharts Rapid Draw (Swimlane Flowcharts)
")
Design Elements — Flowcharts

Flowchart Examples
There are a few samples that you see on this page which were created in the ConceptDraw DIAGRAM application by using the Flowcharts solution. Some of the solution's capabilities as well as the professional results which you can achieve are all demonstrated here on this page.
All source documents are vector graphic documents which are always available for modifying, reviewing and/or converting to many different formats, such as MS PowerPoint, PDF file, MS Visio, and many other graphic ones from the ConceptDraw Solution Park or ConceptDraw STORE. The Flowcharts solution is available to all ConceptDraw DIAGRAM users to get installed and used while working in the ConceptDraw DIAGRAM diagramming and drawing software.
Example 1: Flowchart — Invoice Payment Process
This diagram was created in ConceptDraw DIAGRAM using the combination of libraries from the Flowcharts Solution. An experienced user spent 10 minutes creating this sample.
An invoice or a bill is a type of commercial document the seller provides for the buyer together with purchase after the fact of sale transaction or before purchase with indication the payment terms. It contains the full information about the products bought by the customer, their titles, article numbers, quantities, prices on the moment of sale, and discount if it was offered. The use of ready ConceptDraw process, decision, terminator and other vector objects, as well as ConceptDraw connectors to create a Flowchart diagram is an intuitive and time-saving solution. This sample of flowchart describes an invoice payment approval process. The diamond objects represent the decision points with questions that need an answer "yes" or "no". The answer uniquely determines the next step at the process flow, thus if an invoice doesn’t meet requirements, it is returned to the supplier, otherwise the process continues; if all required information and approvals are included, an invoice is placed to the payment queue and then processed, and so on.

Example 2: Flowchart — Product Life Cycle Process
This diagram was created in ConceptDraw DIAGRAM using the combination of libraries from the Flowcharts Solution. An experienced user spent 20 minutes creating this sample.
This flowchart sample provides a structure for a business analysis that identifies a set of common stages in the life of a commercial product. The product life cycle lets to reveal the set of common stages at the life of different commercial products. So, it allows to represent the product's lifespan and the stages through which the given product goes during its lifespan, beginning from the time when it was thought and until the moment of its elimination from the industry. Typically, there are identified four stages of a product's life cycle: introduction, growth, maturity, and decline. This diagram is visually divided by blocks that describe the life cycle phases: Proposal and Initial phase, Project Management phase, Operations and Production phase. It is a common way to separate visually the information. To easier reading of the sample flowchart process definition, each kind of object has not only its own generally accepted form but also its own color.

Example 3: Flowchart — Selection Sorting Method
This diagram was created in ConceptDraw DIAGRAM using the combination of libraries from the Flowcharts Solution. An experienced user spent 15 minutes creating this sample.
The Flowcharts are convenient and widely used for describing different kinds of mathematical and computer science algorithms. The algorithm is a sequence of actions, which strict implementation leads to the solution of a given problem. The algorithms are used for the data processing, calculation, and automated reasoning. This sample shows the flowchart diagram of the Selection sorting method and results of its application. The selection sorting method is an algorithm of ordering the elements at the list, it lets to put the elements of a list in a defined order, typically are sorted numeric and lexicographical data. This procedure flow chart example describes the step-by-step procedure for calculations starting from the initial state to the final state. At the left side is represented the input array - five numbers placed in random order, and at the right side you can see the final result - sorted array of these numbers in order of increasing.

Example 4: Flowchart — Food Security Assessment
This diagram was created in ConceptDraw DIAGRAM using the combination of libraries from the Flowcharts Solution. An experienced user spent 15 minutes creating this sample.
This sample shows the flowchart of a food security assessment and was drawn on the base of illustration for the article "Climate change impact on China food security in 2050" from the Chinese Academy of Agricultural Sciences website. The food security is the set of conditions providing for all people the permanent physical and economic access to the food at any time and in quantity sufficient to meet their individual food needs, and allowing them to lead healthy and active lifestyle. The significant changes of climate and extreme natural phenomena negatively influence on the agricultural sector and consequently on the food security. Each flowchart symbol you see on this example has its own application, shape, and color. You can see a legend, which is an integral attribute of many flowcharts, including this one, it helps to clarify the purposes and meaning of all kinds of symbols used on a given flowchart.

Example 5: Cross-functional Flowchart Stages of Personnel Certification
This diagram was created in ConceptDraw DIAGRAM using the combination of libraries from the Flowcharts Solution. An experienced user spent 10 minutes creating this sample.
This sample of flowchart diagram shows the common scheme depicting the stages of the personnel certification process. The personnel certification is a certification issued for the person in result of defined set of executed actions, which confirms and assures its qualification to perform some job or task. The certification is typically carried out within a specific system and according to the chosen scheme. This Cross-functional flowchart includes three stages: preparatory stage, certification stage and final stage, which are actual for certification in any field of personnel activity. Each stage contains the chain of process steps that need to be executed. For additional clarity, the part of diagram corresponding for each stage is uniquely colored and the objects belonging to varied stages also differ by color filling. The similar diagrams can be considered as simple and clear instructions represented in a visual and clear form, easy for perception and comprehension by each person.

Example 6: Cross-functional Flowchart — Order Processing
This diagram was created in ConceptDraw DIAGRAM using the combination of libraries from the Flowcharts Solution. An experienced user spent 10 minutes creating this sample.
This Cross-functional flowchart demonstrates the order processing. The order processing is the main step of order fulfillment, it is a process or a work flow that includes the precise picking of items according to the order, their packing, as well as delivery of the packed order to a shipping carrier. The ordering process is executed by the distribution centers and can slightly differ from the company to company, because each distribution center has its own unique priorities and requirements, and so the order process can contain some additional operational procedures determined by specific factors. This diagram is a vertically arranged Cross-functional flowchart designed in vivid color gamma. It is no matter for ConceptDraw DIAGRAM flowchart software, what flowchart you are going to draw -vertically or horizontally arranged, it offers you the complete set of drawing tools and ready-made vector objects for designing diagrams of any of these two types for your own choice.

Example 7: Flowchart — Import Process
This diagram was created in ConceptDraw DIAGRAM using the combination of libraries from the Flowcharts Solution. An experienced user spent 10 minutes creating this sample.
This sample of flowchart describes the import process using the flowchart. Import is a delivering of purchased foreign goods and technologies to the country across the border with compliance of legislative standards, with a goal of its realization and application within domestic market or transit to the third country. The international trade helps countries to expand production and to ensure delivery of products, the manufacturing of which at the importer's country is impossible or inefficient. The process of importing goods is a very important process at the life of society, it is governed by the laws and assumes the conclusion of international contracts or trade agreements between the importing and exporting jurisdictions. The volume of imported goods depends directly on the country's foreign exchange resources, as well as revenue from the export of goods. The import to the receiving country is at the same time the export from the sending country. On the importing as well as exporting goods are usually set defined custom taxes and quotas.

Example 8: Cross-functional Flowchart — Credit Approval Process
This diagram was created in ConceptDraw DIAGRAM using the combination of libraries from the Flowcharts Solution. An experienced user spent 10 minutes creating this sample.
This vertical Cross-functional flowchart example illustrates the credit approval process. The credit is a well-known term in commercial trade, which indicates the delayed payments for purchased goods and determines the terms of payment. Typically, the credit is offered at the compliance the set of clearly defined conditions, such as the person's financial stability, availability of a certain packet of documents, etc. The arrow's direction shows the order of execution the functions in a process. The process depicted on this diagram was drawn from the top down, that is a commonly used direction, the presence of return to the previous function is also acceptable on Cross-functional flowcharts. You can observe four swim lanes on this diagram, which titles are indicated at the top of flowchart: Customer, Sales, Management, and Credit Department. The swim lanes provide an extra dimension allowing to place each process step to specific category, in fact what has been done on this diagram.

Example 9: Flowchart — Planning Process
This diagram was created in ConceptDraw DIAGRAM using the combination of libraries from the Flowcharts Solution. An experienced user spent 10 minutes creating this sample.
This sample flow chart depicts consistently all steps of the project planning process and is read from the top down in direction that is indicated with arrows. The project planning is one of the major part of the project management and there are many tools allowing to help project managers in planning projects, as well as managing them. Among them are flowcharts, which let display the flow of actions necessary to be executed to achieve the main goal or to meet a particular task. The use of various types of diagrams and flowcharts lets to plan in details the stages of project implementation and to represent them clearly, as well as to visualize the project state on the stage of implementation, to report the project progress and results in a visual form. Made with flowchart creating software ConceptDraw DIAGRAM using a single color, this sample flowchart process diagram however is very bright and eye-catching due to the use of yellow, which is famous as winnable in most cases.

Example 10: Flowchart — Project Management Life Cycle
This diagram was created in ConceptDraw DIAGRAM using the combination of libraries from the Flowcharts Solution. An experienced user spent 10 minutes creating this sample.
This Flowchart example shows the project management life cycle. It attracts attention by its clarity of presentation the information, at simple and at the same time informative form. The project management is an extensive and widespread field for studying and analysis. At this, the management of each specific project is an individual process with its specifics and is realized according to the individual concept. We can observe the processes at the different fields and knowledge areas related with a project management, such as Project Quality Management, Project Integration Management, Project Cost Management, Project Time Management, Project Scope Management, Project Human Resource Management, Project Risk Management, Project Stakeholders Management, Project Communications Management, Project Procurement Management. The processes at all these areas are executed with a goal of achievement effective project management programs. There are allocated five process groups, which include 47 known project processes, these groups are: initiating, planning, executing, monitoring and controlling, and closing.

Example 11: Flowchart — Website Launch
This diagram was created in ConceptDraw DIAGRAM using the combination of libraries from the Flowcharts Solution. An experienced user spent 10 minutes creating this sample.
This Flowchart sample shows the website launch. A website typically has complex structure and is hosted on a web server available via Internet or a private local area network. As for the website structure, it is composed from the set of related web pages represented as text written according to the formatting instructions of HTML. The pages are organized in a hierarchy, have own web addresses (URLs) and are accessed with HTTP protocol. This sample of flowchart represents all stages of website launch, regardless the complexity of its internal structure, beginning from the domain registration, solution the questions related with server and hosting, creation the site prototype, carrying assurance and testing, and ending by the final site launch. You can also see detailed filling of each of these stages, i.e. the steps and actions that need to be performed on each stage. The color separation of phases on this diagram helps to construct a clear structure, to improve its perception and to define the boundaries of each stage at a glance.

Example 12: Flowchart — Synthetic Object Construction
This diagram was created in ConceptDraw DIAGRAM using the combination of libraries from the Flowcharts Solution. An experienced user spent 10 minutes creating this sample.
This sample designed with help of ready-made vector objects from the libraries of Flowcharts solution for ConceptDraw Solution Park, demonstrates the planning scheme for the construction of a synthetic object. The Computer-generated imagery (CGI) is the use of the computer graphics for creation the illustrations and images for different kinds of art, video games, films, printed media, television programs, commercials, simulators, for creation scenes and special effects in films and television programs, and so on. The represented visual scenes can be as two-dimensional (2D) as three-dimensional (3D), they can be also static or dynamic. This is a quite complex flowchart with great number of objects and a lot of decisions on the way across the flowchart, when you need to make the quick and simple choice "yes" or "no" before going further. The visual color division of objects on this flowchart helps to see the type of object with one fleeting look.

Example 13: Flowchart — Human Resource Management Process
This diagram was created in ConceptDraw DIAGRAM using the combination of libraries from the Flowcharts Solution. An experienced user spent 10 minutes creating this sample.
This Flowchart example is dedicated to the representation the principles of a Human resource management (HRM) process. The HRM is a management process of the enterprise's staffing, directed on the attraction and selection the qualitative staff, assessment, training, as well as rewarding of employees and retaining the valuable professionals. Among others, it includes the overseeing for the compliance with employment and labor laws. The Human resource management is an important process for any enterprise, it greatly influences on the company's staff composition and ultimately on the improvement a work productivity and enterprise's success. It is a field of activity, which requires knowledge, good training and great experience in a field of economics, management and also psychology. The HR managers use the set of specially developed methods at their work and individually selected methods for each specific case help them to do their work efficiently and to move at the right direction.

Inside

What I Need to Get Started
Both ConceptDraw DIAGRAM diagramming and drawing software and the Flowcharts solution can help creating the diagrams you need. The Flowcharts solution can be found in the Diagrams area of ConceptDraw STORE application that can be downloaded from this site. Make sure that both ConceptDraw DIAGRAM and ConceptDraw STORE applications are installed on your computer before you get started.
How to install
After ConceptDraw STORE and ConceptDraw DIAGRAM are downloaded and installed, you can install the Flowcharts solution from the ConceptDraw STORE.

Start using
To make sure that you are doing it all right, use the pre-designed symbols from the stencil libraries from the solution to make your drawings look smart and professional. Also, the pre-made examples from this solution can be used as drafts so your own drawings can be based on them. Using the samples, you can always change their structures, colors and data.

Samples of FlowChart Diagrams. How to Draw a Flow Diagram?
A flowchart can take any process and distil it into a series of actions or decisions. It is a versatile and simple form of diagram that can be used to describe situations in any field, and is easily understood by everyone.
What makes a flowchart so widely used and readily understood is the use of standardized symbols that retain the same meaning whatever process they are describing.
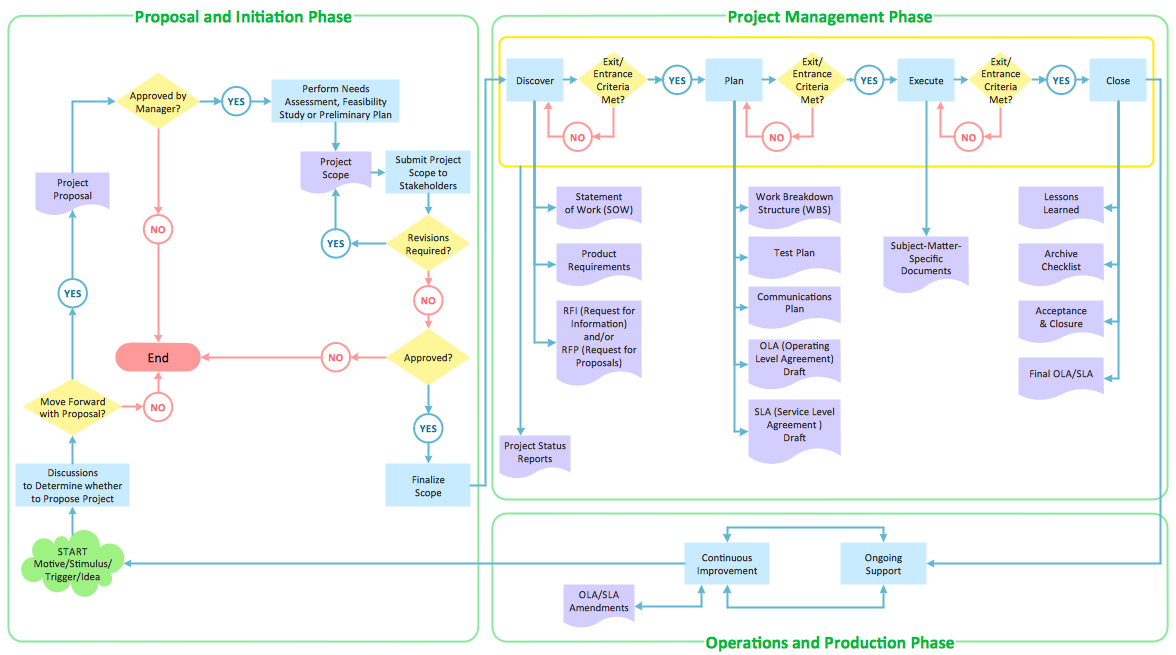
Fig 1. Flowchart — Product life cycle process
Flowcharts always start and end with a Terminal, an oval shape containing the appropriate text. A diamond shows that a Decision is necessary, often yes/no or true/false, while an Action is shown as a rectangle, containing text describing what happens. Other flowcharting symbols add contextual layers to specific process flow diagrams, with icons that represent punch card inputs, disk storage, and manual operations.
As more of business has become reliant on computer systems, there has been a need to use flowcharting to map data flow diagrams. Symbols known as data-flow extensions exist for this exact function, that allow Documents, Manual operations, Manual inputs, and Data files to be added to a data flow chart.
Fig 2. Flowcharts design elements
What is a Flowchart?
A flowchart is a type of diagram that shows graphically a workflow, process, system, algorithm, or step-by-step approach to solving a task or problem. It has a clear and easy-to-understand view and is useful for documenting, designing, managing, and analyzing processes of various direction and complexity.
Flowcharts are used frequently in business to document workflows from all areas of a company — they can show accounting purchase orders, human resource recruitment strategy, or a product life cycle.
Process Flow Diagram Examples
Different types of process flow diagrams exist to reflect the different ways in which data and resources interact within each area of a business. Here are some examples of the types of flow diagrams in common use:
- Data-flow diagrams — these diagrams can show the interaction between a system and external agents, or show the flow of data within that system. They are used to visualize how a system will operate, how it can be implemented, and what effect data input will have on the system as a whole.
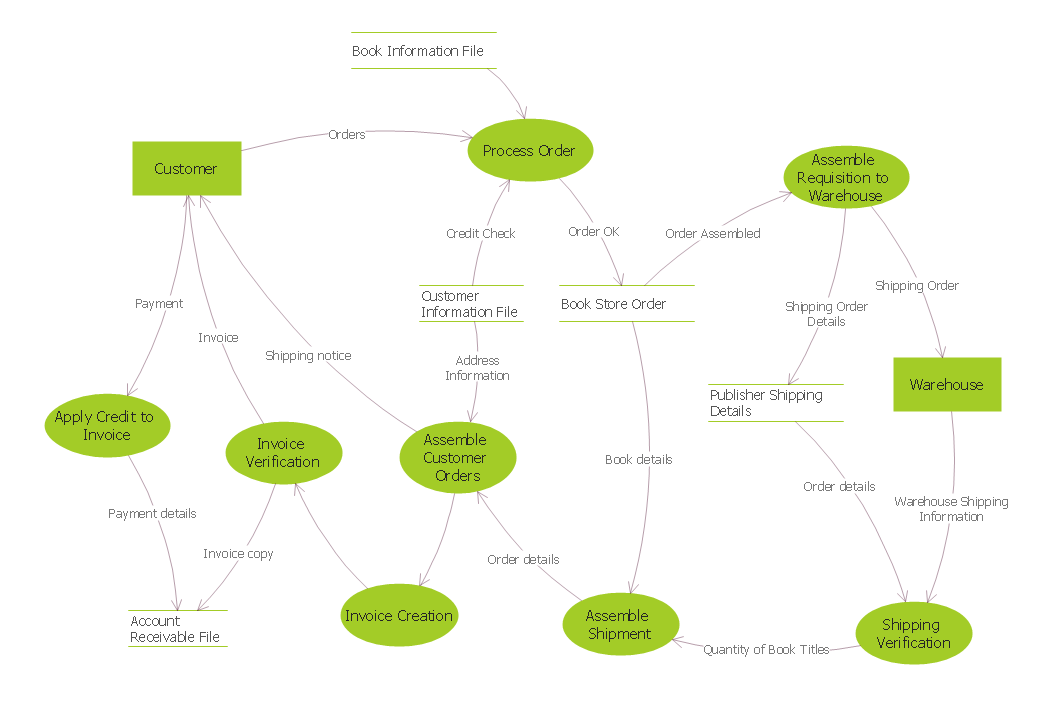
Fig 3. DFD Process of account receivable
- Functional flow diagrams — these are used to map a multi-tiered, time sequenced process. They show a workflow as a series of levels, with each step of the top level process expanded into it's own list of functions that represent the 2nd tier of the process. This can be repeated for as many tiers as is necessary.
- Algorithm charts — the binary nature of decision making on a process flowchart means they are an ideal medium for mapping computer algorithms. The flowchart symbols are used to graphically represent a step-by-step set of operations to be performed, and the rules by which they are defined.
- Activity diagrams — this type of diagram is used extensively as an example of Unified Modeling Language, used by software engineers as a standard way of visualizing the design of a system. Activity diagrams differ from normal flowcharts primarily by being able to show the start and end of concurrent activities, using a specific Join or Split symbol.
- Cross-functional flowcharts — this type of flowchart is constructed as a matrix, arranged into 'swimlanes' that denote different stakeholders or departments. It shows each individuals activities, and how the work flow crosses departments to form a complete process.

Fig 4. Swimlane Process Mapping Diagram — Payroll Process
Flowchart solutions from ConceptDraw
For years ConceptDraw has been delivering high quality business process flow design solutions, turning ConceptDraw DIAGRAM into one of the most comprehensive and powerful examples of tool for creating flowcharts. Solutions have been tailor made to apply to numerous departments and stakeholders within a company, while ConceptDraw specialize in professionally drawn vector stencil graphics of both standardized flowchart notation, as well as a large selection of themed icons and flowchart design elements.
Here are some of the flowcharting solutions for ConceptDraw DIAGRAM flowchart diagram maker, and process flow diagram examples that have been created using them:
- HR Flowcharts — libraries of icons relating to human resources allow HR staff to illustrate workflows in that field, such as the recruitment process, staff training, or health and safety initiatives.

Fig 5. Human Resource Development — Onboarding Model
- Accounting Flowcharts — the set of symbols found in this solution give accountants the tools they need to describe purchase orders, payments, or procurement processes.
- Sales Flowcharts — Sales workflows can cover interaction between customer and business, or an internal sales process needed to be performed by workers.

Fig 6. Sales Flowchart — Global Payment Solutions
- Audit Flowcharts — this solution contains extra symbols to help illustrate the steps needed to prepare and implement the audit process.
- Cross-Functional Flowcharts — as mentioned previously, this type of flowchart drawing is divided into 'swimlanes'. It needs special notation to signify the relationship between these divisions, which can be found in this solution.
- Business Process Diagram — this solution contains design elements for Business Process Model Notation (BPMN) v2, which is an extension of the standard flowchart notation, and allows users to present complex process semantics and more precise information for any given step.

Fig 7. BPMN 2.0 — diagram logistics
- IDEF0 Diagrams — IDEF0 is the modeling language used to create flowcharts specifically for the analysis of computer system software, or software engineering. This solution from ConceptDraw contains the necessary connecting arrows and callouts.
- Flowcharts — the base flowchart solution for ConceptDraw DIAGRAM has a large library of all common flowcharting symbols.
How to Draw a Flowchart
With the predesigned building blocks included to the libraries of ConceptDraw DIAGRAM solutions, it is possible to identify business processes and create flowcharts that describe work process flows from all divisions of a company. They are also useful to design Data Flow Diagrams to represent a data flow in the information system and analyze data processing.
Use the included library objects to show the major flowchart or DFD components: entities, processes, data stores, and data flows. Simply drag and drop the needed objects from the corresponding solution library to your document and use the connectors to depict how these components interact with each other in a system and show the direction of data flow.
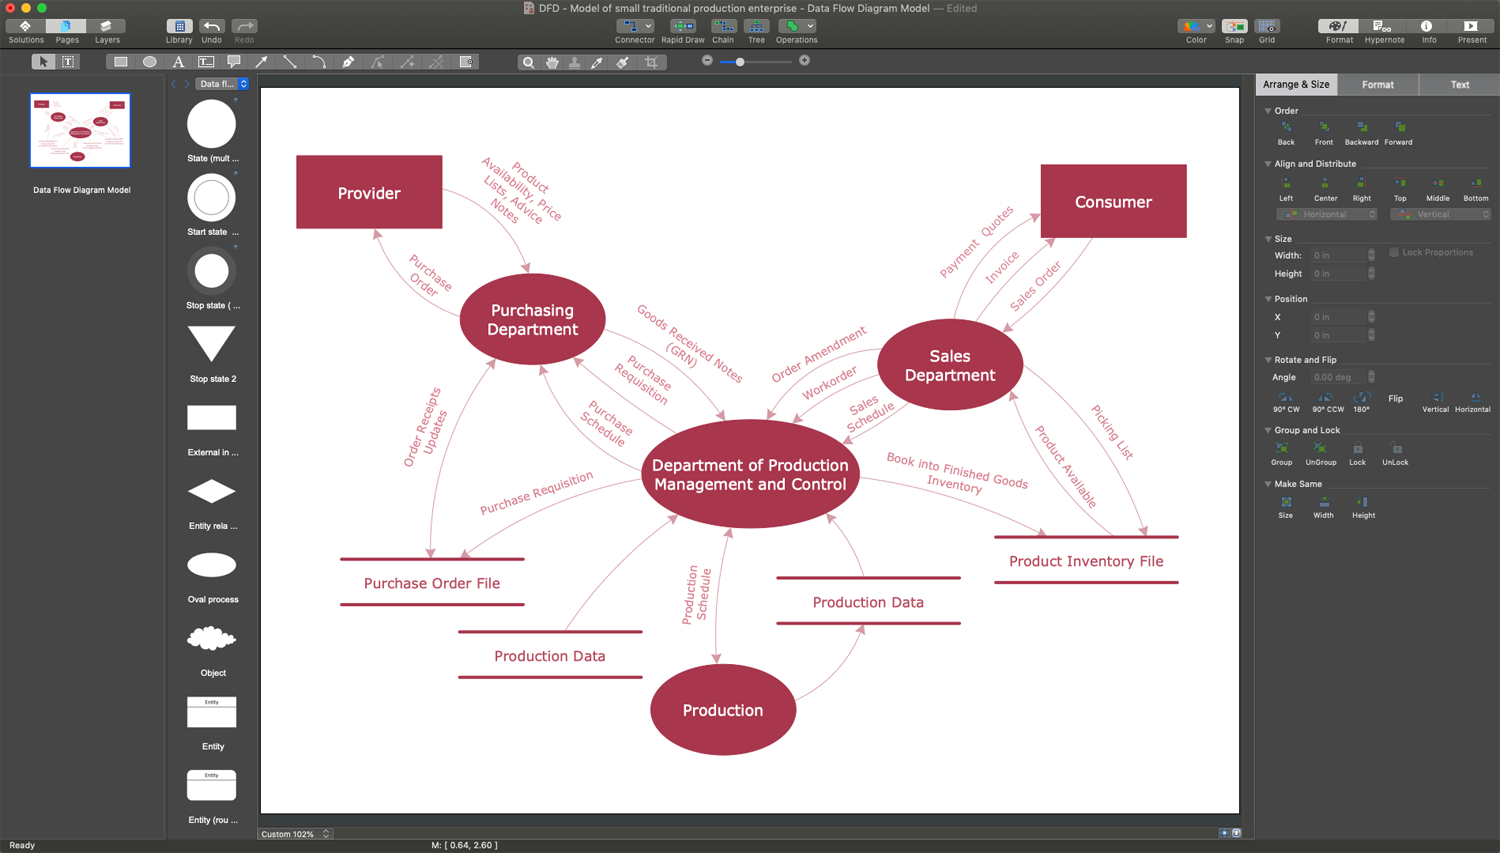
Fig 8. Data Flow Diagram in ConceptDraw DIAGRAM
Conclusion
These are just some of the vast array of online business process diagramming solutions that can be found in ConceptDraw Solution Park, on the ConceptDraw website. By using flowcharts, you can map unique company processes at all levels and across all departments, transmit information to important stakeholders, or use your flowchart as part of a presentation — so it is important to have a piece of software powerful and dynamic enough to cater for all flowcharting needs. The included tips on how to make flow chart fast and easily using ConceptDraw DIAGRAM flowchart software will help you in your work and business. Combining these solutions with ConceptDraw DIAGRAM gives users all the tools they need to create effective and professional flowchart designs.