- Electric and Telecom Plans Free
- Fire and Emergency Plans Free
- Floor Plans Free
- Plant Layout Plans Free
- School and Training Plans Free
- Seating Plans Free
- Security and Access Plans Free
- Site Plans Free
- Sport Field Plans Free
- Business Process Diagrams Free
- Business Process Mapping Free
- Classic Business Process Modeling Free
- Cross-Functional Flowcharts Free
- Event-driven Process Chain Diagrams Free
- IDEF Business Process Diagrams Free
- Logistics Flow Charts Free
- Workflow Diagrams Free
- ConceptDraw Dashboard for Facebook Free
- Mind Map Exchange Free
- MindTweet Free
- Note Exchange Free
- Project Exchange Free
- Social Media Response Free
- Active Directory Diagrams Free
- AWS Architecture Diagrams Free
- Azure Architecture Free
- Cisco Network Diagrams Free
- Cisco Networking Free
- Cloud Computing Diagrams Free
- Computer Network Diagrams Free
- Google Cloud Platform Free
- Interactive Voice Response Diagrams Free
- Network Layout Floor Plans Free
- Network Security Diagrams Free
- Rack Diagrams Free
- Telecommunication Network Diagrams Free
- Vehicular Networking Free
- Wireless Networks Free
- Comparison Dashboard Free
- Composition Dashboard Free
- Correlation Dashboard Free
- Frequency Distribution Dashboard Free
- Meter Dashboard Free
- Spatial Dashboard Free
- Status Dashboard Free
- Time Series Dashboard Free
- Basic Circle-Spoke Diagrams Free
- Basic Circular Arrows Diagrams Free
- Basic Venn Diagrams Free
- Block Diagrams Free
- Concept Maps Free
- Family Tree Free
- Flowcharts Free
- Basic Area Charts Free
- Basic Bar Graphs Free
- Basic Divided Bar Diagrams Free
- Basic Histograms Free
- Basic Line Graphs Free
- Basic Picture Graphs Free
- Basic Pie Charts Free
- Basic Scatter Diagrams Free
- Aerospace and Transport Free
- Artwork Free
- Audio, Video, Media Free
- Business and Finance Free
- Computers and Communications Free
- Holiday Free
- Manufacturing and Maintenance Free
- Nature Free
- People Free
- Presentation Clipart Free
- Safety and Security Free
- Analog Electronics Free
- Audio and Video Connectors Free
- Basic Circuit Diagrams Free
- Chemical and Process Engineering Free
- Digital Electronics Free
- Electrical Engineering Free
- Electron Tube Circuits Free
- Electronic Block Diagrams Free
- Fault Tree Analysis Diagrams Free
- GHS Hazard Pictograms Free
- Home Automation and Wiring Free
- Mechanical Engineering Free
- One-line Diagrams Free
- Power Сircuits Free
- Specification and Description Language (SDL) Free
- Telecom and AV Circuits Free
- Transport Hazard Pictograms Free
- Data-driven Infographics Free
- Pictorial Infographics Free
- Spatial Infographics Free
- Typography Infographics Free
- Calendars Free
- Decision Making Free
- Enterprise Architecture Diagrams Free
- Fishbone Diagrams Free
- Organizational Charts Free
- Plan-Do-Check-Act (PDCA) Free
- Seven Management and Planning Tools Free
- SWOT and TOWS Matrix Diagrams Free
- Timeline Diagrams Free
- Australia Map Free
- Continent Maps Free
- Directional Maps Free
- Germany Map Free
- Metro Map Free
- UK Map Free
- USA Maps Free
- Customer Journey Mapping Free
- Marketing Diagrams Free
- Matrices Free
- Pyramid Diagrams Free
- Sales Dashboard Free
- Sales Flowcharts Free
- Target and Circular Diagrams Free
- Cash Flow Reports Free
- Current Activities Reports Free
- Custom Excel Report Free
- Knowledge Reports Free
- MINDMAP Reports Free
- Overview Reports Free
- PM Agile Free
- PM Dashboards Free
- PM Docs Free
- PM Easy Free
- PM Meetings Free
- PM Planning Free
- PM Presentations Free
- PM Response Free
- Resource Usage Reports Free
- Visual Reports Free
- House of Quality Free
- Quality Mind Map Free
- Total Quality Management TQM Diagrams Free
- Value Stream Mapping Free
- Astronomy Free
- Biology Free
- Chemistry Free
- Language Learning Free
- Mathematics Free
- Physics Free
- Piano Sheet Music Free
- Android User Interface Free
- Class Hierarchy Tree Free
- Data Flow Diagrams (DFD) Free
- DOM Tree Free
- Entity-Relationship Diagram (ERD) Free
- EXPRESS-G data Modeling Diagram Free
- IDEF0 Diagrams Free
- iPhone User Interface Free
- Jackson Structured Programming (JSP) Diagrams Free
- macOS User Interface Free
- Object-Role Modeling (ORM) Diagrams Free
- Rapid UML Free
- SYSML Free
- Website Wireframe Free
- Windows 10 User Interface Free
Organizational Charts
An organizational chart may also be referred to as an “organization chart”, an “org chart” or as an “organogram”. Being a diagram that shows the structure of an organization as well as the relationships of its parts and positions, the organization chart can be used to graphically show the relationship of one officer to another. It can be also used for showing the relation of one department to another.
A company's organizational chart usually illustrates relations between people who work in a particular organization, including managers to subordinates, directors to managing directors’, chief executive officers to many different departments, etc. Once an organization chart becomes too large, it can be split into smaller charts. Such smaller charts can be used to describe separate departments within the organization.
There are three most commonly used types of organization charts, which are hierarchical, matrix and flat (or “horizontal”). Any of the mentioned can be created with the aid of the ConceptDraw DIAGRAM diagramming and drawing software by using the Organizational Charts solution that offers to use the pre-made samples and templates of the professionally designed org charts as well as a stencil library full of vector shapes for drawing the unique and smart-looking Organizational Charts.
Helping to show the relationships between different positions within the same organization, the ConceptDraw DIAGRAM application created using organization charts and organizational chart solutions can be used for both individuals and employees to provide a comprehensive picture of reporting relationships, management levels, and work divisions. The Organizational Charts solution can be useful for many specialists within an organization, such as HR managers, project managers and other managers who intend to simplify their work in creating professional-looking organizational charts.
-
Install this solution Free -
What I need to get started -
Solution Requirements - This solution requires the following products to be installed:
ConceptDraw DIAGRAM v18 ConceptDraw MINDMAP v16 - This solution requires the following products to be installed:
-
Compatibility - Sonoma (14), Sonoma (15)
MS Windows 10, 11 - Sonoma (14), Sonoma (15)
-
Support for this Solution -
Helpdesk
Design Elements — Organizational Chart

Organizational Charts Examples
There are a few samples that you see on this page which were created in the ConceptDraw DIAGRAM application by using the Organizational Charts solution. Some of the solution's capabilities as well as the professional results which you can achieve are all demonstrated here on this page.
All source documents are vector graphic documents which are always available for modifying, reviewing and/or converting to many different formats, such as MS PowerPoint, PDF file, MS Visio, and many other graphic ones from the ConceptDraw Solution Park or ConceptDraw STORE. The Organizational Charts solution is available to all ConceptDraw DIAGRAM users to get installed and used while working in the ConceptDraw DIAGRAM diagramming and drawing software.
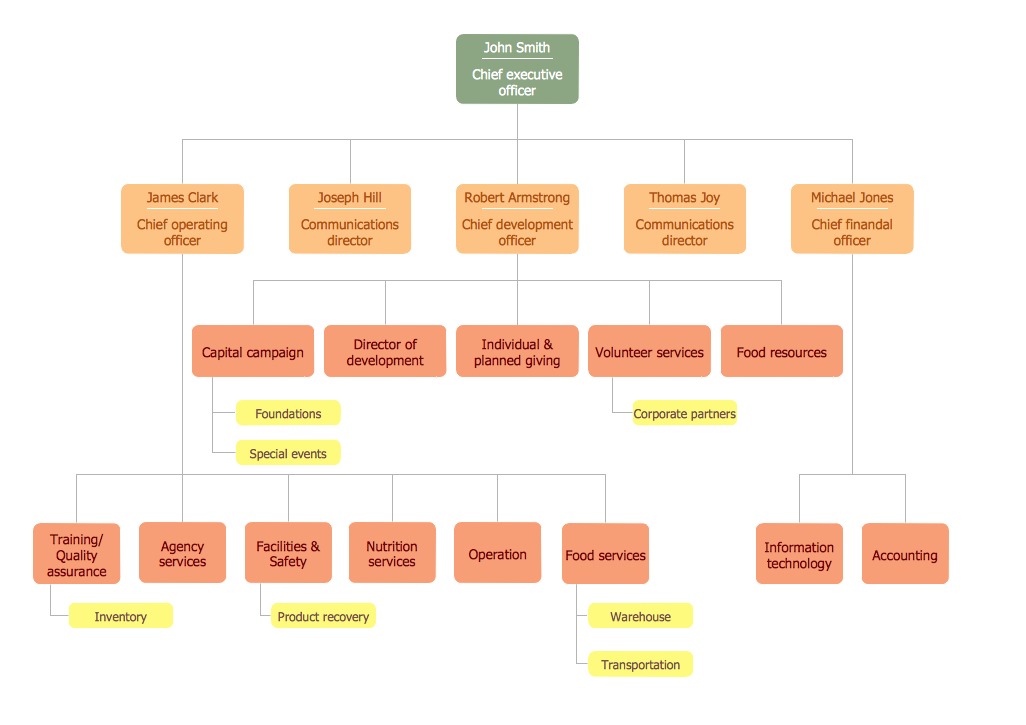
Example 1: Organizational Chart — Food Bank
This diagram was created in ConceptDraw DIAGRAM using the Organizational Chart library from the Organizational Charts Solution. An experienced user spent 10 minutes creating this sample.
This sample diagram presents the detailed structure of the charitable organization Food bank. It is a non-profit organization, which helps poor people who have difficulties with purchasing food to receive it and avoid hunger. Some of these organizations provide products directly to end users, while others operate as warehouses, food storages, or distribution depots, where products are only collected, checked for quality, sorted, saved, but do not give food directly for the poor. Food banks of the second type distribute goods to different non-profit communities, government agencies, homeless shelters, orphanages, schools, food pantries, food closets, soup kitchens, and other organizations of people in need. As for food sources, as a rule, these are manufacturers, commercial producers, distributors, retailers who have an overabundance of products that for some reason were not sold, or individual benefactors. Each level of this organizational structure is categorized by color. This allows you to look at the diagram and to see at once the highest levels of this structure.
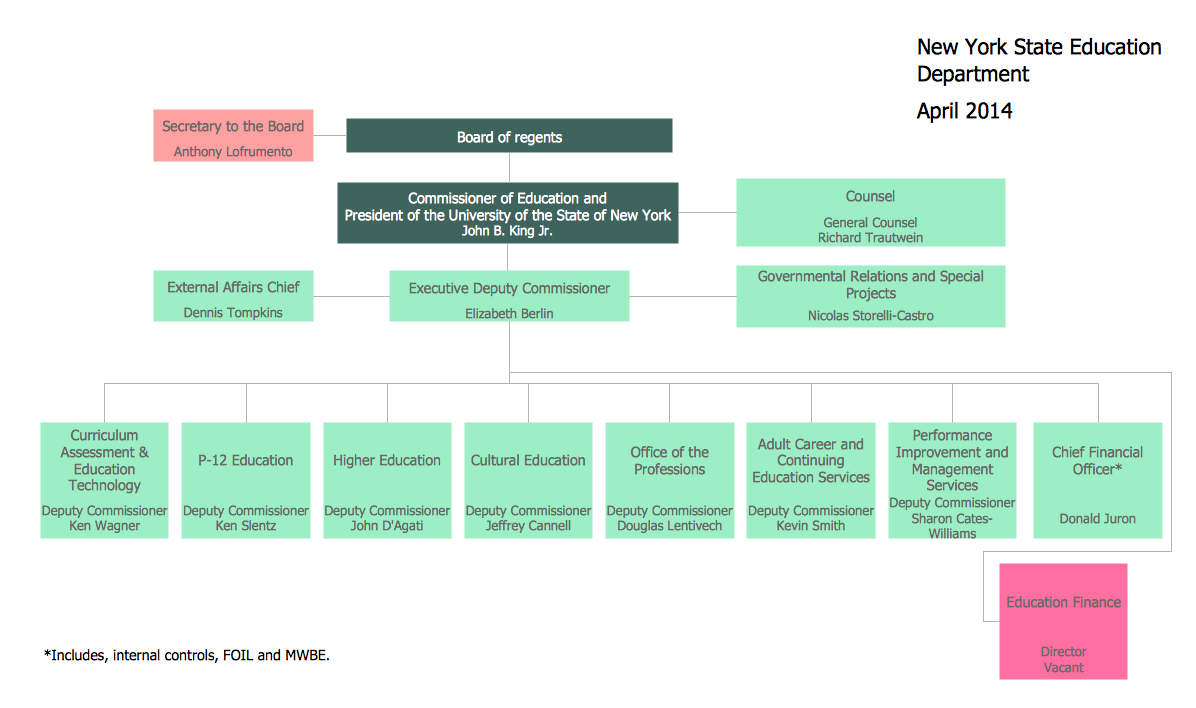
Example 2: Organisational Chart — New York State Education Department
This diagram was created in ConceptDraw DIAGRAM using the Organizational Chart library from the Organizational Charts Solution. An experienced user spent 15 minutes creating this sample.
This sample diagram visualizes the organizational chart of the New York State Education Department (NYSED), which is a part of the University of the State of New York (USNY). The diagram was designed based on the illustration from the NYSED website. NYSED is a department of the New York state government, which realizes the supervision for all public schools in New York, is occupied by production and administration of all state tests and Regents Examinations, oversees higher education, cultural institutions in New York in numerous professions. According to the listed organizational structure, NYSED is headed by the regents of the USNY and administered by the Commissioner of Education and President of the University of the State of New York. All other levels of NYSED structure are also presented. A diagram looks professional and bright, so it can be used as an illustration for presentations, conferences and other public events.
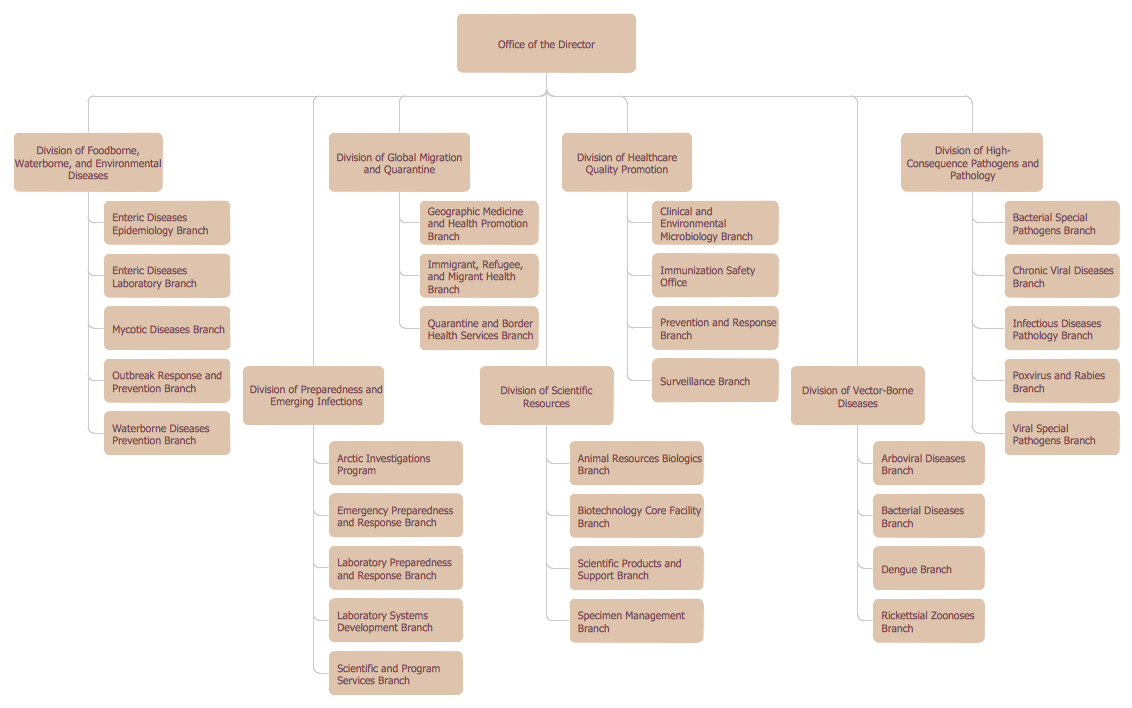
Example 3: Organizational Chart — National Center for Infectious Diseases
This diagram was created in ConceptDraw DIAGRAM using the Organizational Chart library from the Organizational Charts Solution. An experienced user spent 15 minutes creating this sample.
This sample diagram shows the structure of the National Center for Emerging and Zoonotic Infectious Diseases (NCEZID). It was designed based on the organizational chart from the NCEZID website. Zoonotic diseases are a kind of diseases caused by germs spread by animals. The National Center for Emerging and Zoonotic Infectious Diseases is occupied by prevention diseases, disabilities, and death caused by a wide range of infectious diseases existing a long time, emerging diseases, recently identified, and zoonotic diseases. Using a variety of tactics, conducting researches, establishing public health policy, strengthening preparedness efforts, providing leadership in public health, sharing vital health information with the public, and building partnerships NCEZID aims to protect people around the world from all types of infections, achieve better health for humans and animals, as well as improve the environment. Using the predesigned objects from the ConceptDraw DIAGRAM libraries, you can illustrate the structure of an organization of any size in just a few minutes.
Example 4: Organizational Chart — University Leadership
This diagram was created in ConceptDraw DIAGRAM using the Organizational Chart library from the Organizational Charts Solution. An experienced user spent 15 minutes creating this sample.
This Organizational chart sample shows the structure of Ohio State University and the relationships between its departments. The sample was constructed based on the diagram from the Ohio State University website. It is a world-class public teaching and research university, one of the leading universities in the United States, founded in Ohio State in 1870. Since that time it provides students with wide opportunities for education in different specialties. Ohio State University is a multi-campus land grant institution with an international presence, which students can use the advantages of more than 200 academic centers and institutes. At the head of the university structure, you can see the Trustees, the President who runs the university, at the level below can be seen Executive Vice President, Provost, senior VPs, and other administrative people. It is useful to present this structure in the form of an Organizational chart. The use of color gradation helps easily make any necessary accents.

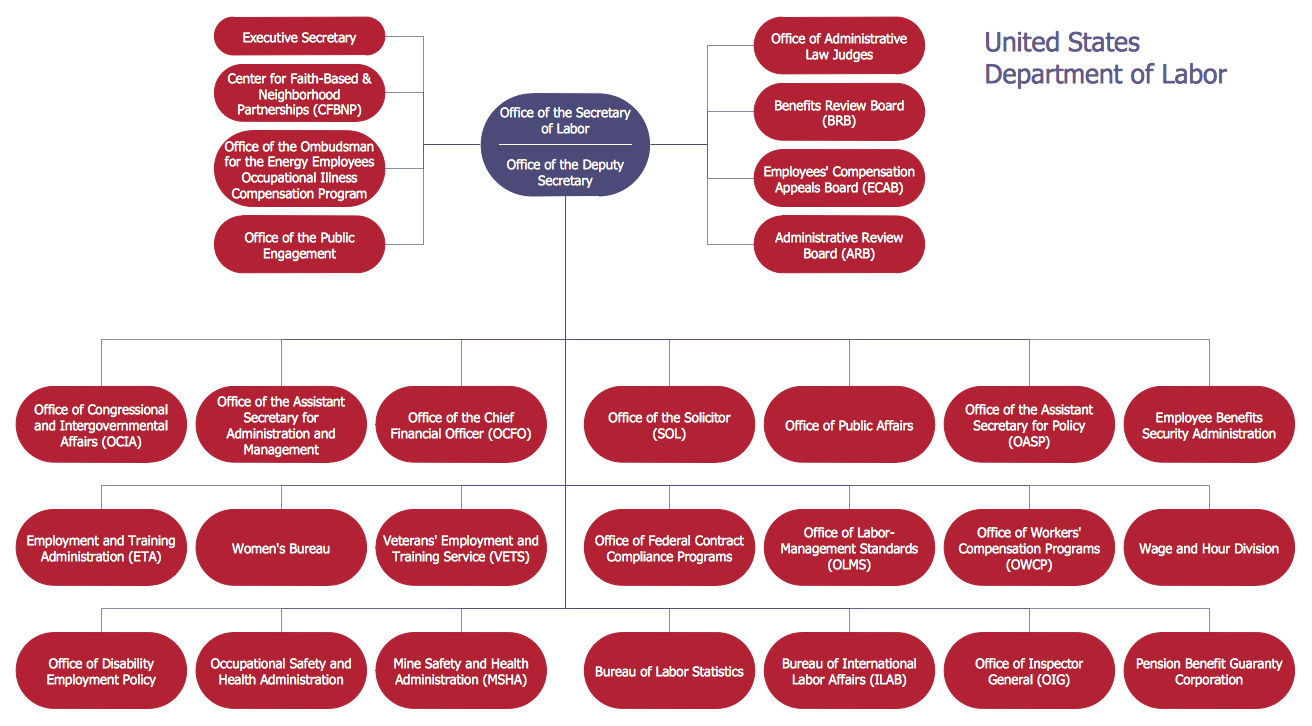
Example 5: Organizational Chart — United States Department of Labor
This diagram was created in ConceptDraw DIAGRAM using the Organizational Chart library from the Organizational Charts Solution. An experienced user spent 15 minutes creating this sample.
This sample diagram shows the organizational chart of the United States Department of Labor (DOL), which was designed based on the figure from the website of the U.S. Department of Labor. It is a cabinet-level department of the U.S. federal government, which is occupied by safety, wage and unemployment insurance benefits, hour standards, re-employment services, and economic statistics. The department activity is aimed at promotion and development the welfare of job seekers, wage earners, and retirees, their fostering by advancing opportunities for profitable employment and improving working conditions, assuring work-related benefits and rights. As you can see in the diagram, the U.S. Department of Labor is headed by the U.S. Secretary of Labor. The Deputy Secretary is at the second level by importance. Many departments subordinate to both of them are listed at the levels of this organizational structure. The diagram is clear, efficient, attractive, and easy to remember. Now you can quickly and easily design your own professional Organizational charts with ConceptDraw DIAGRAM!
Inside


What I Need to Get Started
Both ConceptDraw DIAGRAM diagramming and drawing software and the Organizational Charts solution can help creating the business planning diagrams you need. The Organizational Charts solution can be found in the Management area of ConceptDraw STORE application that can be downloaded from this site. Make sure that both ConceptDraw DIAGRAM and ConceptDraw STORE applications are installed on your computer before you get started.
How to install
After ConceptDraw STORE and ConceptDraw DIAGRAM are downloaded and installed, you can install the Organizational Charts solution from the ConceptDraw STORE.

Start using
To make sure that you are doing it all right, use the pre-designed symbols from the stencil libraries from the solution to make your drawings look smart and professional. Also, the pre-made examples from this solution can be used as drafts so your own drawings can be based on them. Using the samples, you can always change their structures, colors and data.
