- Electric and Telecom Plans Free
- Fire and Emergency Plans Free
- Floor Plans Free
- Plant Layout Plans Free
- School and Training Plans Free
- Seating Plans Free
- Security and Access Plans Free
- Site Plans Free
- Sport Field Plans Free
- Business Process Diagrams Free
- Business Process Mapping Free
- Classic Business Process Modeling Free
- Cross-Functional Flowcharts Free
- Event-driven Process Chain Diagrams Free
- IDEF Business Process Diagrams Free
- Logistics Flow Charts Free
- Workflow Diagrams Free
- ConceptDraw Dashboard for Facebook Free
- Mind Map Exchange Free
- MindTweet Free
- Note Exchange Free
- Project Exchange Free
- Social Media Response Free
- Active Directory Diagrams Free
- AWS Architecture Diagrams Free
- Azure Architecture Free
- Cisco Network Diagrams Free
- Cisco Networking Free
- Cloud Computing Diagrams Free
- Computer Network Diagrams Free
- Google Cloud Platform Free
- Interactive Voice Response Diagrams Free
- Network Layout Floor Plans Free
- Network Security Diagrams Free
- Rack Diagrams Free
- Telecommunication Network Diagrams Free
- Vehicular Networking Free
- Wireless Networks Free
- Comparison Dashboard Free
- Composition Dashboard Free
- Correlation Dashboard Free
- Frequency Distribution Dashboard Free
- Meter Dashboard Free
- Spatial Dashboard Free
- Status Dashboard Free
- Time Series Dashboard Free
- Basic Circle-Spoke Diagrams Free
- Basic Circular Arrows Diagrams Free
- Basic Venn Diagrams Free
- Block Diagrams Free
- Concept Maps Free
- Family Tree Free
- Flowcharts Free
- Basic Area Charts Free
- Basic Bar Graphs Free
- Basic Divided Bar Diagrams Free
- Basic Histograms Free
- Basic Line Graphs Free
- Basic Picture Graphs Free
- Basic Pie Charts Free
- Basic Scatter Diagrams Free
- Aerospace and Transport Free
- Artwork Free
- Audio, Video, Media Free
- Business and Finance Free
- Computers and Communications Free
- Holiday Free
- Manufacturing and Maintenance Free
- Nature Free
- People Free
- Presentation Clipart Free
- Safety and Security Free
- Analog Electronics Free
- Audio and Video Connectors Free
- Basic Circuit Diagrams Free
- Chemical and Process Engineering Free
- Digital Electronics Free
- Electrical Engineering Free
- Electron Tube Circuits Free
- Electronic Block Diagrams Free
- Fault Tree Analysis Diagrams Free
- GHS Hazard Pictograms Free
- Home Automation and Wiring Free
- Mechanical Engineering Free
- One-line Diagrams Free
- Power Сircuits Free
- Specification and Description Language (SDL) Free
- Telecom and AV Circuits Free
- Transport Hazard Pictograms Free
- Data-driven Infographics Free
- Pictorial Infographics Free
- Spatial Infographics Free
- Typography Infographics Free
- Calendars Free
- Decision Making Free
- Enterprise Architecture Diagrams Free
- Fishbone Diagrams Free
- Organizational Charts Free
- Plan-Do-Check-Act (PDCA) Free
- Seven Management and Planning Tools Free
- SWOT and TOWS Matrix Diagrams Free
- Timeline Diagrams Free
- Australia Map Free
- Continent Maps Free
- Directional Maps Free
- Germany Map Free
- Metro Map Free
- UK Map Free
- USA Maps Free
- Customer Journey Mapping Free
- Marketing Diagrams Free
- Matrices Free
- Pyramid Diagrams Free
- Sales Dashboard Free
- Sales Flowcharts Free
- Target and Circular Diagrams Free
- Cash Flow Reports Free
- Current Activities Reports Free
- Custom Excel Report Free
- Knowledge Reports Free
- MINDMAP Reports Free
- Overview Reports Free
- PM Agile Free
- PM Dashboards Free
- PM Docs Free
- PM Easy Free
- PM Meetings Free
- PM Planning Free
- PM Presentations Free
- PM Response Free
- Resource Usage Reports Free
- Visual Reports Free
- House of Quality Free
- Quality Mind Map Free
- Total Quality Management TQM Diagrams Free
- Value Stream Mapping Free
- Astronomy Free
- Biology Free
- Chemistry Free
- Language Learning Free
- Mathematics Free
- Physics Free
- Piano Sheet Music Free
- Android User Interface Free
- Class Hierarchy Tree Free
- Data Flow Diagrams (DFD) Free
- DOM Tree Free
- Entity-Relationship Diagram (ERD) Free
- EXPRESS-G data Modeling Diagram Free
- IDEF0 Diagrams Free
- iPhone User Interface Free
- Jackson Structured Programming (JSP) Diagrams Free
- macOS User Interface Free
- Object-Role Modeling (ORM) Diagrams Free
- Rapid UML Free
- SYSML Free
- Website Wireframe Free
- Windows 10 User Interface Free
Decision Making
The decision-making is a process or a problem-solving activity resulting in the selection the correct course or problem's decision among the several alternative possibilities. Mostly, it is a complex process, especially in conditions of risk, that can be met in a wide variety of fields, such as a business, management, marketing, medicine, healthcare, education, government, industry, shipbuilding, and many others. However, the process of decision-making becomes easier by means of applying the special techniques, methods, and strategies, among them, there is conduction of Analytic Hierarchy Process (AHP), construction of Decision tree, Decision flowchart or Influence diagram. The Decision tree is a map representing the series of related choices and possible outcomes. Typically, it starts with a single node that branches out into the outcomes, each of which in its turn branches out into additional nodes and other possibilities, so forming a tree structure, and lets one easily make the correct choice and obtain the best decision.
The decision tree analysis has many advantages, it suits almost any business situations and is a great way to choose the strategy of successive actions in conditions of risk. Thus, the decision trees are popular because they are flexible, easy to understand and use, and remain those at the great extension of options, they visually demonstrate the cause-and-effect relationships, allow considering the untypical or unordinary situations and select several options for their resolution, as well as help to pick up the best of several options, can be used in combination with other decision making tools, and allow adding the new options to existing trees. However, in the most complex cases, the best alternative to the Decision tree is Influence diagram that is narrow to the critical decisions, inputs, and objectives.
The Decision Making solution extends the ConceptDraw DIAGRAM software with a set of professionally developed examples, powerful drawing tools and a wide range of libraries with specific ready-made vector design elements of decision icons, decision pictograms, decision flowchart elements, decision tree icons, decision signs arrows, and callouts, allowing one to design Decision diagrams, Business decision maps, Decision flowcharts, Decision trees, Decision matrix, T Chart, Influence diagrams, which are powerful in questions of decision making and holding the decision tree analysis and Analytic Hierarchy Process (AHP). With all these tools each decision maker can decompose the decision problem into the hierarchy of easily comprehensible sub-problems, to represent all this in a form of visual and professional-looking Decision diagram, even if it does not have drawing and design skills, then to analyze each sub-problem independently or a whole diagram at once, and to make correct decision without any efforts.
-
Install this solution Free -
What I need to get started -
Solution Requirements - This solution requires the following products to be installed:
ConceptDraw DIAGRAM v18 - This solution requires the following products to be installed:
-
Compatibility - Sonoma (14), Sonoma (15)
MS Windows 10, 11 - Sonoma (14), Sonoma (15)
-
Support for this Solution -
Helpdesk
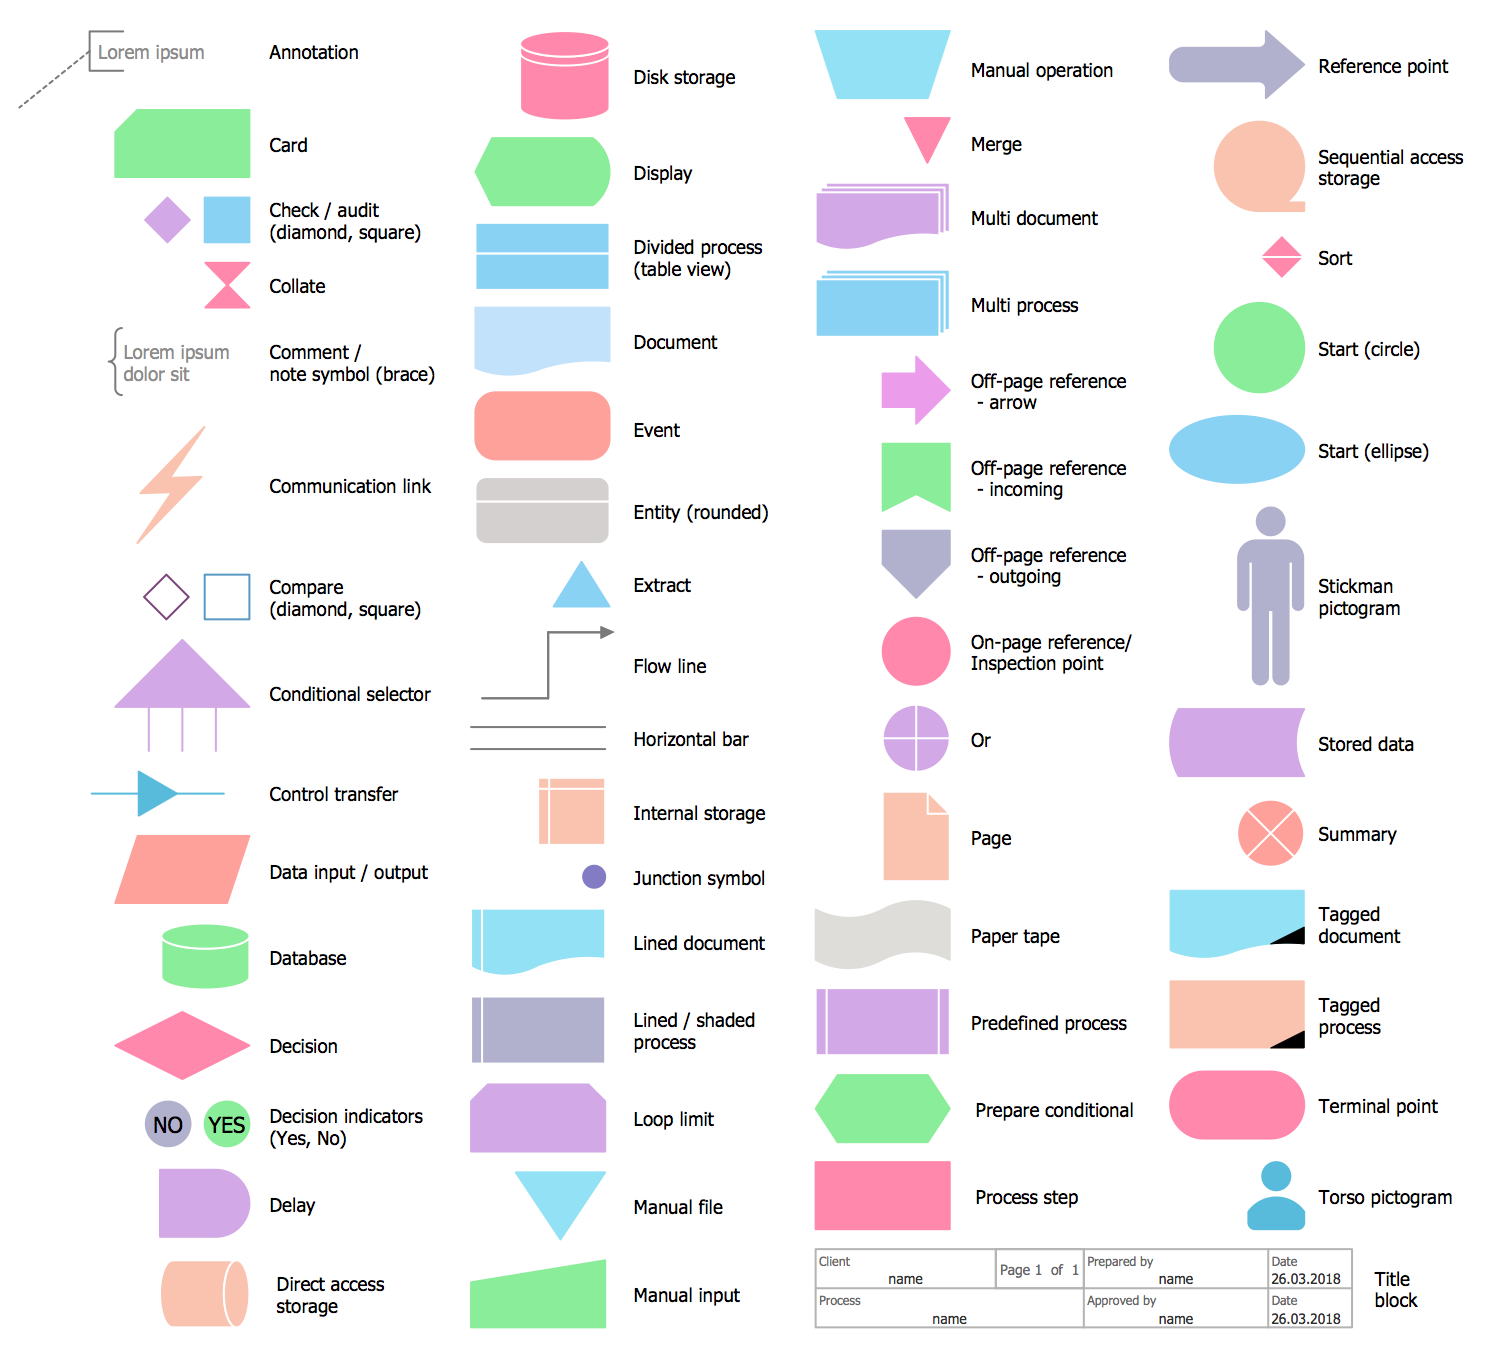
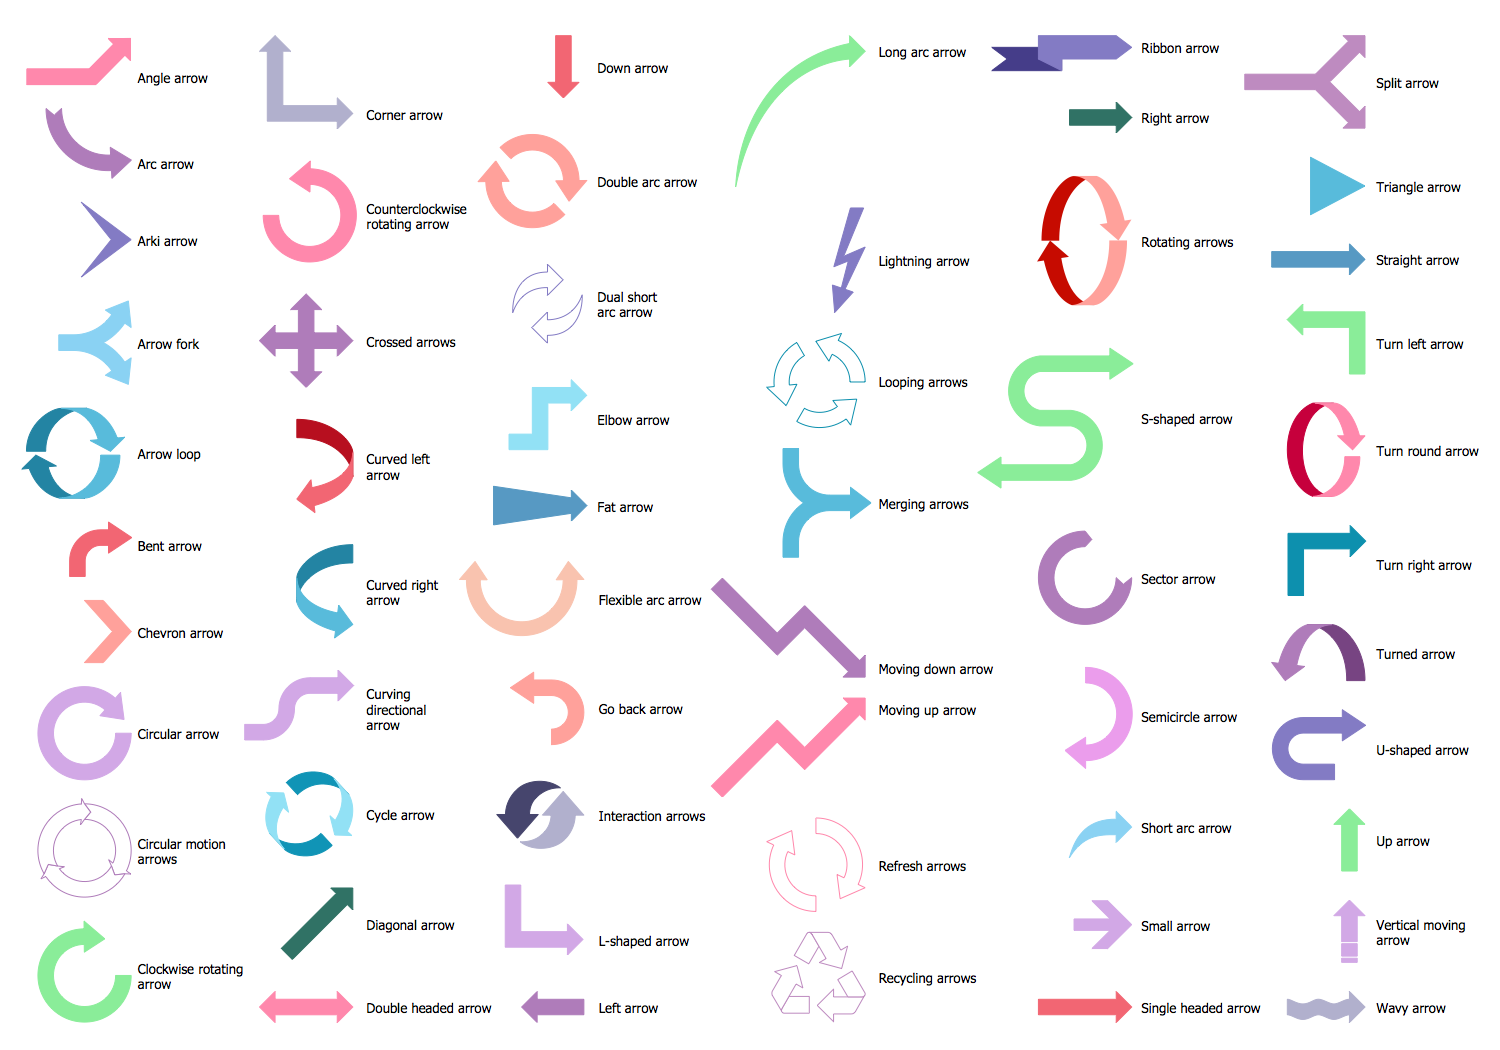
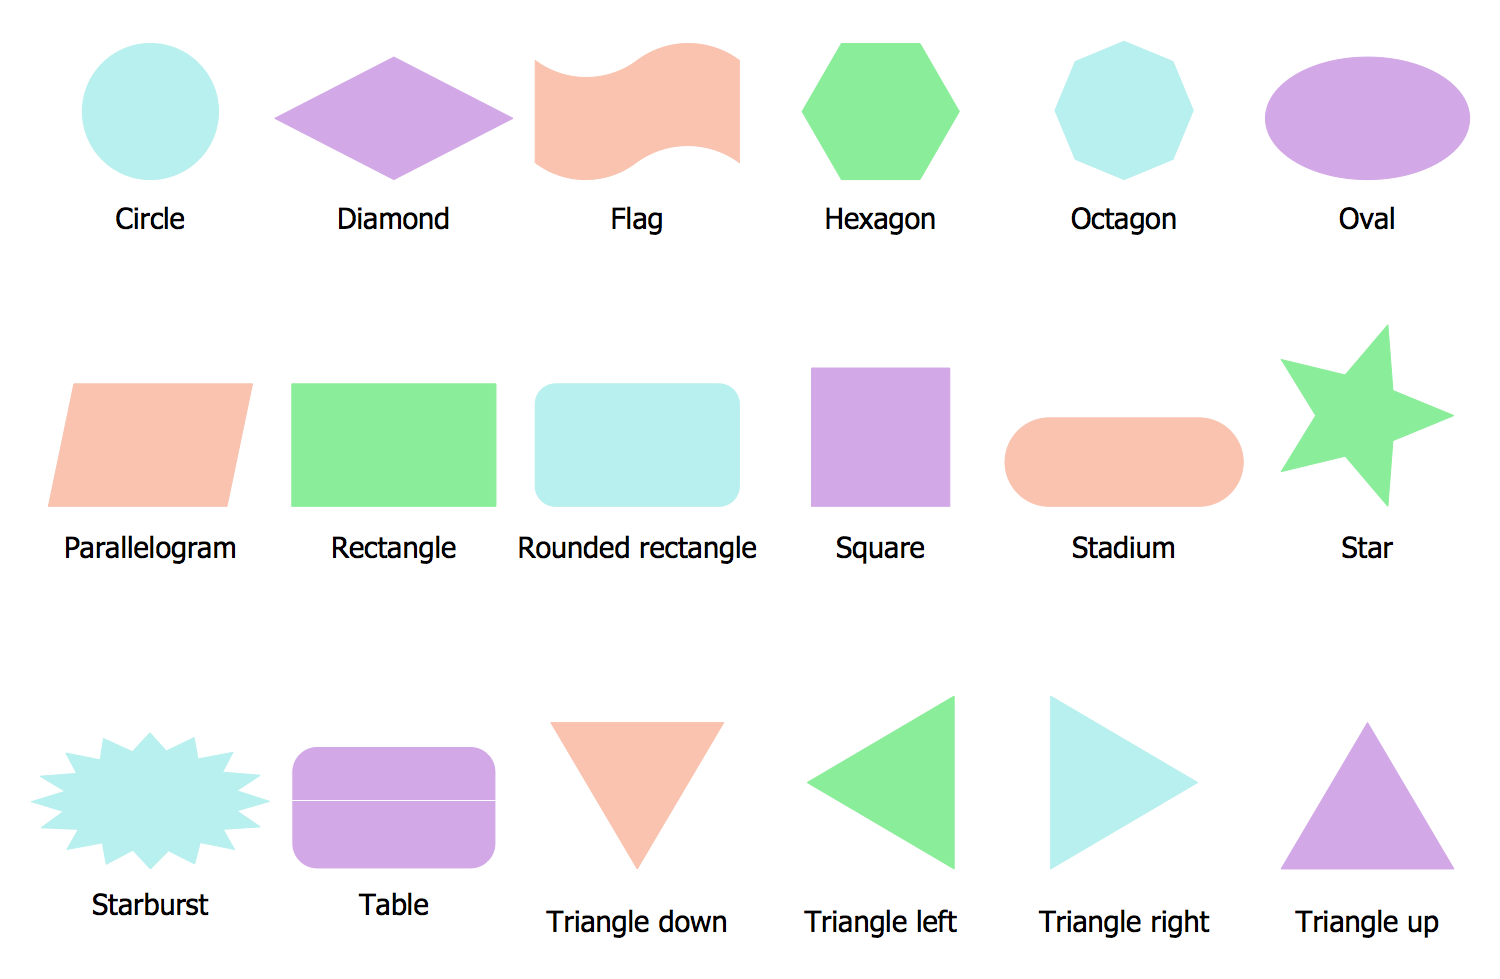
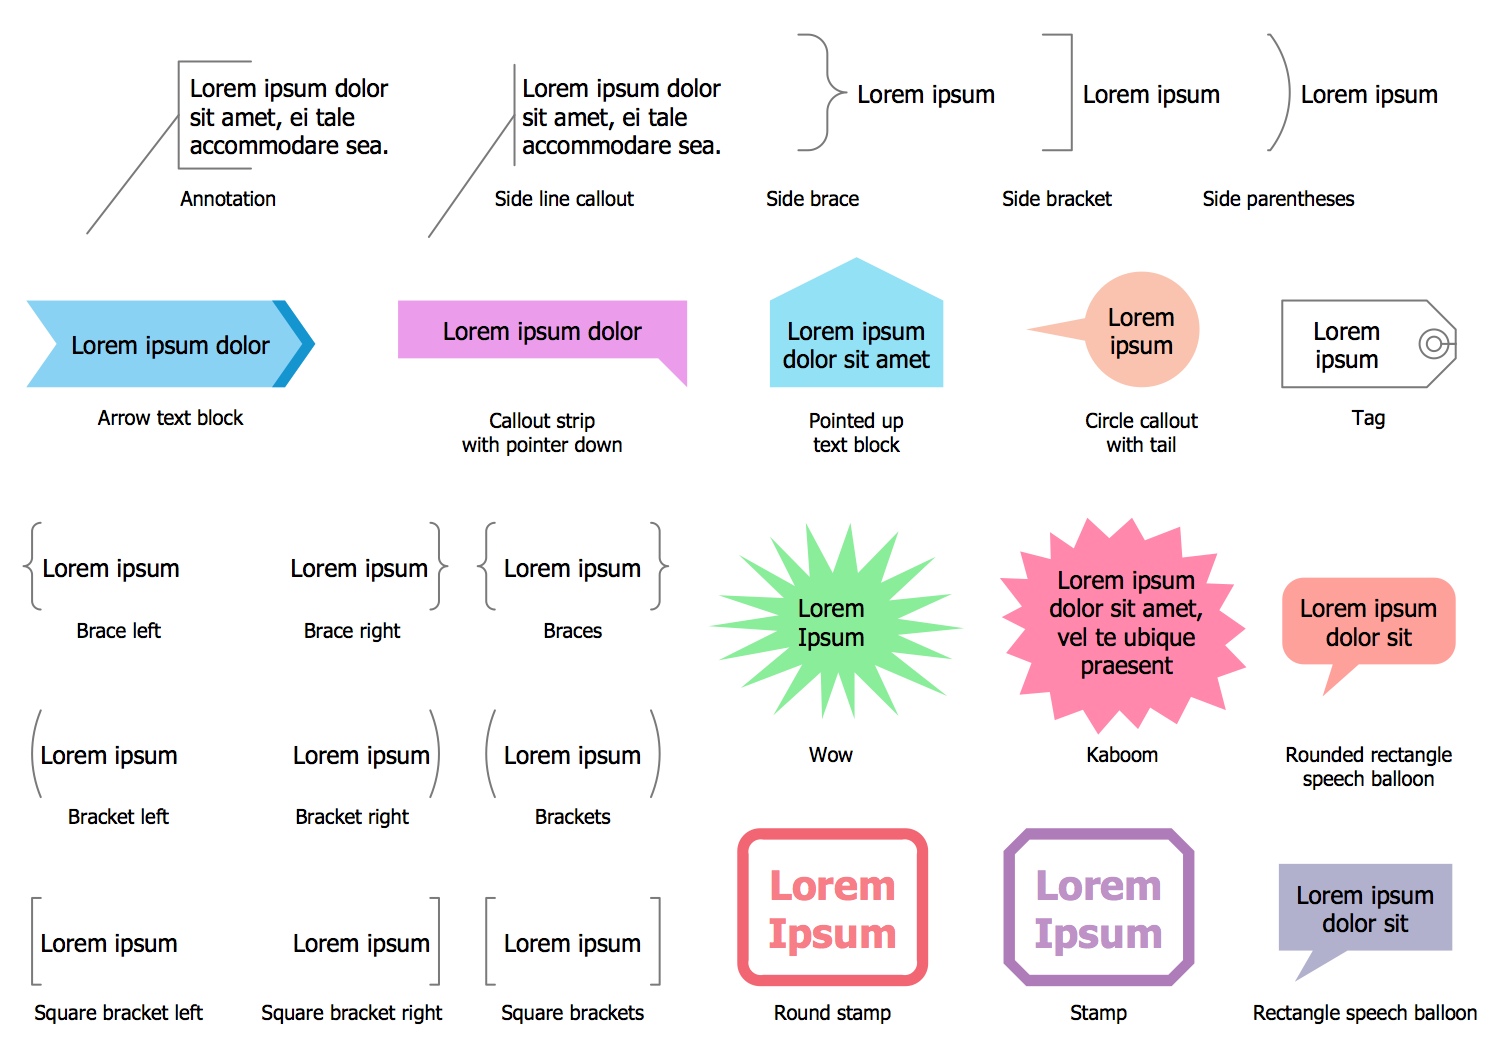
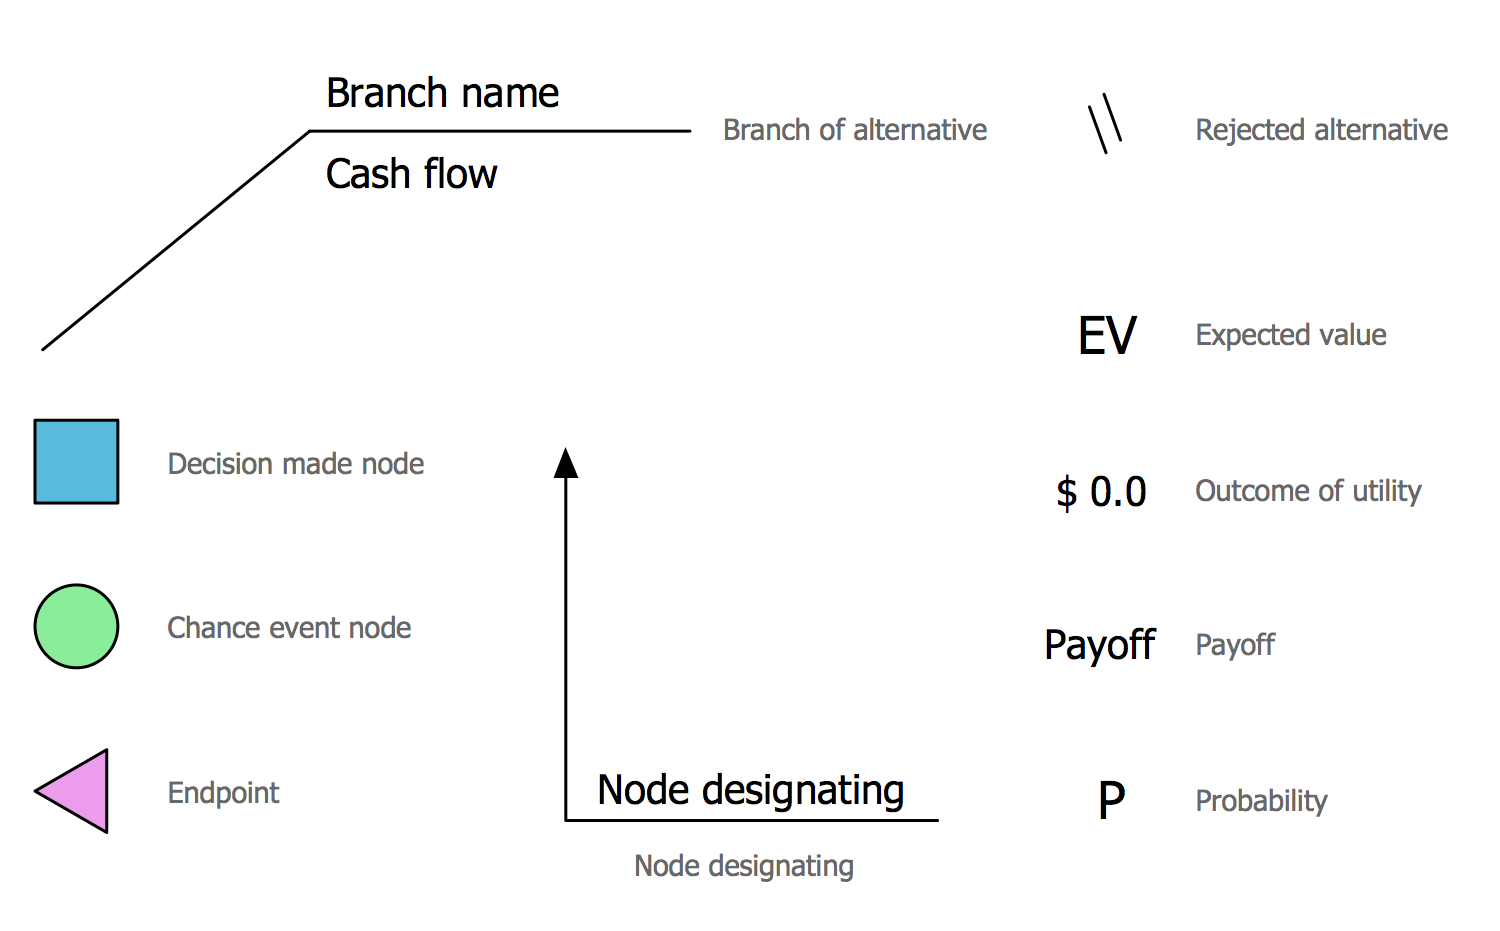
There are 7 stencil libraries containing 287 vector shapes in the Decision Making solution.
Design Elements — Decision Icons
Design Elements — Decision Flowchart
Design Elements — Decision Arrows
Design Elements — Decision Diagram
Design Elements — Decision Callouts
Design Elements — Decision Signs
Design Elements — Decision Tree
Related News:
Decision Making Examples
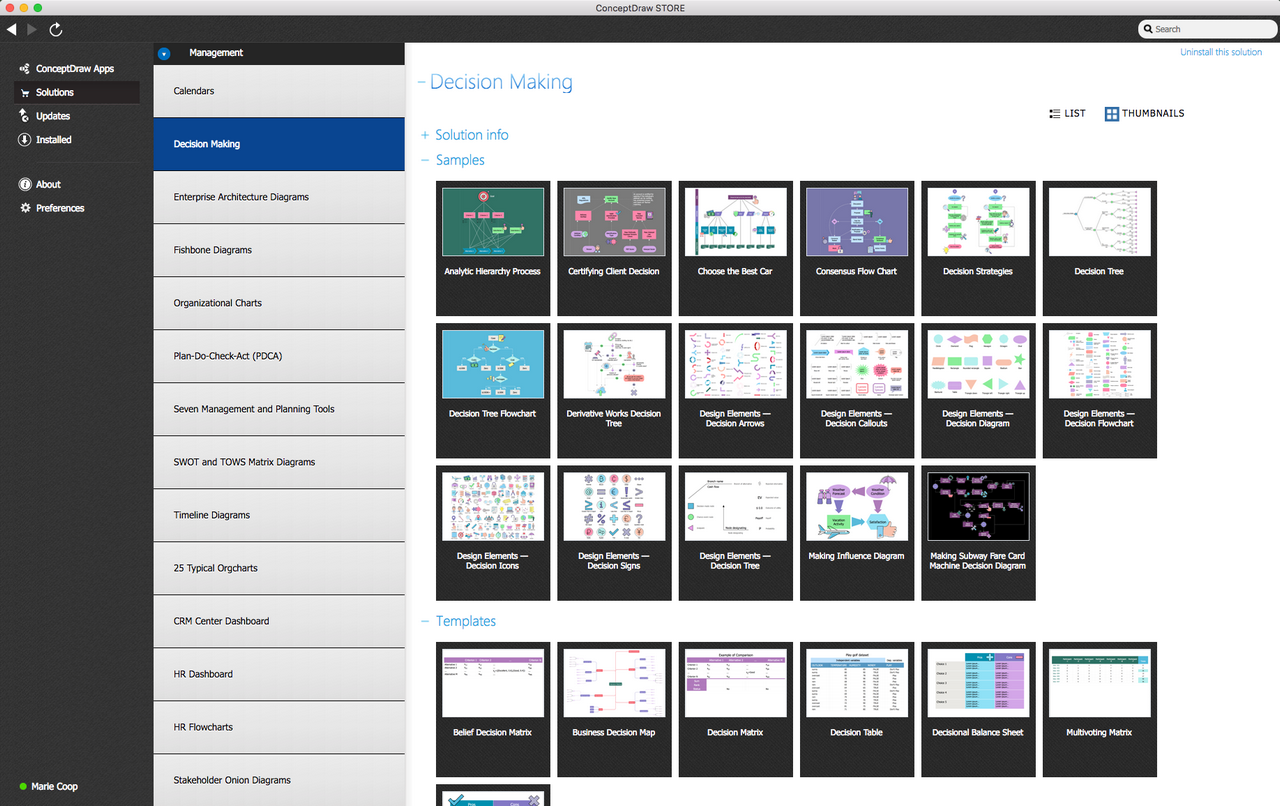
There are a few samples that you see on this page which were created in the ConceptDraw DIAGRAM application by using the Decision Making solution. Some of the solution's capabilities as well as the professional results which you can achieve are all demonstrated here on this page.
All source documents are vector graphic documents which are always available for modifying, reviewing and/or converting to many different formats, such as MS PowerPoint, PDF file, MS Visio, and many other graphic ones from the ConceptDraw Solution Park or ConceptDraw STORE. The Decision Making solution is available to all ConceptDraw DIAGRAM users to get installed and used while working in the ConceptDraw DIAGRAM diagramming and drawing software.
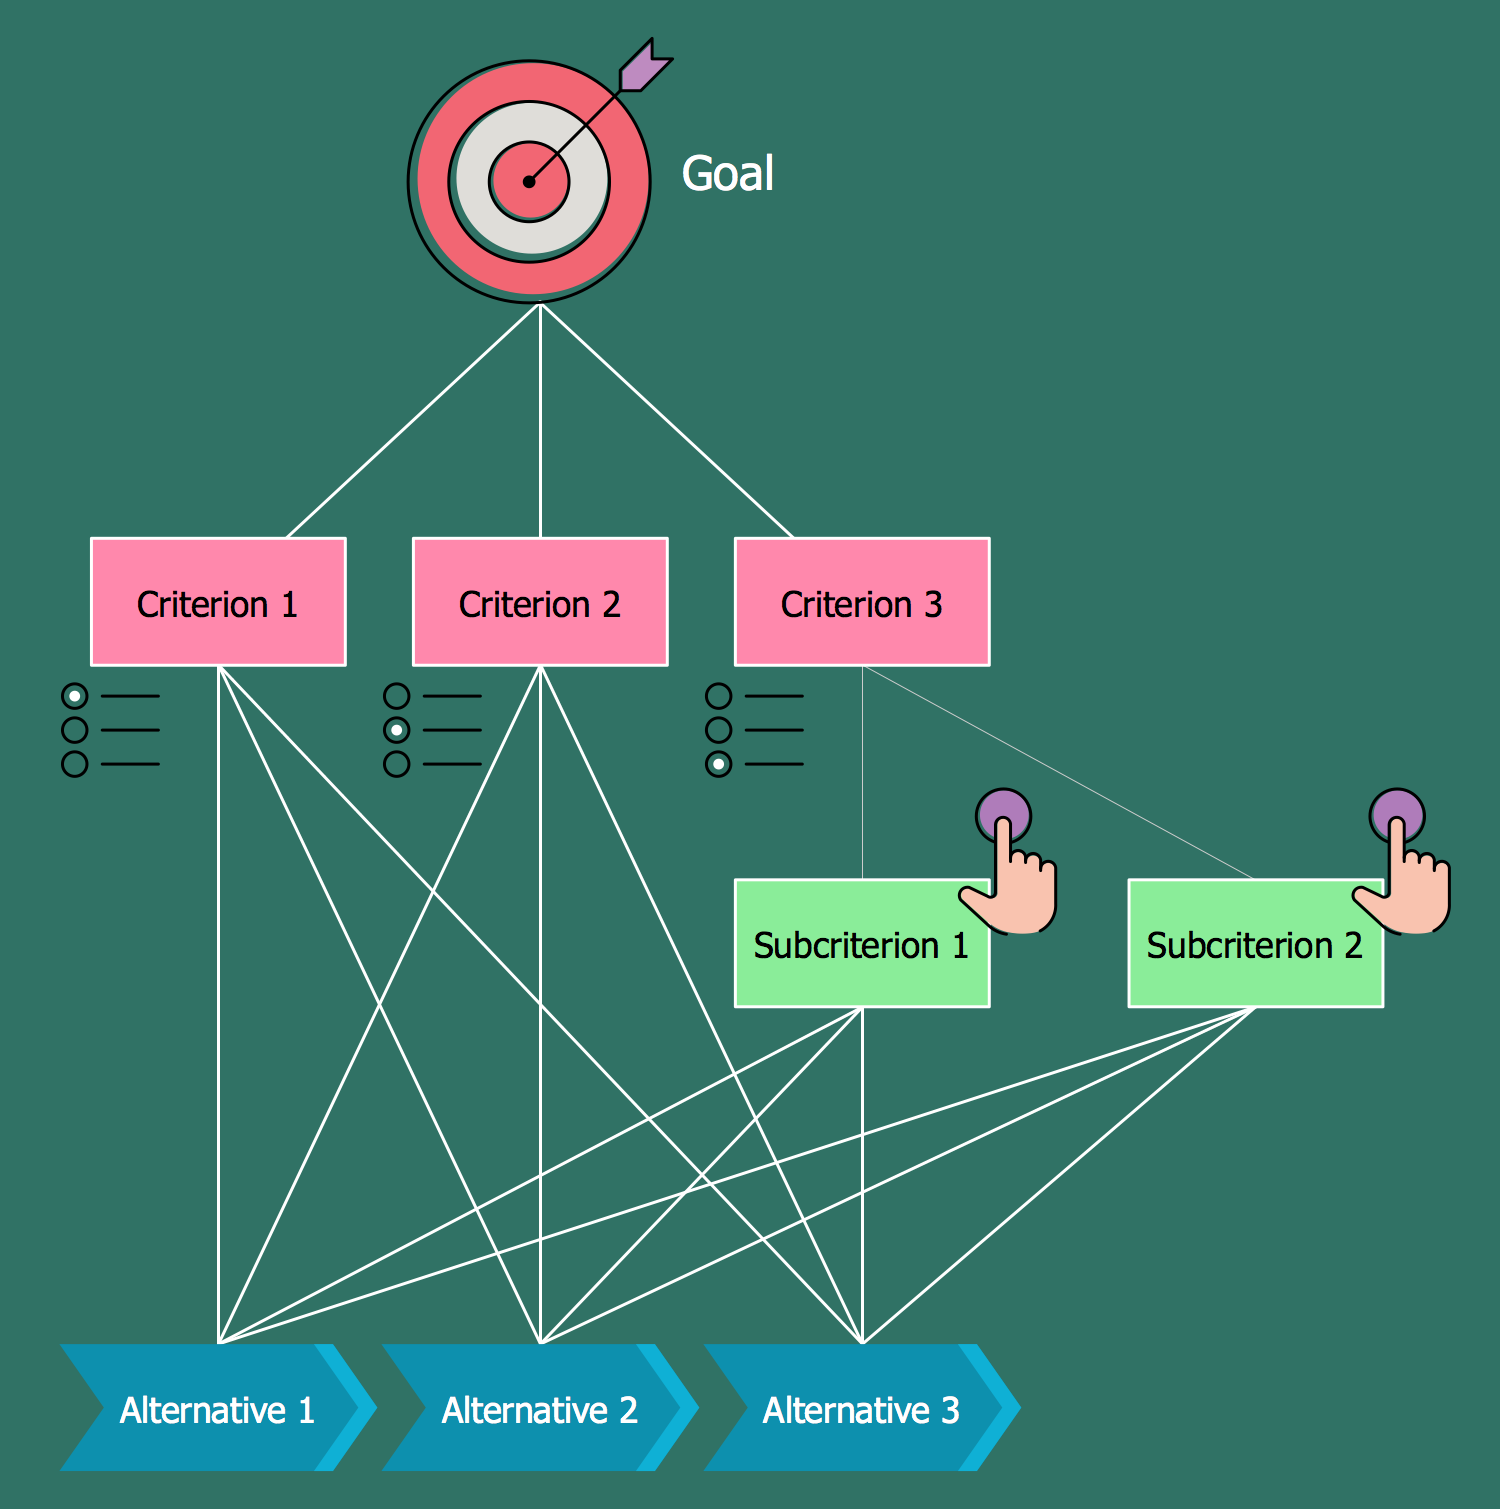
Example 1: Analytic Hierarchy Process
This diagram was created in ConceptDraw DIAGRAM using the composition of libraries from the Decision Making solution. An experienced user spent 10 minutes creating this sample.
This sample demonstrates the analytic hierarchy process (AHP), which is a structured technique used for organizing analysis and making complex decisions. Developed by Thomas L. Saaty in the 1970s and based on mathematics and psychology, this technique is now improved, and finds practical application in a variety of decision situations and lets one decompose the complex problem into a hierarchy of more comprehensible sub-problems. The analytic hierarchy process does not give the answer to the question of what is right and what is wrong, but it lets the decision maker assess which of considered options suits the best for its needs and for its understanding of problem, task or situation. Typically, the AHP is applied to such types of tasks as the selection of the alternative from many ones, the ranking or prioritization several alternatives according to their degrees of importance or other criteria, identification importance of one relative to other, resources allocation, comparison with samples, quality assessment.
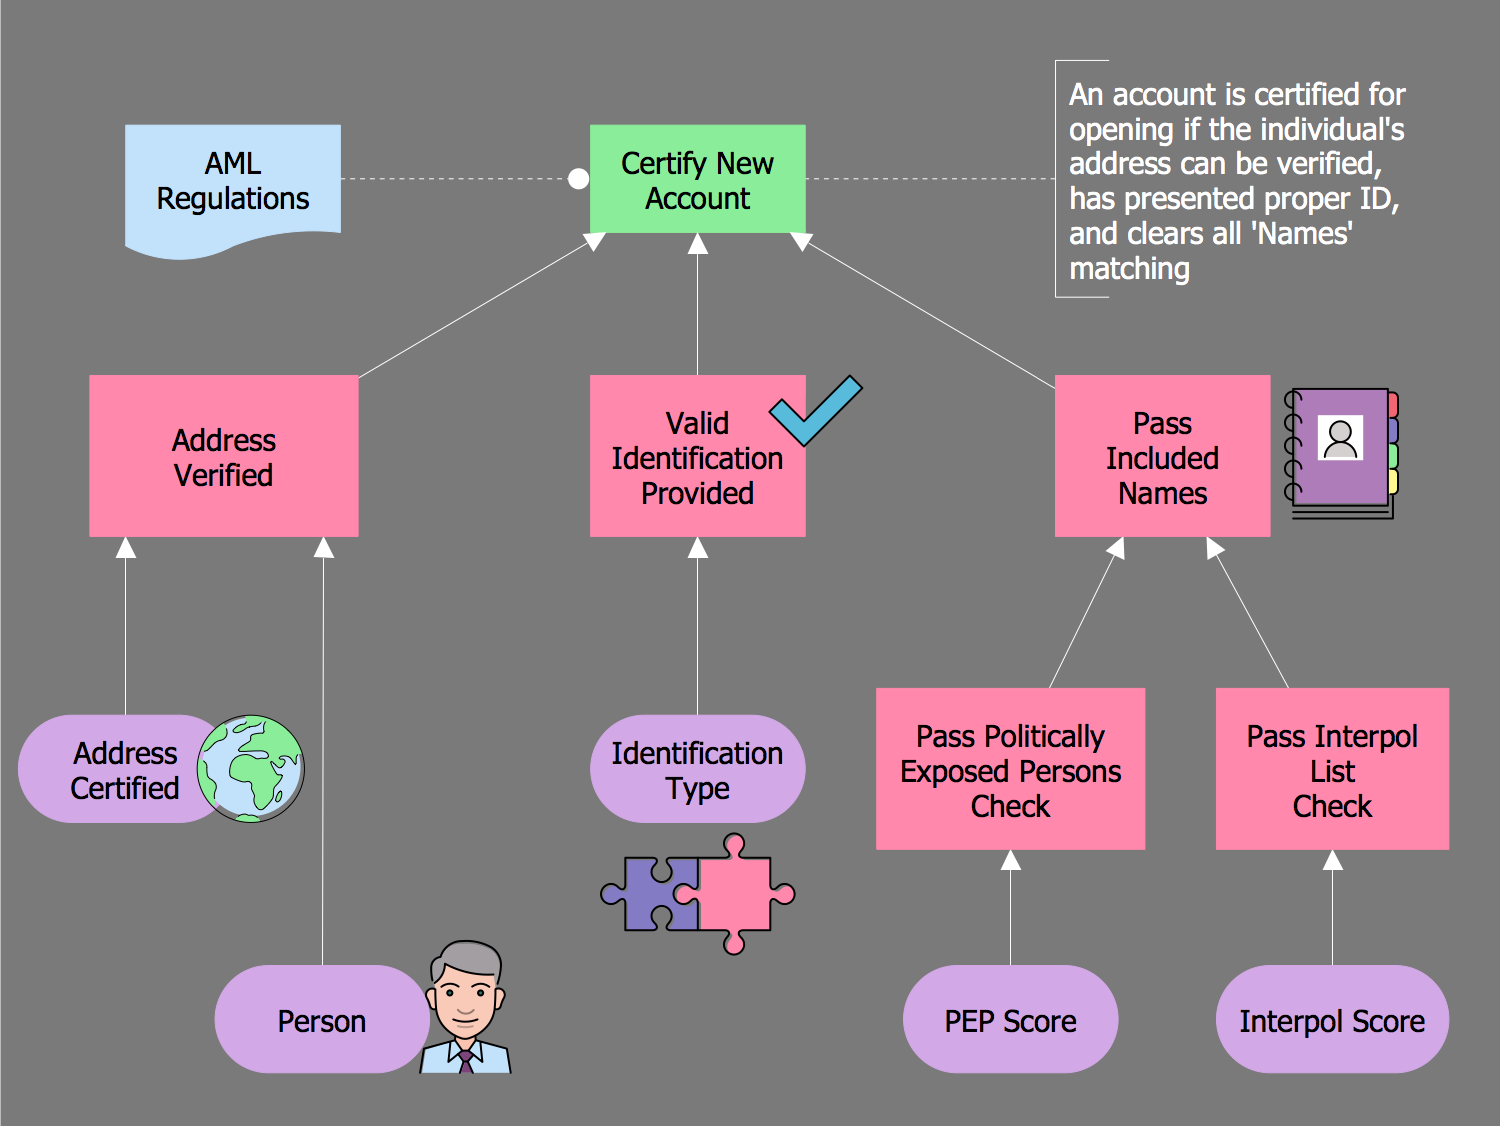
Example 2: Certifying Client Decision
This diagram was created in ConceptDraw DIAGRAM using the composition of libraries from the Decision Making solution. An experienced user spent 10 minutes creating this sample.
This sample illustrates the decision requirements graph (DRG) for new client account certification. You can see the most important elements involved in making a decision about certification and dependencies between them. According to this diagram, the process of making positive decision about certification the new client is based on the analysis the information about verification this individual’s address and person's proper ID (driver's license, passport or government issued ID), on the verification the information that the applicant is not on the list of criminals or politically exposed persons, and clearing all matching names. It is a good example of precise depiction the logic structure and list of data associated with account's verification before any making decision. Besides, made with help of predesigned objects from the Decision Making solution libraries and organized in bright colors, this graph is incredibly pleasant and can easily attract the attention of the audience when used in publications, documents, on posters, presentation slides, etc.
Example 3: Choose the Best Car
This diagram was created in ConceptDraw DIAGRAM using the composition of libraries from the Decision Making Solution. An experienced user spent 10 minutes creating this sample.
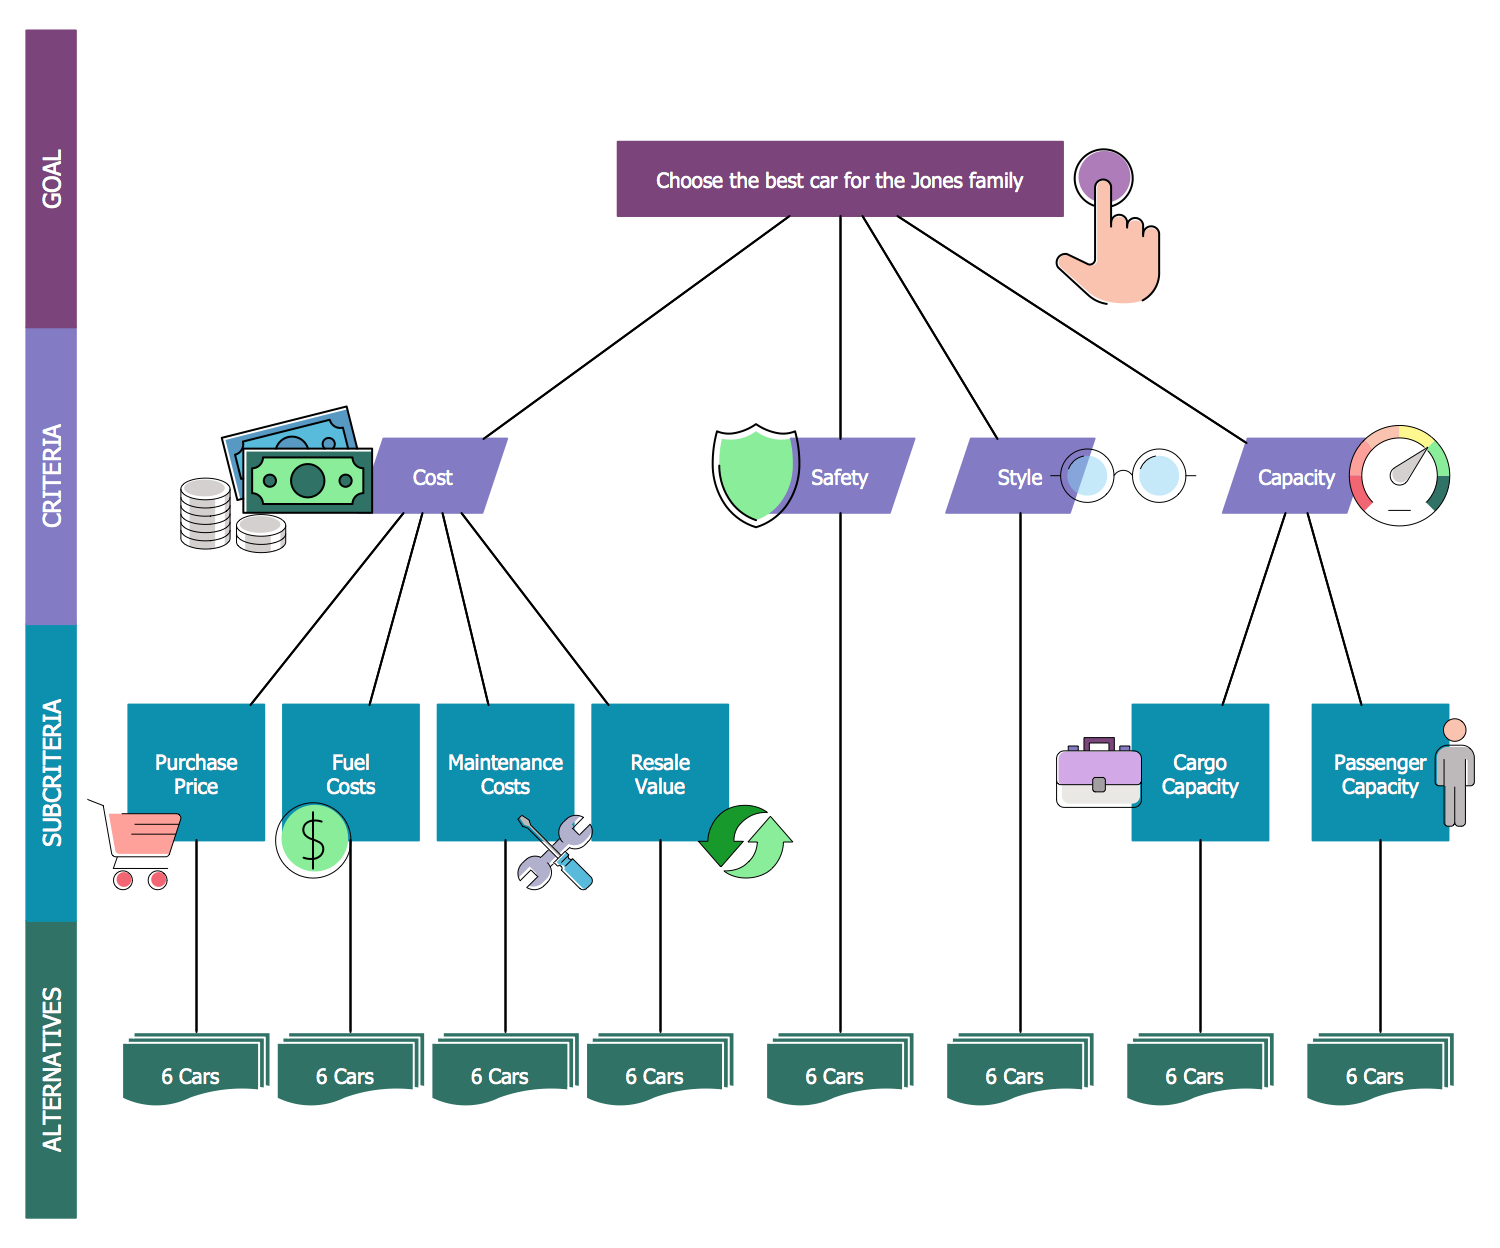
This sample shows the use of the analytic hierarchy process (AHP) in a practical decision situation of choosing the best car for own use by a single family, so we have the main goal that is defined at the top of this diagram. Making the choice the family considers such criteria as cost, safety, style, and capacity, and sub-criteria for some of the listed criteria. Thus, the cost criteria are subdivided to the purchase price, fuel costs, maintenance costs, and resale value; the capacity criteria in their turn are subdivided to the cargo capacity and passenger capacity. Defined cars' quantities satisfy each criterion and sub-criterion, these values are depicted on the corresponding objects placed at the bottom of the diagram. So, this diagram visually describes all criteria of choice, in a given case, choice of a car, but in such way, you can make the scheme of analytic hierarchy process for making a decision according to any other object you desire.
Example 4: Consensus Flow Chart
This diagram was created in ConceptDraw DIAGRAM using the composition of libraries from the Decision Making solution. An experienced user spent 10 minutes creating this sample.
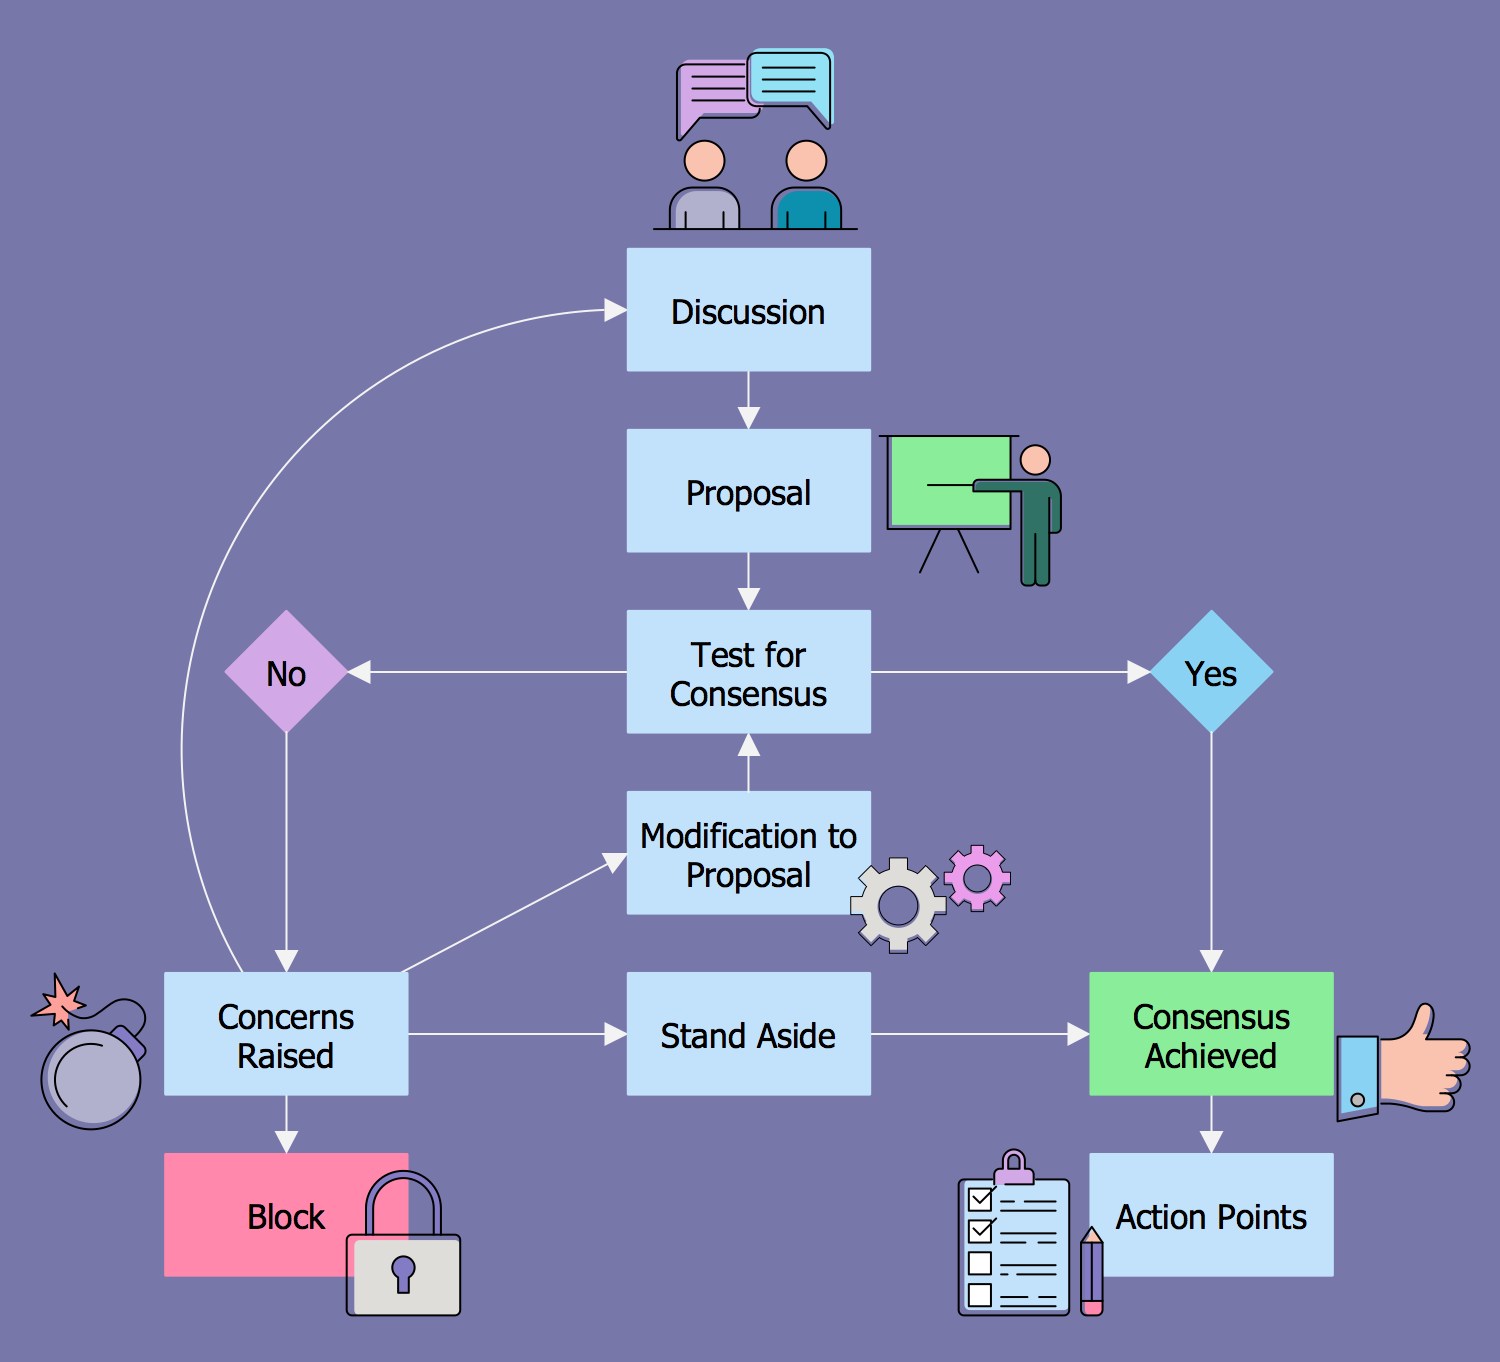
This flowchart example illustrates the consensus-based decision-making. The consensus is a process, during which a group of people develops, agrees, and makes the decision that best suits for the interests of a whole group and each participant of this group. In other words, the consensus is an acceptable resolution or compromise, which can be approved and supported, even if it is not the best from the point of view of each member of this group of people. So, the consensus is a complex process, which includes the proposals, their discussion, testing on achievement the consensus, and finally the making a consensus-based decision. At the stage of making the test for consensus, some of the proposals and raised concerns can require modifications before they are left aside or a single is accepted as consensus. Besides, this process contains action points and has the social, economic, environmental, legal, and political effects from its application.
Example 5: Decision Strategies
This diagram was created in ConceptDraw DIAGRAM using the composition of libraries from the Decision Making solution. An experienced user spent 10 minutes creating this sample.
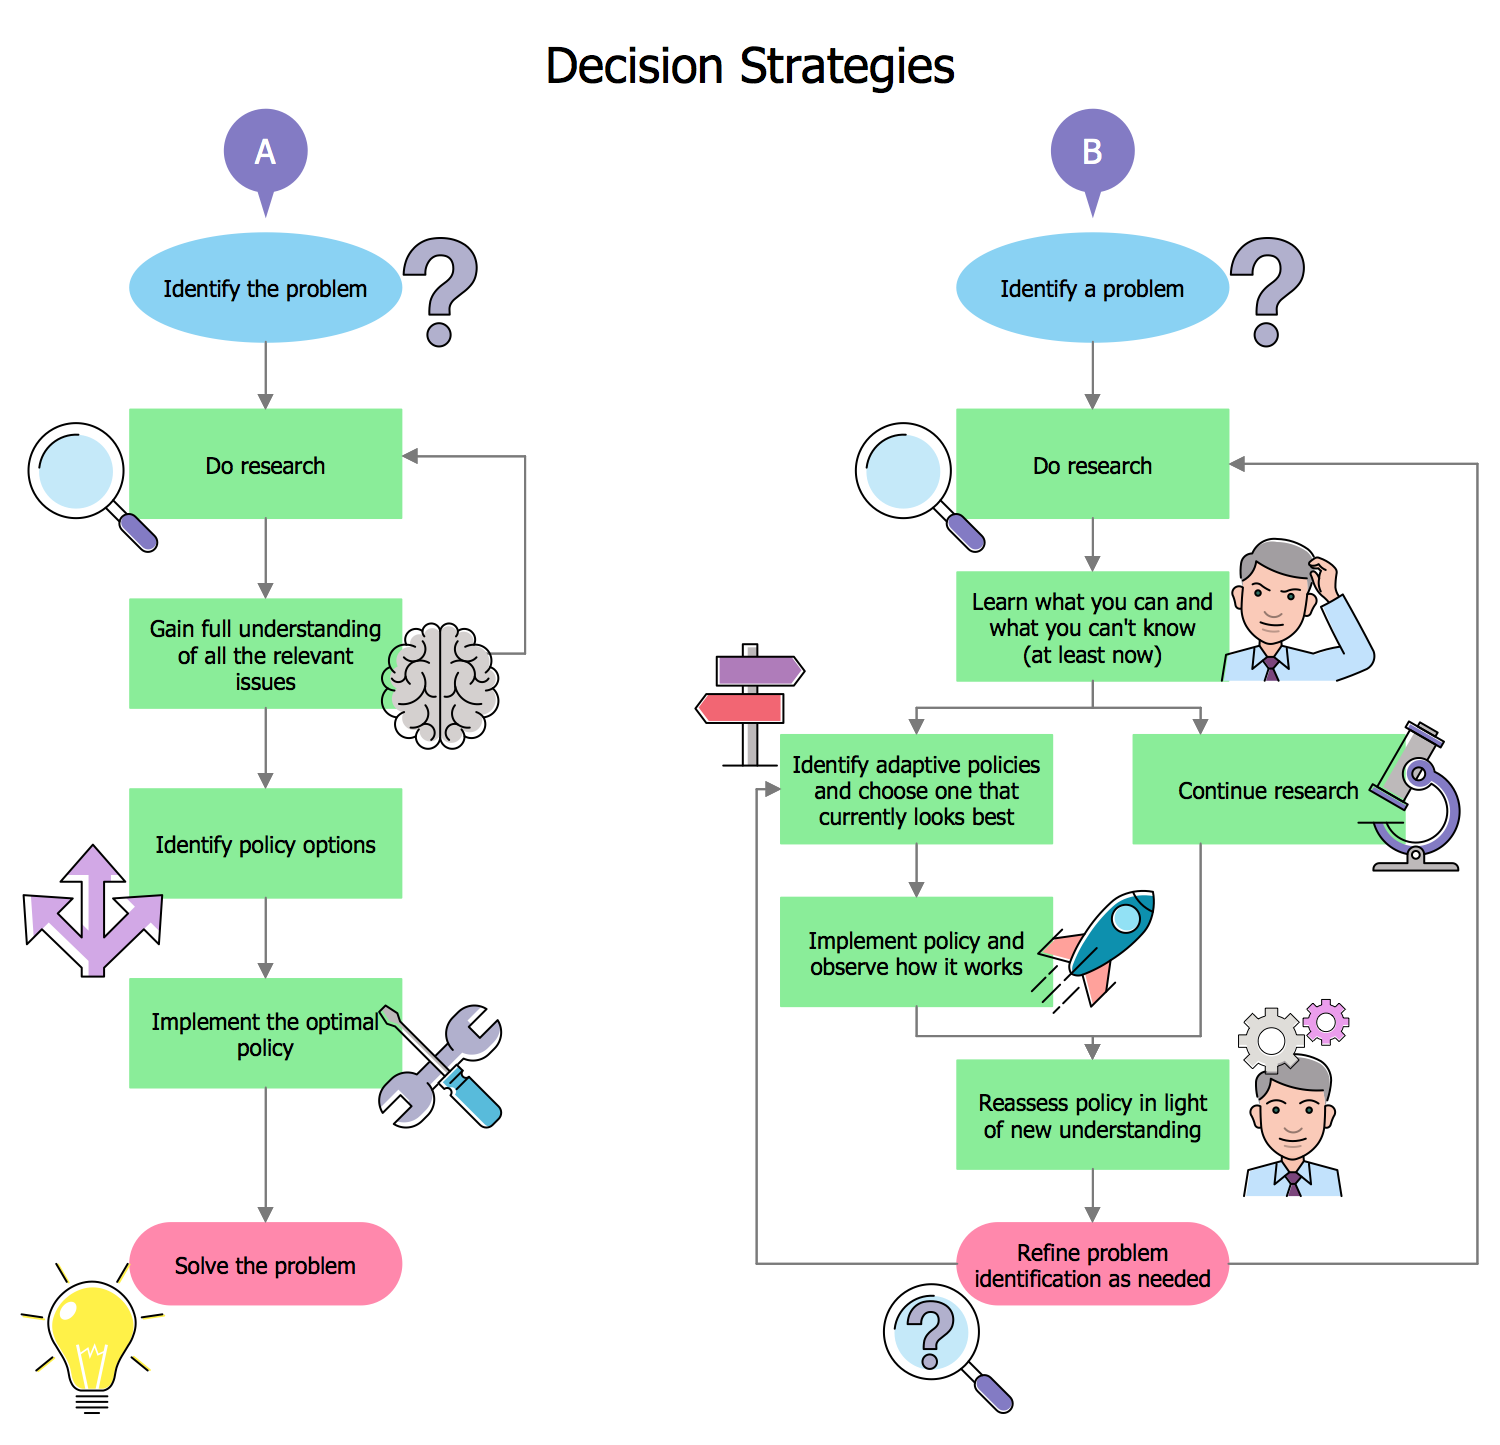
This diagram sample demonstrates two popular strategies for decision making and solving the problems. The strategy A is a decision-making strategy in which the relevant issues and problems cannot be solved until all key uncertainties are resolved by means of the researches. You can observe that strategy A starts with the identification of a problem, then the researches leading to the understanding of relevant issues are realized, the identification the policy options and implementation the optimal policy result in that the existing problem is solved. As for the strategy B, it is an iterative and adaptive decision strategy, where vice versa the action is taken ahead of resolving the key uncertainties, it also starts with the problem's identification, then are made researches that help to identify what you can and what you cannot know, after that you need to identify adaptive policies and choose the best one. Researches proceed and adaptive policy can be revised to receive the new evidence and new understanding, in result you can refine the problem identification as needed.
Example 6: Decision Tree
This diagram was created in ConceptDraw DIAGRAM using the composition of libraries from the Decision Making solution. An experienced user spent 5 minutes creating this sample.
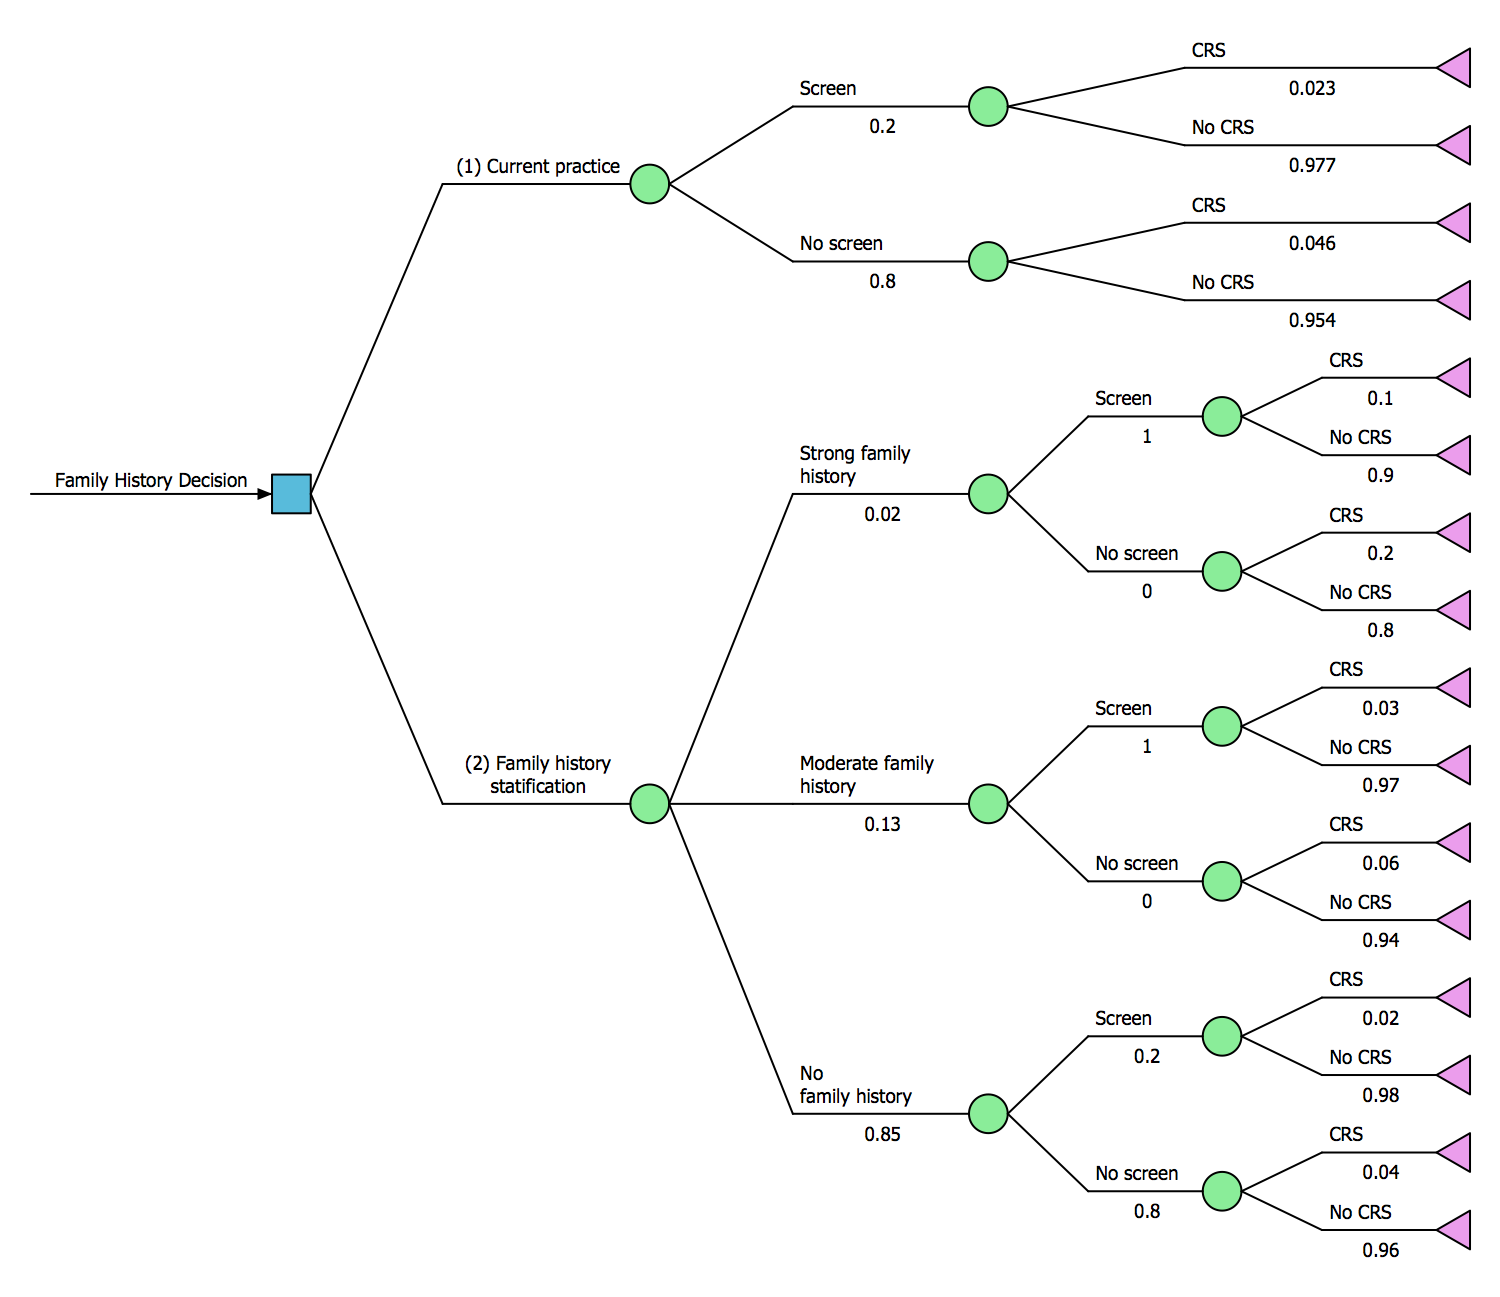
This sample diagram demonstrates a Decision tree called to compare the colorectal screening current practice with a strategy of targeted family history. The form of Decision tree chosen for this diagram is one of the best visual ways to display the algorithms. Here, you can observe the family history decision tree designed in a form of a tree-like graph, which depicts 16 potential outcomes and probabilities. This family history decision tree is a powerful decision support tool, which helps to model the set of decisions and also their possible consequences. The decision trees often can include the chance event outcomes, resource costs, utility, they are actively used in decision analysis, operations research, machine learning, statistics and data mining, for identification the strategy most likely to achieve required goal. When designing a Decision tree in ConceptDraw DIAGRAM diagramming and vector drawing software, you are free to choose - organize it horizontally or vertically, as you like.
Example 7: Decision Tree Flowchart
This diagram was created in ConceptDraw DIAGRAM using the composition of libraries from the Decision Making solution. An experienced user spent 10 minutes creating this sample.
This diagram sample is an example of Decision tree flowchart constructed with the help of ready-made flow chart symbols from the libraries of ConceptDraw's Decision Making solution. The Decision tree flowchart consists of the internal nodes, each of which is a test on some attribute and respectively each flowchart branch is the outcome of the corresponding test, in their turn, the leaf nodes represent the decisions taken after the computing all attributes. The paths from the root to the leaf are the classification rules. Nevertheless, the proposed diagram is not just a Decision tree flowchart, but it is also an example of how multifunctional the ConceptDraw DIAGRAM software can be letting you not just design your diagrams and flowcharts, but provide abilities to depict the chain of mathematical calculations, to include additional graphics, tables with data, comments and callouts, illustrating all this with vivid clipart, images, symbols, signs, or pictograms.
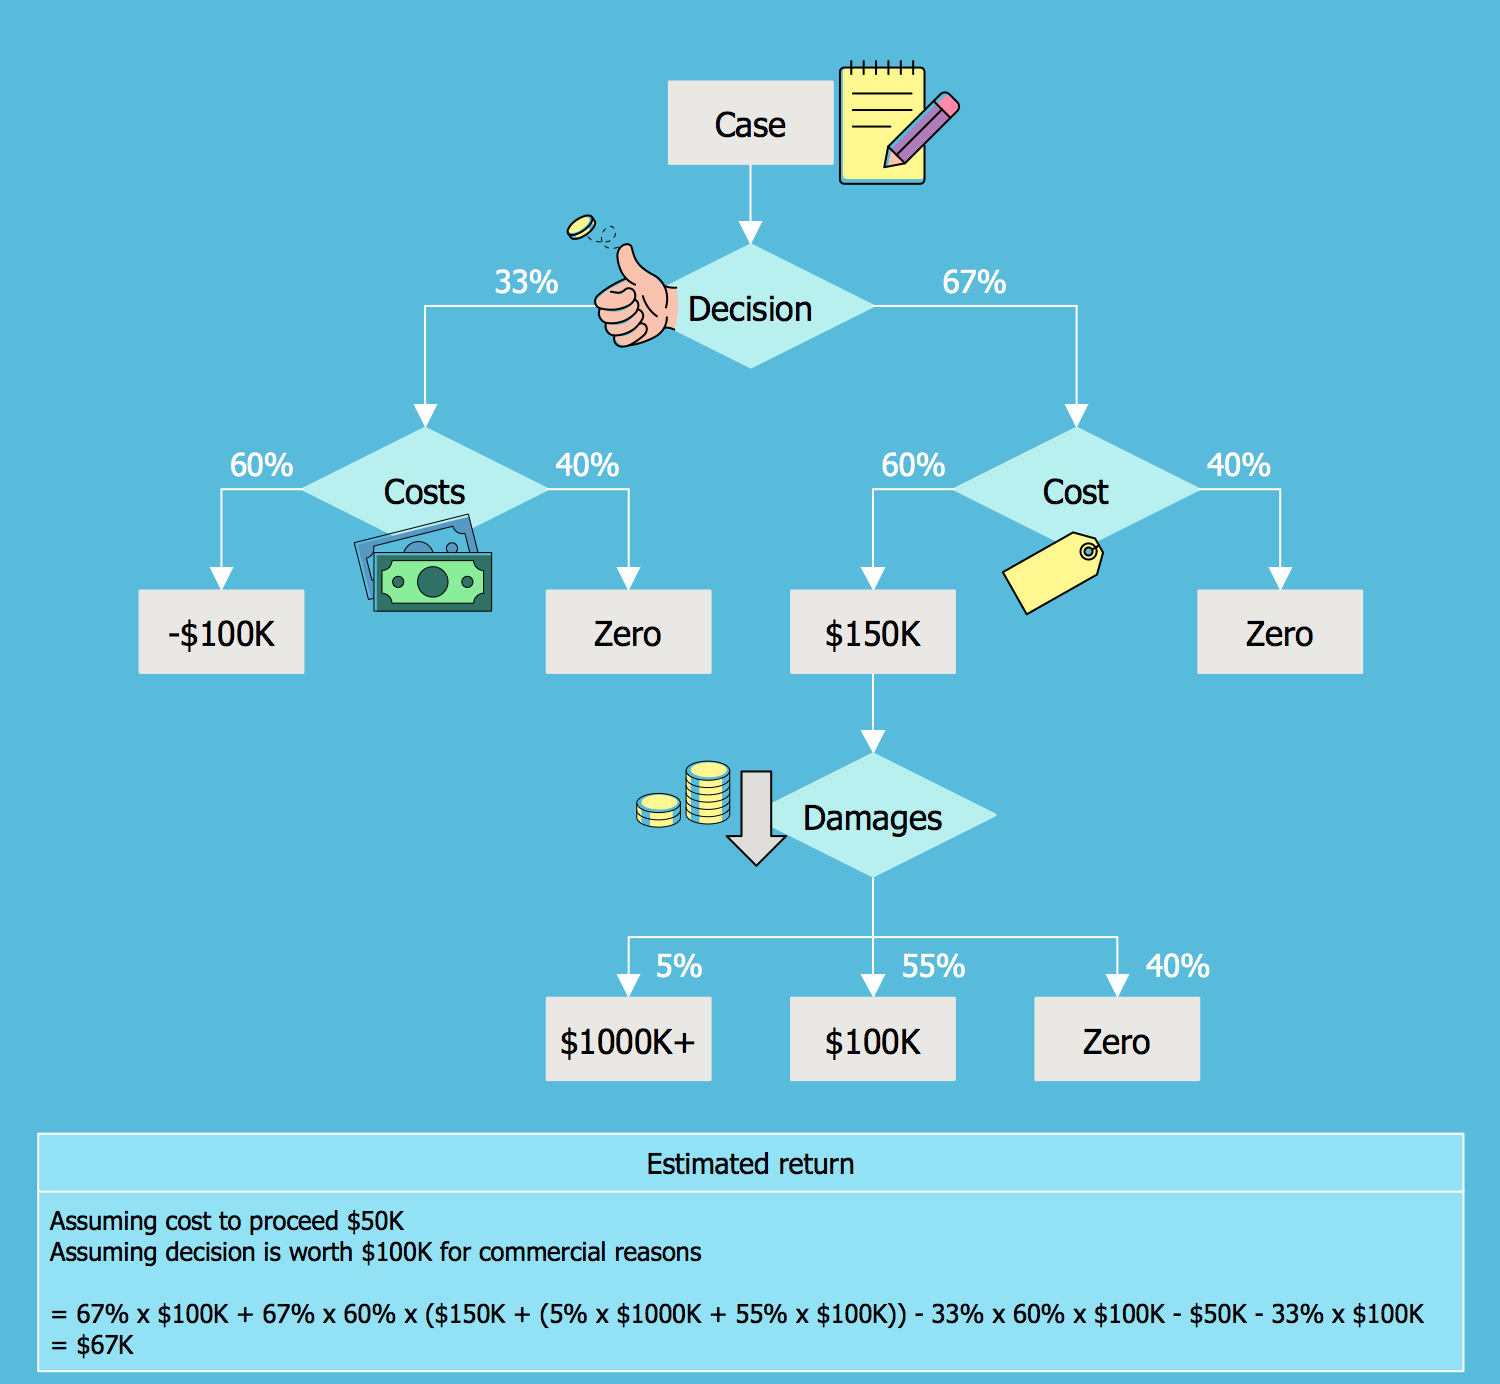
Example 8: Derivative Works Decision Tree
This diagram was created in ConceptDraw DIAGRAM using the composition of libraries from the Decision Making solution. An experienced user spent 10 minutes creating this sample.
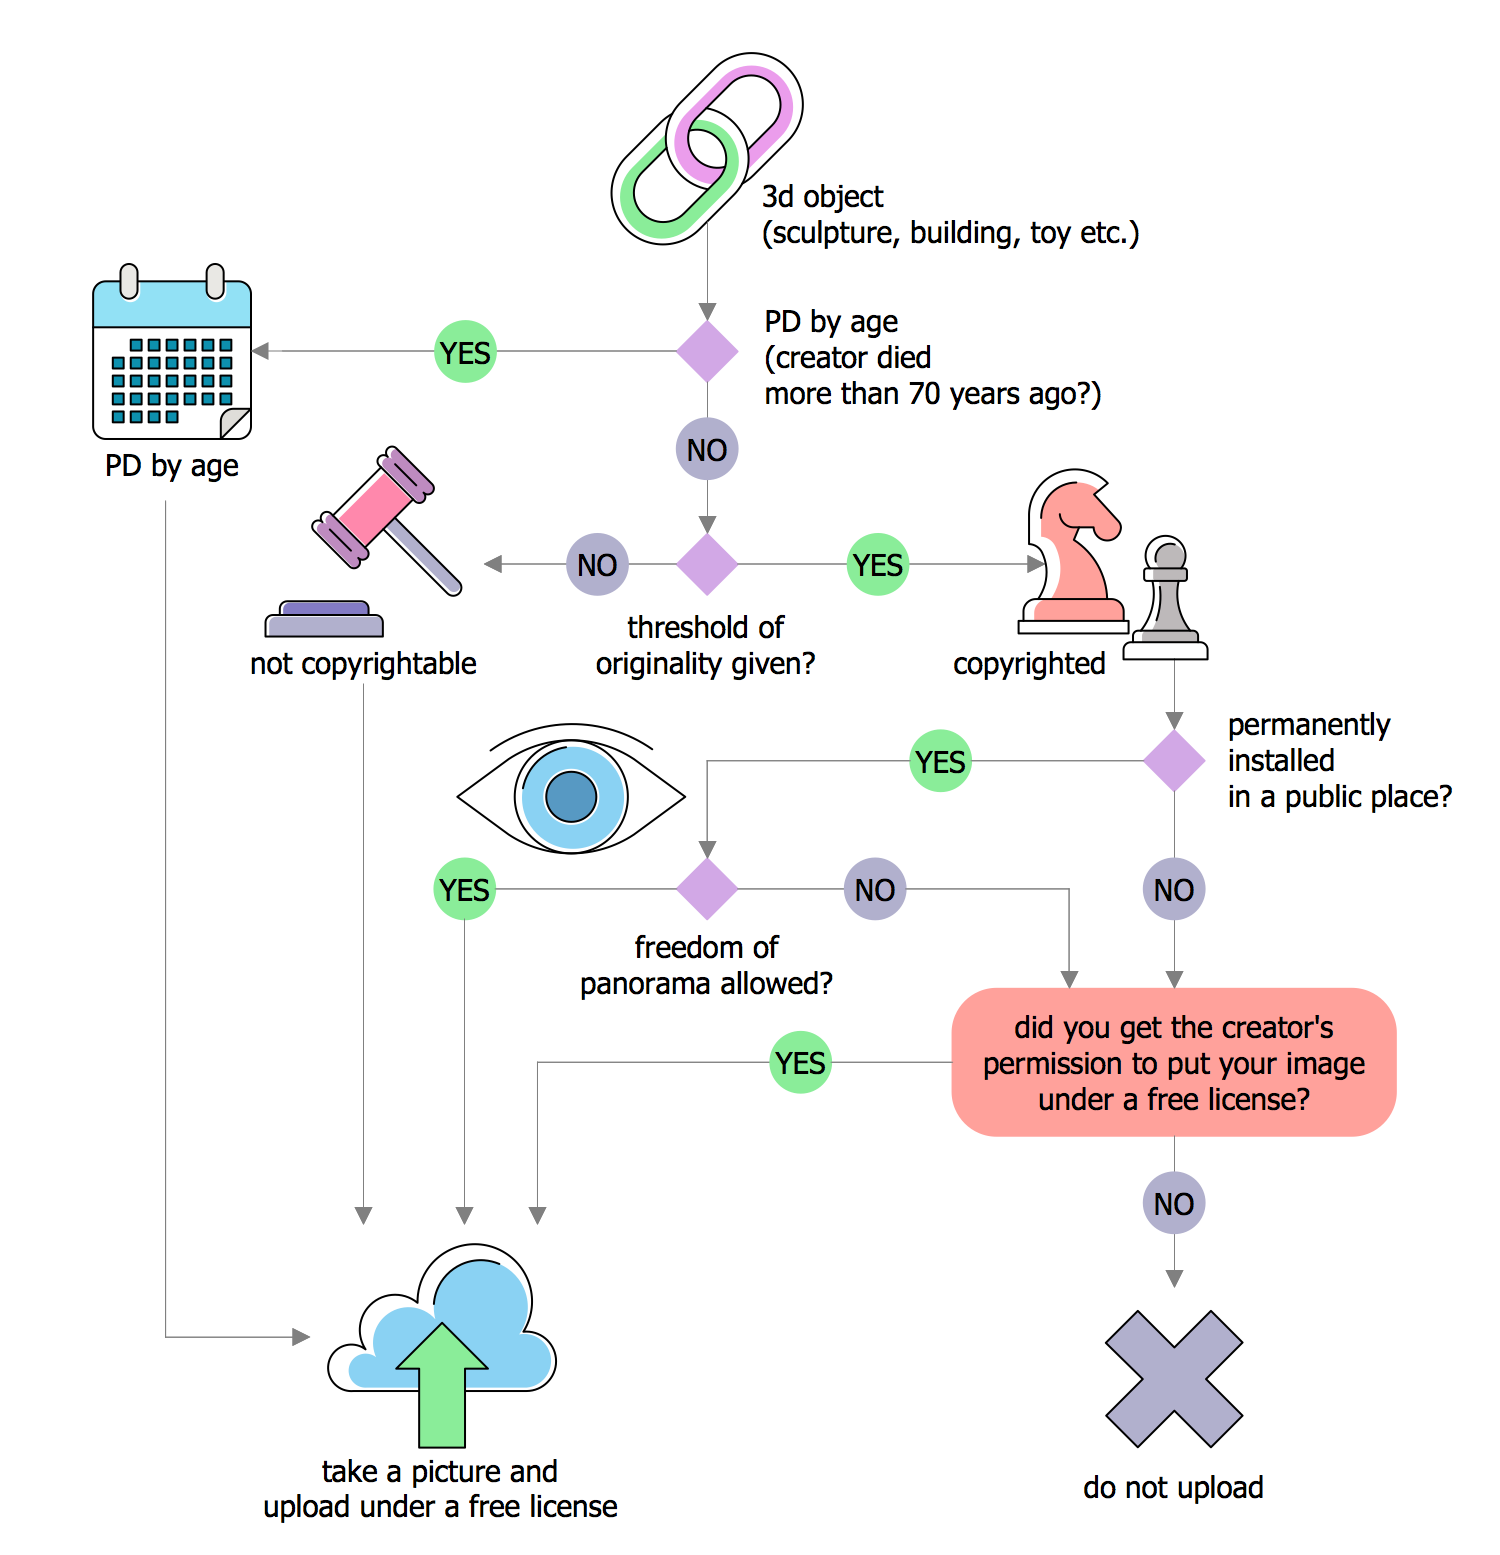
This sample diagram illustrates a Decision tree representing the process of authorization the derivative works on Wikimedia Commons or vice versa refusal in the authorization. Wikimedia Commons is a well-known service, which helps to save server resources and time allowing to store images, records, videos and other multimedia files in a shared free repository, to distribute them, to modify and use from different wikis for any purposes, even commercial, because it contains only those media files, which are not the subject in any copyright restrictions. The process from this diagram is dedicated to the uploading of 3D objects (sculpture, building, toy, etc.), moving from the top down you need to make choice "yes" or "no" at each stage and then move in a corresponding direction. Basing on this chart, there are several reasons why your image will not be uploaded into Wikimedia Commons under a free license, while in many cases upload will be made successfully.
Example 9: Making Influence Diagram
This diagram was created in ConceptDraw DIAGRAM using the composition of libraries from the Decision Making solution. An experienced user spent 5 minutes creating this sample.
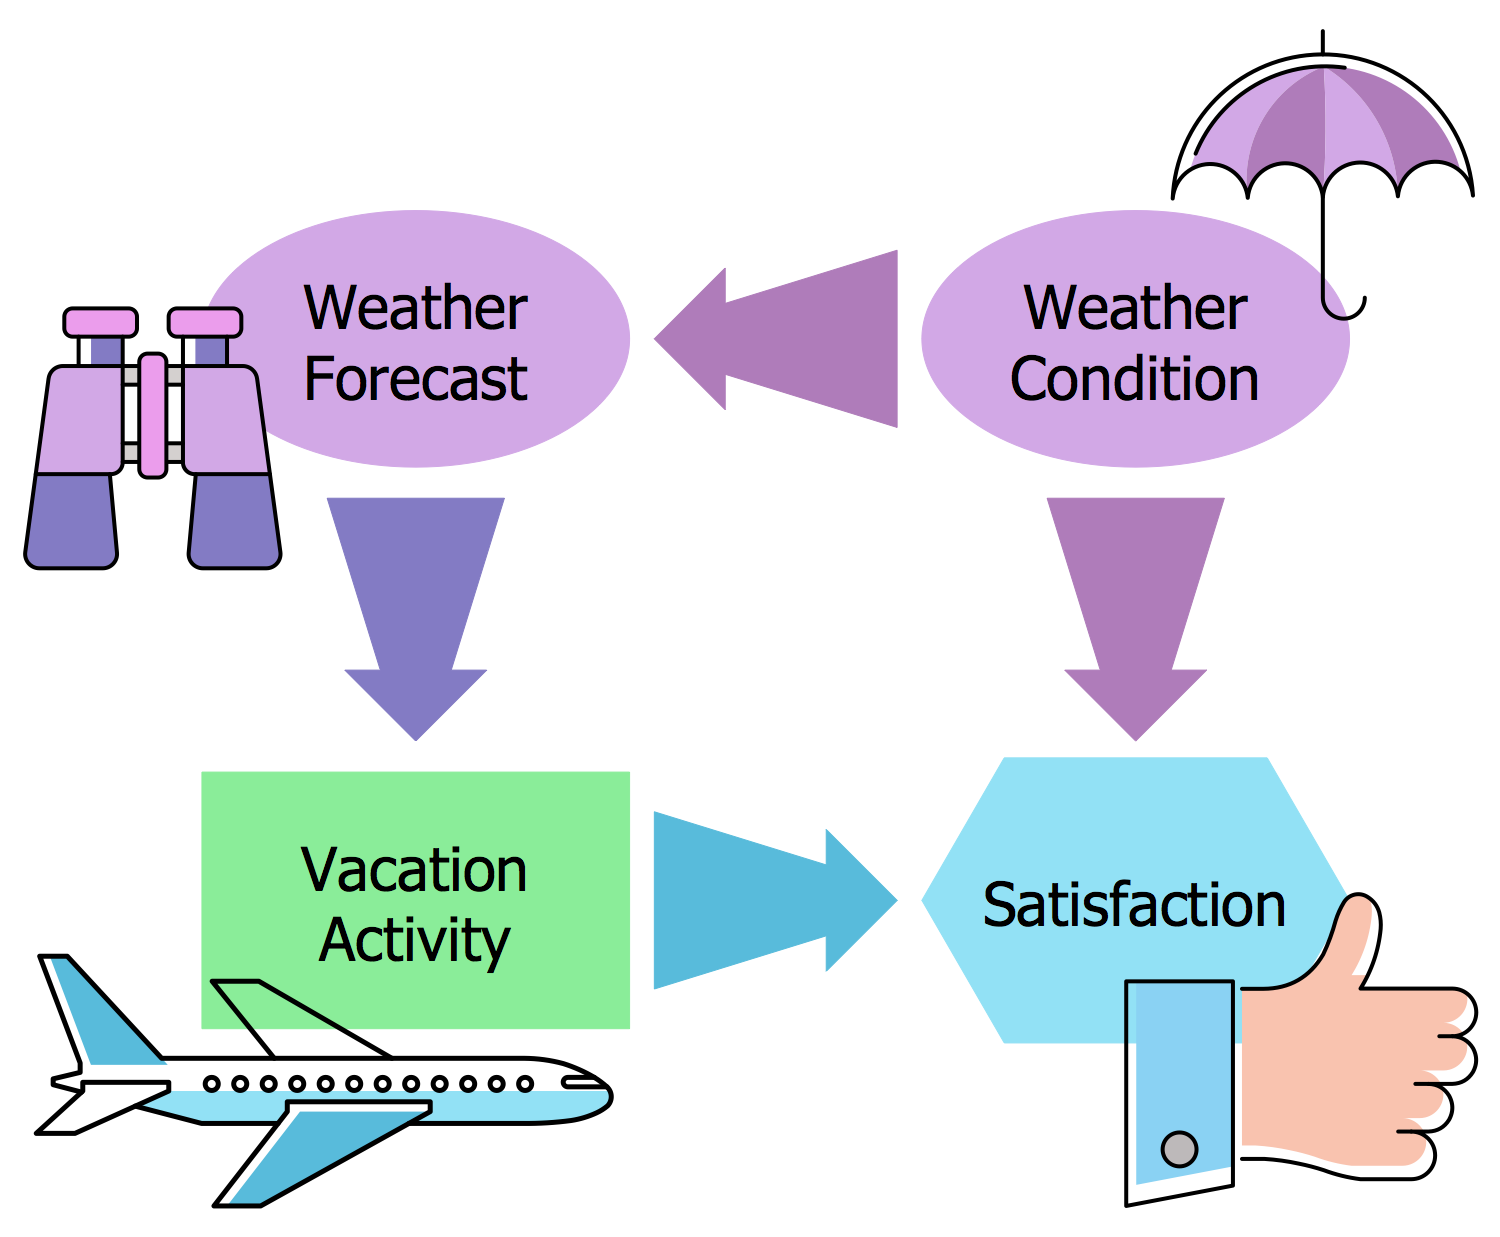
This sample is dedicated to making the Influence diagram (ID) in the ConceptDraw DIAGRAM software. Also, named Relevance diagram, Decision diagram or Decision network, the Influence diagram is a method of effective modeling and solving decision-making problems, which lets one represent the decision situation in a compact graphical view. Developed in the 1970s, the Influence diagram is nowadays quite popular with decision analysts and decision-making professionals, because it has a wide range of advantages and is a strong alternative to a decision tree, it is popular in team decision analysis, as well as in game theory as an alternative to the game tree. Turning attention to the represented Influence diagram sample, you can see that it is a simple diagram, only with four components, but however, it is quite illustrative and lets one observe advantages from the use of Influence diagrams in decision making. The use of colorful clipart adds even more clarity and attractiveness to this diagram.
Example 10: Making Subway Fare Card Machine Decision Diagram
This diagram was created in ConceptDraw DIAGRAM using the composition of libraries from the Decision Making solution. An experienced user spent 15 minutes creating this sample.
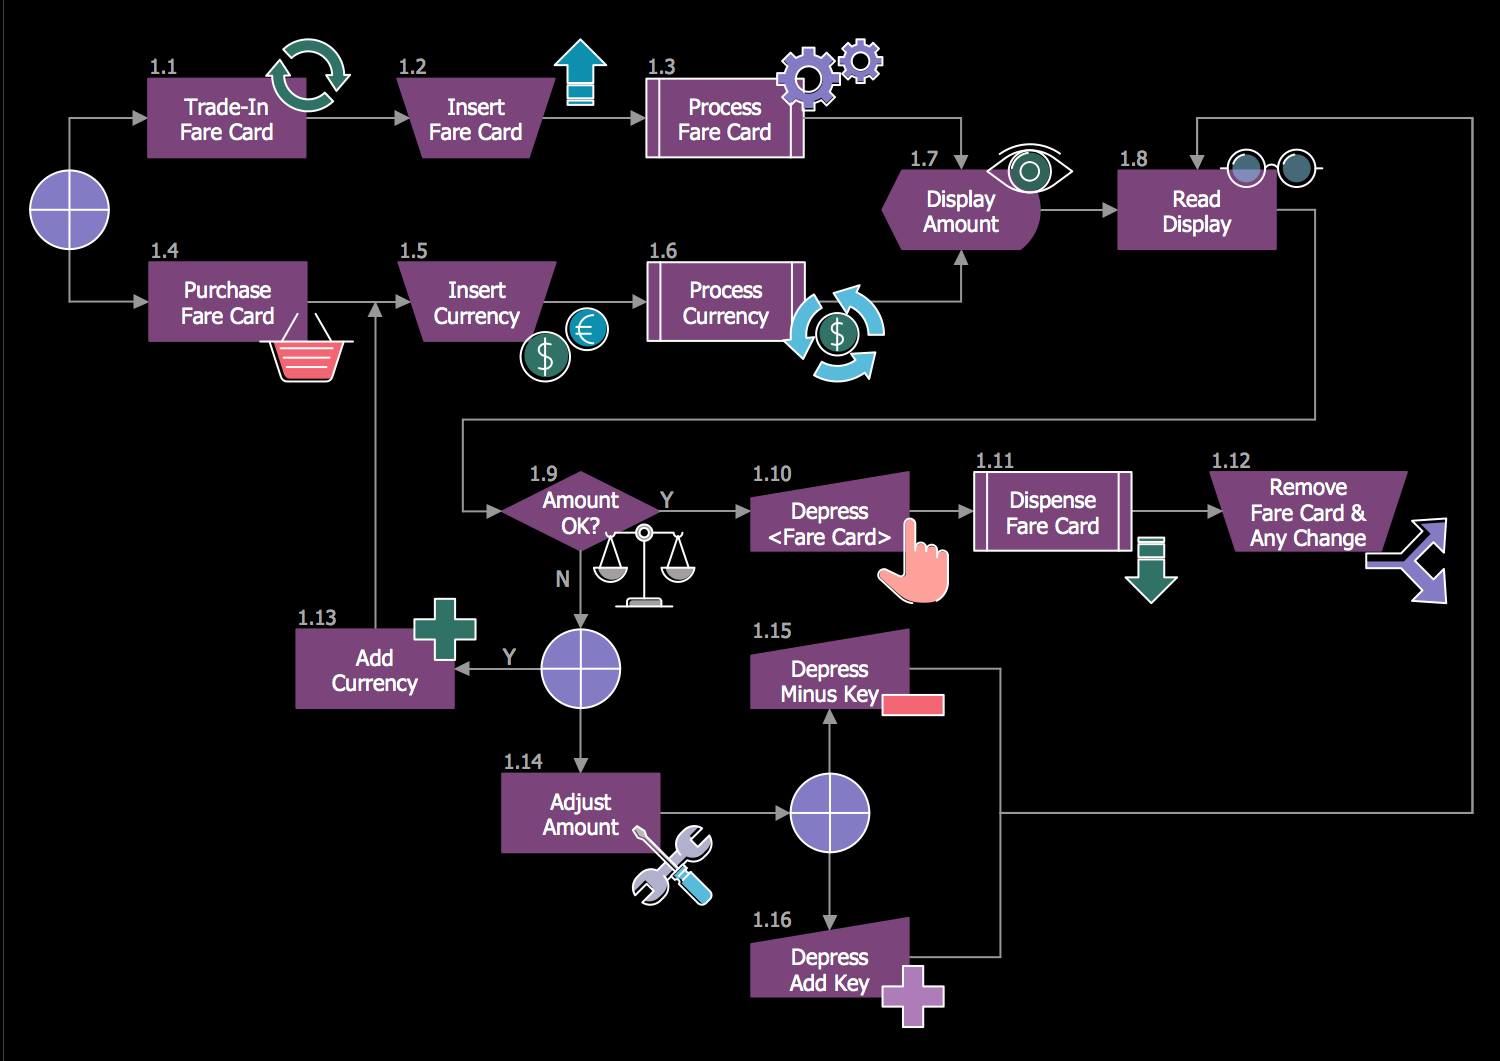
This sample demonstrates a Decision diagram or Action diagram designed for depiction principles of work of the subway fare card machine. The diagrams of this type look like the functional flows but additionally have the decision points in a form of binary questions, where you need to answer "yes" or "no" on the posed question. Due to the clear structure of Decision diagram, the sequence of actions can be easily traced. Besides, you have the best drawing software ConceptDraw DIAGRAM, which supplies you with drawing tools and ready-to-use vector objects that can be simply dragged from the solution's libraries and accurately arranged in your document to achieve the best result - to make a well-structured Decision diagram, convenient for using and reaching correct decisions at your work or other activity. By varying with colors of background, objects, fonts, adding colorful clipart and pictograms, you can create interesting variations of diagrams for all occasions.
Inside
What I Need to Get Started
Both ConceptDraw DIAGRAM diagramming and drawing software and the Decision Making solution can help creating the business planning diagrams you need. The Decision Making solution can be found in the Management area of ConceptDraw STORE application that can be downloaded from this site. Make sure that both ConceptDraw DIAGRAM and ConceptDraw STORE applications are installed on your computer before you get started.
How to install
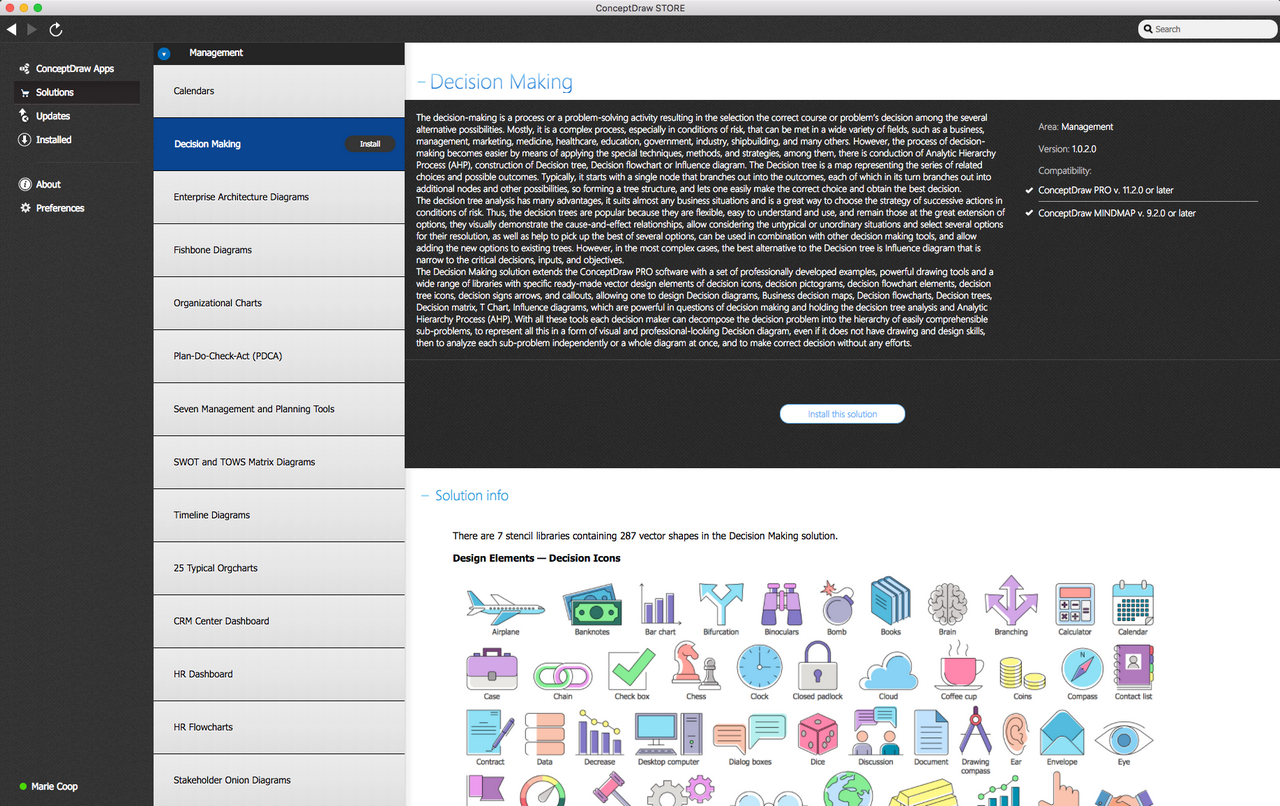
After ConceptDraw STORE and ConceptDraw DIAGRAM are downloaded and installed, you can install the Decision Making solution from the ConceptDraw STORE.
Start using
To make sure that you are doing it all right, use the pre-designed symbols from the stencil libraries from the solution to make your drawings look smart and professional. Also, the pre-made examples from this solution can be used as drafts so your own drawings can be based on them. Using the samples, you can always change their structures, colors and data.
Decision Making
No matter what decision you have to make, deciding to draw business decision maps, diagrams, flowcharts, matrices and infographics you can always use the ConceptDraw DIAGRAM software with the Decision Making solution.
Decision-making is known to be the process of identifying as well as choosing the alternatives which may be based on the preferences, beliefs and values of those who make the decisions.
BDM is an abbreviation for the business decision mapping. It is a technique that is widely used for making decisions. Differing from informal decision making by providing a semi-formal framework, structured and by using visual language, BDM is known to be similar to the typical or natural way of making decisions.
Business decision mapping is focused on the creation of a decision map. Such decision map is simply a diagram that brings together all the fundamental elements of some decision in one organized structure. Its functions may be also brought together as a focus of collaboration.
The business decision mapping addresses problems that can afflict some particular business decision-making process (including anxiety, stress, time pressure, inefficiency and lost thinking). BDM can be used by the decision-makers in order to avoid holding a large amount of information in their heads. In this way, the decision-maker may be able to make a complete and transparent analysis, generating a record of the thinking behind the final decision.

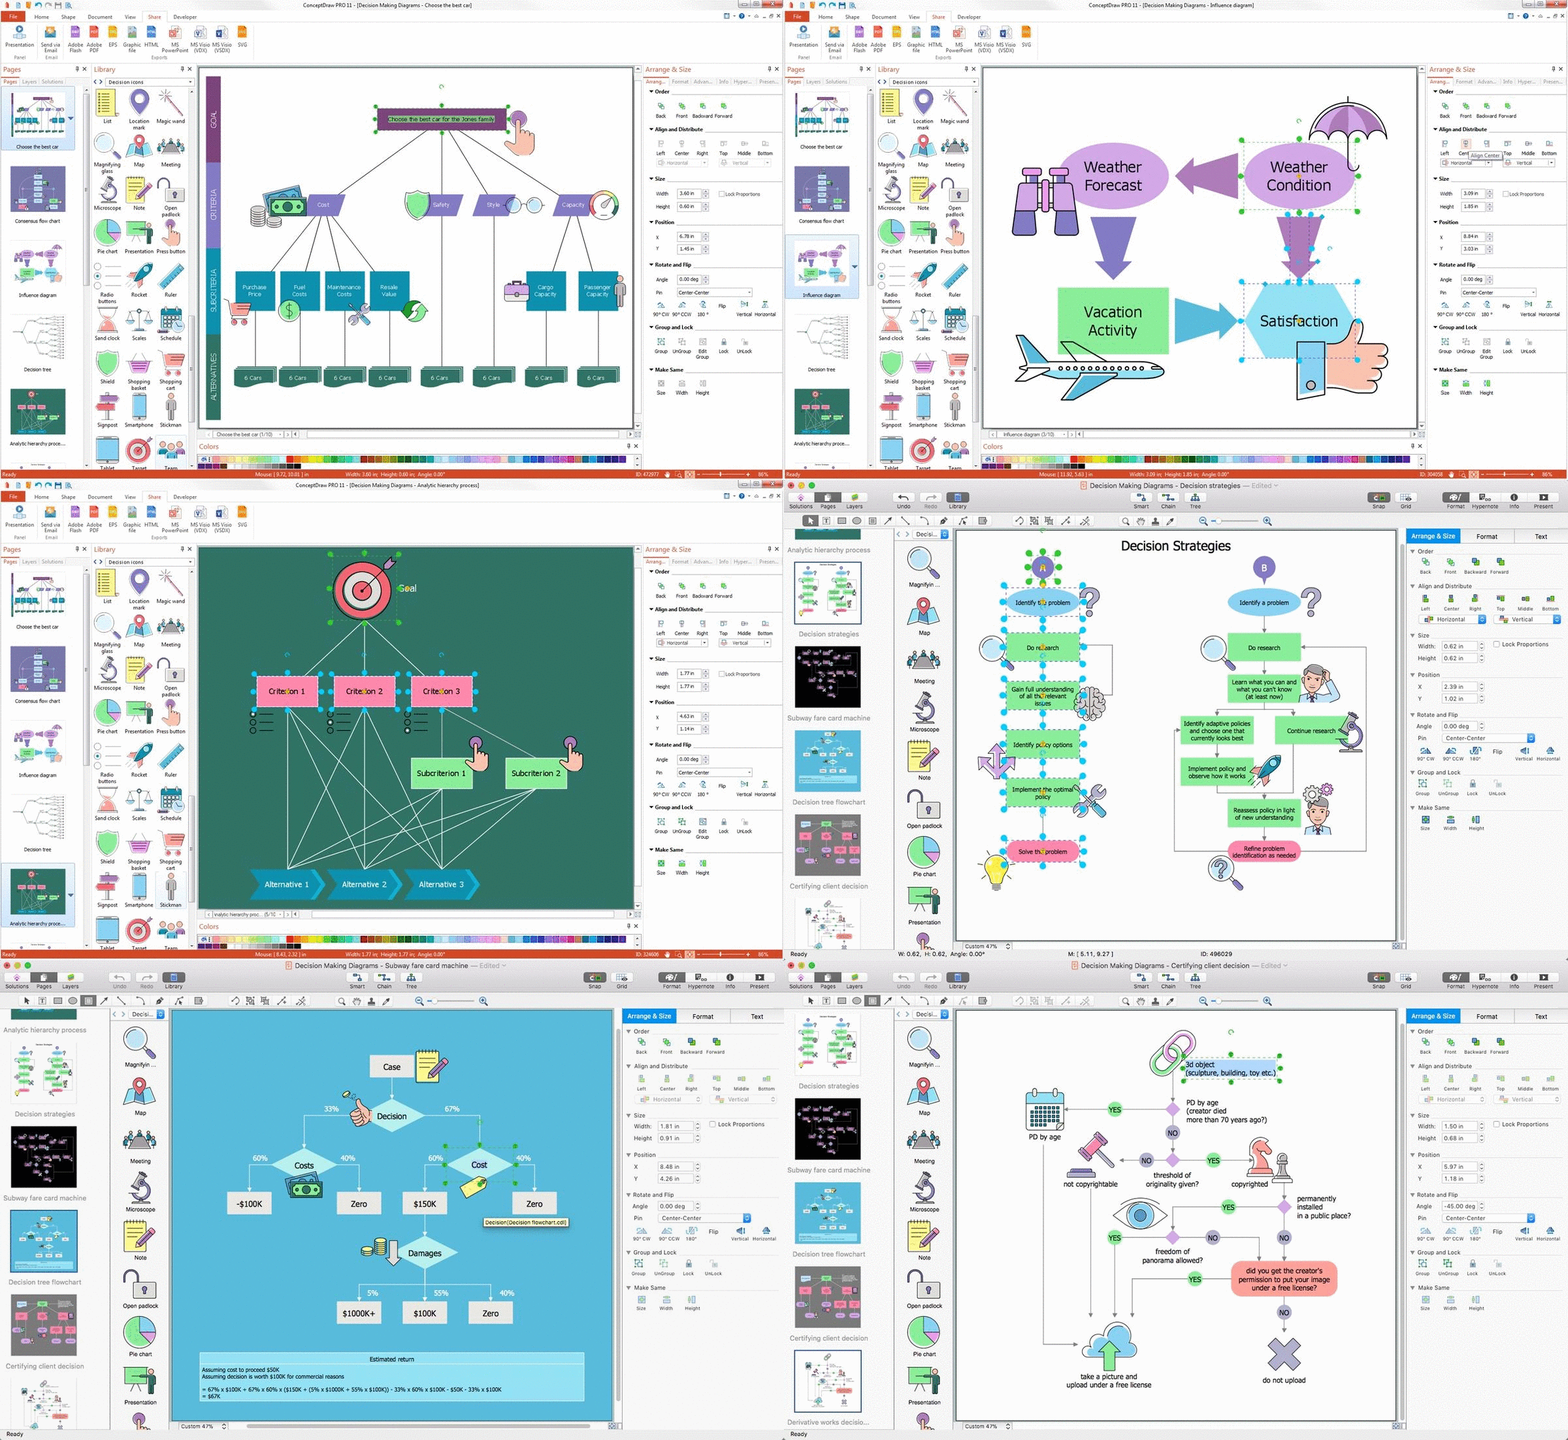
Pic.1. Decision FlowChart
There are a few types of decision making diagrams. They include:
- Decision flowchart
- Business decision map
- Decision tree
- Decision matrix
- Decision table
- Decisional balance sheet
- T-Chart
- Influence diagram
- Management diagram
- and Multivoting matrix (also known as “Multi voting matrix” or “Multi-voting matrix”)
The Decision Making solution extends the ConceptDraw DIAGRAM software as a great business decision mapping tool including:
- 7 vector stencils libraries with the pre-designed elements that can be used for the fast construction of the needed business decision maps, diagrams, flowcharts, matrices and infographics, such as:
- Decision flowcharts (Decision flow charts)
- Decision trees
- Decision diagrams
- Decision pictograms
- Decision arrows
- Decision callouts
- Decision charts
- Decision maps
- Decision tables
- Decision signs
- Diagram examples and pre-made templates that all can be used for quick business decision mapping,
- Learning documents and media for studying of best practices in diagramming and decision making infographic design.
The affinity diagram is known for organizing a lot of ideas into their natural relationships. In order to create a good-looking affinity diagram, the ConceptDraw DIAGRAM software with the Decision Making solution can be used.
Also, any needed decisional balance sheet (also known as a decision balance sheet) may be created within only a few minutes as long as the pre-made examples from the Decision Making solution are used. Being a tabular method that is widely used for representing both pros and cons of different choices, a decision balance sheet may be used for helping someone to decide what exactly needs to be done in the certain circumstances.
The decision matrices, the relevance diagrams, the decision network diagrams and the T-charts can be always created with the help of the ConceptDraw DIAGRAM software with the Decision Making solution. Going into more details about the mentioned drawings, we may say that a decision matrix may be described simply as a particular list of values in columns and rows. It allows the analysts to identify, rate and analyze the performance of relationships between different sets of values. All the Elements of a decision matrix illustrate the decisions that are based on some particular decision criteria.
The decision matrix can be useful for looking at many decision factors trying to assess each of their relative significance. Being used for describing a multi-criteria decision analysis problem, a decision matrix can be explained as a drawing where there are M alternative options, each of which needs to be assessed on N criteria. Thus, there are M columns and N rows altogether (N × M elements). Each of the elements of such drawing is either a single grade or a single numerical value. It represents the performance of some “I” alternative on a “J” criterion.
Another data representation that can be made with the ConceptDraw DIAGRAM application and the Decision Making solution is an influence diagram (ID). The ID can be also called as a relevance diagram. Other names for it are decision network, decision diagram, etc. It is a compact mathematical and graphical representation of a decision situation, in the decision-making problems can be solved once they are modeled.
Influence diagram was first developed in the mid-1970s. It was developed by decision analysts with an intuitive semantic. Being easy to understand, an influence diagram is now widely adopted, becoming an alternative to the decision tree. Also, be directly applicable in team decision analysis for a reason for it allowing the incomplete sharing of information among all the team members involved in a project. Thus, such information can be modeled and solved.

Pic.2. Decision Making solution in the ConceptDraw STORE
The Decision Making solution can be found in the Management area of ConceptDraw Solution Park as well as in the ConceptDraw STORE. Using the already previously made design elements and templates can be helpful for creating the management decision making diagrams. Once ConceptDraw DIAGRAM diagramming and vector drawing software, as well as the Decision Making solution, are downloaded and installed, it becomes possible to draw the decision making illustrations within only a few minutes.