- Electric and Telecom Plans Free
- Fire and Emergency Plans Free
- Floor Plans Free
- Plant Layout Plans Free
- School and Training Plans Free
- Seating Plans Free
- Security and Access Plans Free
- Site Plans Free
- Sport Field Plans Free
- Business Process Diagrams Free
- Business Process Mapping Free
- Classic Business Process Modeling Free
- Cross-Functional Flowcharts Free
- Event-driven Process Chain Diagrams Free
- IDEF Business Process Diagrams Free
- Logistics Flow Charts Free
- Workflow Diagrams Free
- ConceptDraw Dashboard for Facebook Free
- Mind Map Exchange Free
- MindTweet Free
- Note Exchange Free
- Project Exchange Free
- Social Media Response Free
- Active Directory Diagrams Free
- AWS Architecture Diagrams Free
- Azure Architecture Free
- Cisco Network Diagrams Free
- Cisco Networking Free
- Cloud Computing Diagrams Free
- Computer Network Diagrams Free
- Google Cloud Platform Free
- Interactive Voice Response Diagrams Free
- Network Layout Floor Plans Free
- Network Security Diagrams Free
- Rack Diagrams Free
- Telecommunication Network Diagrams Free
- Vehicular Networking Free
- Wireless Networks Free
- Comparison Dashboard Free
- Composition Dashboard Free
- Correlation Dashboard Free
- Frequency Distribution Dashboard Free
- Meter Dashboard Free
- Spatial Dashboard Free
- Status Dashboard Free
- Time Series Dashboard Free
- Basic Circle-Spoke Diagrams Free
- Basic Circular Arrows Diagrams Free
- Basic Venn Diagrams Free
- Block Diagrams Free
- Concept Maps Free
- Family Tree Free
- Flowcharts Free
- Basic Area Charts Free
- Basic Bar Graphs Free
- Basic Divided Bar Diagrams Free
- Basic Histograms Free
- Basic Line Graphs Free
- Basic Picture Graphs Free
- Basic Pie Charts Free
- Basic Scatter Diagrams Free
- Aerospace and Transport Free
- Artwork Free
- Audio, Video, Media Free
- Business and Finance Free
- Computers and Communications Free
- Holiday Free
- Manufacturing and Maintenance Free
- Nature Free
- People Free
- Presentation Clipart Free
- Safety and Security Free
- Analog Electronics Free
- Audio and Video Connectors Free
- Basic Circuit Diagrams Free
- Chemical and Process Engineering Free
- Digital Electronics Free
- Electrical Engineering Free
- Electron Tube Circuits Free
- Electronic Block Diagrams Free
- Fault Tree Analysis Diagrams Free
- GHS Hazard Pictograms Free
- Home Automation and Wiring Free
- Mechanical Engineering Free
- One-line Diagrams Free
- Power Сircuits Free
- Specification and Description Language (SDL) Free
- Telecom and AV Circuits Free
- Transport Hazard Pictograms Free
- Data-driven Infographics Free
- Pictorial Infographics Free
- Spatial Infographics Free
- Typography Infographics Free
- Calendars Free
- Decision Making Free
- Enterprise Architecture Diagrams Free
- Fishbone Diagrams Free
- Organizational Charts Free
- Plan-Do-Check-Act (PDCA) Free
- Seven Management and Planning Tools Free
- SWOT and TOWS Matrix Diagrams Free
- Timeline Diagrams Free
- Australia Map Free
- Continent Maps Free
- Directional Maps Free
- Germany Map Free
- Metro Map Free
- UK Map Free
- USA Maps Free
- Customer Journey Mapping Free
- Marketing Diagrams Free
- Matrices Free
- Pyramid Diagrams Free
- Sales Dashboard Free
- Sales Flowcharts Free
- Target and Circular Diagrams Free
- Cash Flow Reports Free
- Current Activities Reports Free
- Custom Excel Report Free
- Knowledge Reports Free
- MINDMAP Reports Free
- Overview Reports Free
- PM Agile Free
- PM Dashboards Free
- PM Docs Free
- PM Easy Free
- PM Meetings Free
- PM Planning Free
- PM Presentations Free
- PM Response Free
- Resource Usage Reports Free
- Visual Reports Free
- House of Quality Free
- Quality Mind Map Free
- Total Quality Management TQM Diagrams Free
- Value Stream Mapping Free
- Astronomy Free
- Biology Free
- Chemistry Free
- Language Learning Free
- Mathematics Free
- Physics Free
- Piano Sheet Music Free
- Android User Interface Free
- Class Hierarchy Tree Free
- Data Flow Diagrams (DFD) Free
- DOM Tree Free
- Entity-Relationship Diagram (ERD) Free
- EXPRESS-G data Modeling Diagram Free
- IDEF0 Diagrams Free
- iPhone User Interface Free
- Jackson Structured Programming (JSP) Diagrams Free
- macOS User Interface Free
- Object-Role Modeling (ORM) Diagrams Free
- Rapid UML Free
- SYSML Free
- Website Wireframe Free
- Windows 10 User Interface Free
Fishbone Diagrams
The Fishbone Diagram (also called Ishikawa Diagram, Cause and Effect Diagram) got its name from its similarity of its shape to that of a fish skeleton. The Ishikawa Diagram relates to the seven basic tools of measurement, evaluation, control, and improvement of a production processes. Fishbone Diagrams are used to study, to display graphically, and analyze multiplicity of causes that influence the occurrence of a problem being solved and their impact.
The Fishbone Ishikawa Diagram finds its application in various fields of industry and manufacturing. These diagrams are especially popular in strategic planning to identify key success factors. In quality management systems these diagrams are used to highlight the causes that have led to a decline in quality of services or product, as well to improve the competitiveness of services and products.
The methods used to construct Ishikawa diagrams are easy to apply to real practical situations faced by business analysts in a study of problem situations arising in company activities. The illustration starts with a formulation and then the definition of a problem. From this information is built a fish spine - a horizontal line with fish bones that are the groups of factors which impact the occurrence of the problem. The identifying of causes is a very popular brainstorming activity.
The Fishbone Diagrams solution extends ConceptDraw DIAGRAM software with the ability to easily draw the Fishbone Diagrams (Ishikawa Diagrams) to clearly see the cause and effect analysis and also problem solving. The vector graphic diagrams produced using this solution can be used in whitepapers, presentations, datasheets, posters, and published technical material.
-
Install this solution Free -
What I need to get started -
Solution Requirements - This solution requires the following products to be installed:
ConceptDraw DIAGRAM v18 - This solution requires the following products to be installed:
-
Compatibility - Sonoma (14), Sonoma (15)
MS Windows 10, 11 - Sonoma (14), Sonoma (15)
-
Support for this Solution -
Helpdesk
There is 1 library containing 13 vector objects in the Fishbone Diagrams solution.
Design Elements — Fishbone Diagrams

Fishbone Diagrams Examples
There are a few samples that you see on this page which were created in the ConceptDraw DIAGRAM application by using the Fishbone Diagram solution. Some of the solution's capabilities as well as the professional results which you can achieve are all demonstrated here on this page.
All source documents are vector graphic documents which are always available for modifying, reviewing and/or converting to many different formats, such as MS PowerPoint, PDF file, MS Visio, and many other graphic ones from the ConceptDraw Solution Park or ConceptDraw STORE. The Fishbone Diagram solution is available to all ConceptDraw DIAGRAM users to get installed and used while working in the ConceptDraw DIAGRAM diagramming and drawing software.
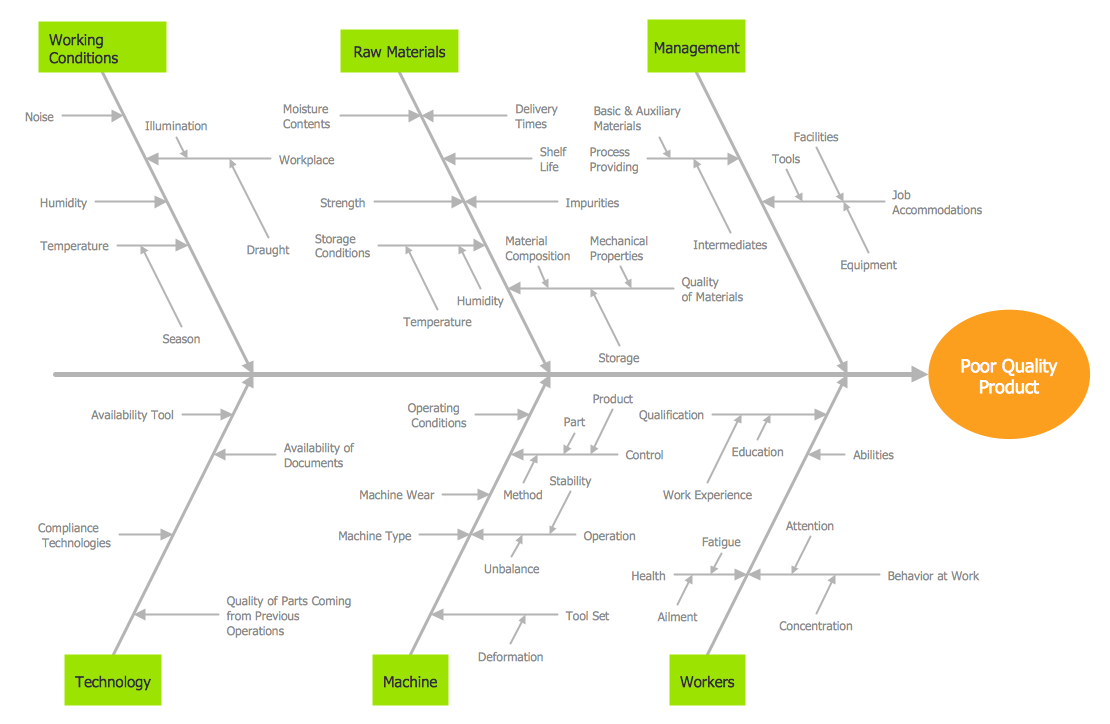
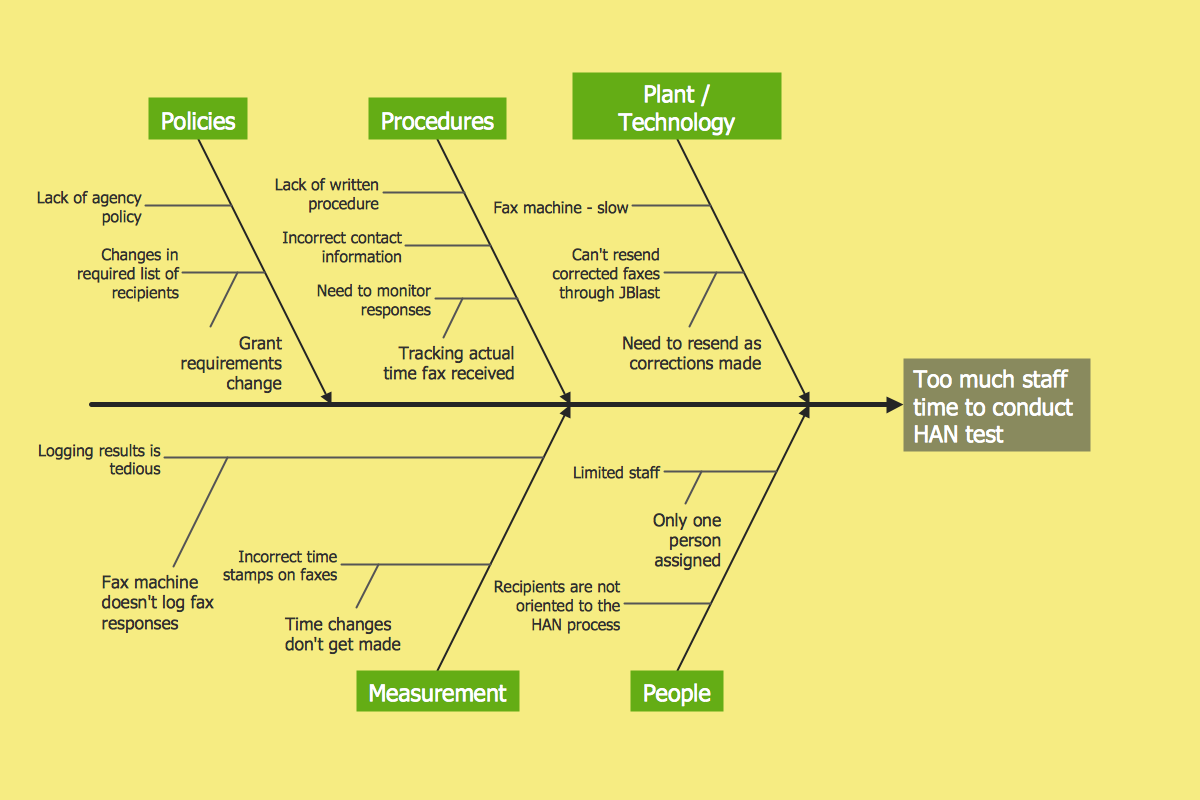
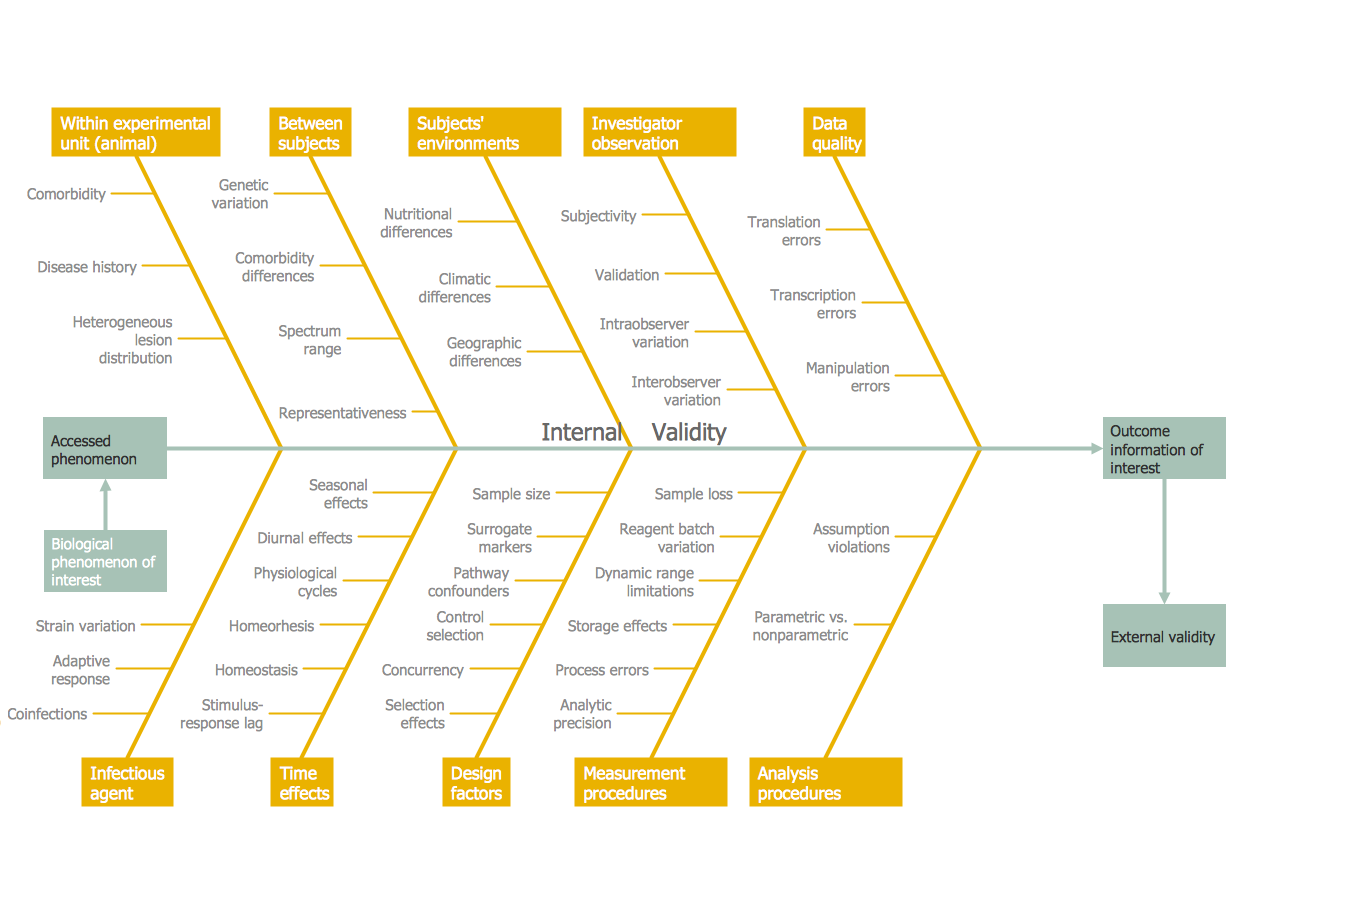
Example 1: Fishbone Diagram — Causes of Low-Quality Output
This diagram was created in ConceptDraw DIAGRAM using the Fishbone Diagrams Library from the Fishbone Diagram Solution. An experienced user spent 30 minutes creating this sample.
This sample diagram using the Fishbone Diagrams Solution shows the most common causes and effects that occur when assembling a cause-and-effect analysis session.
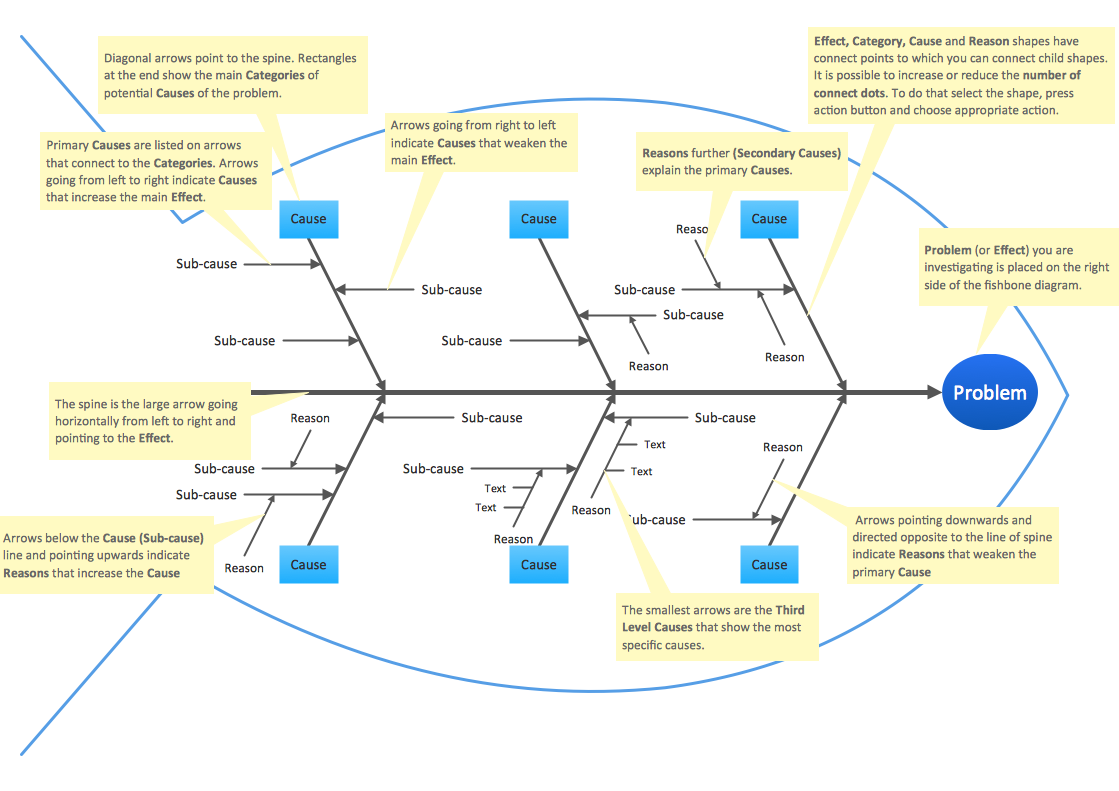
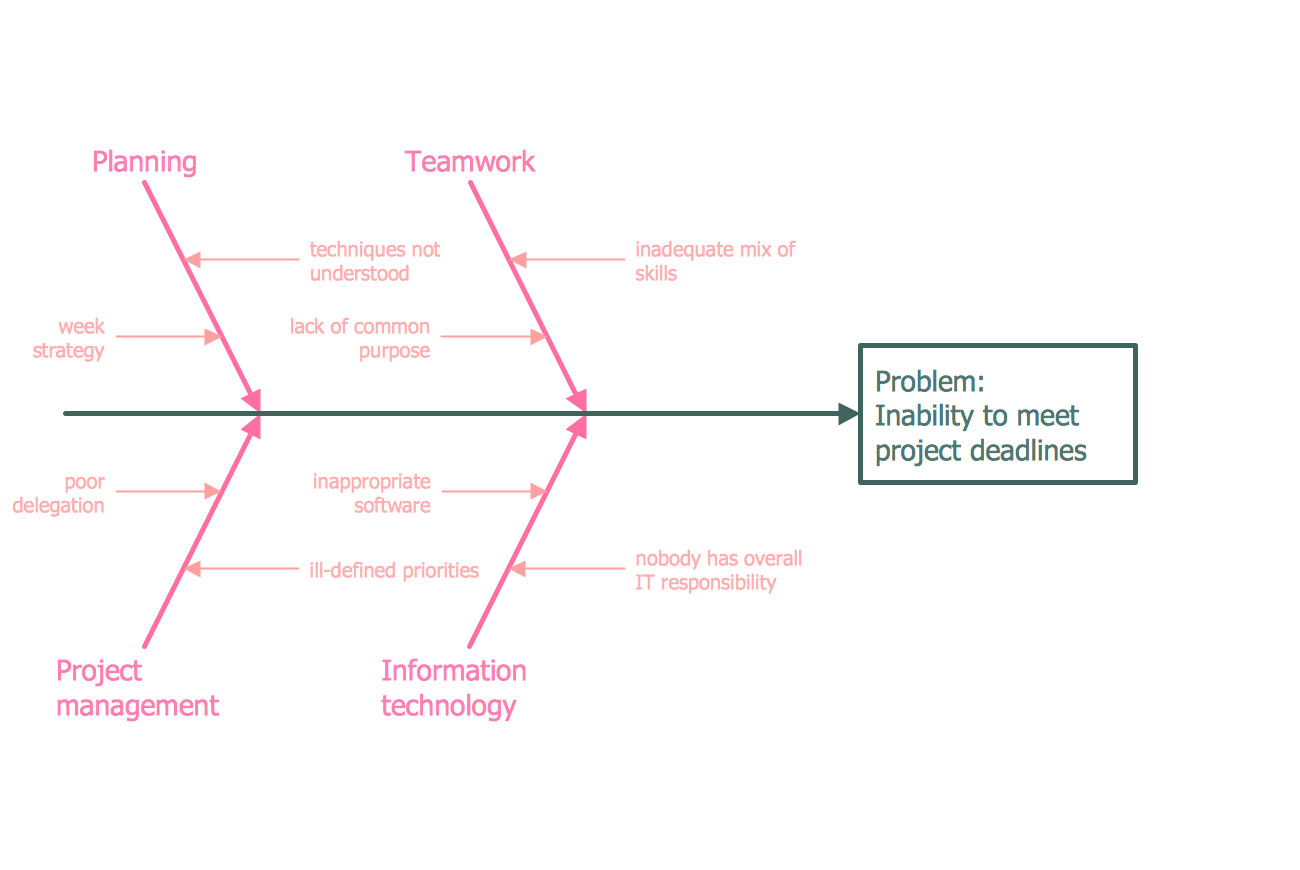
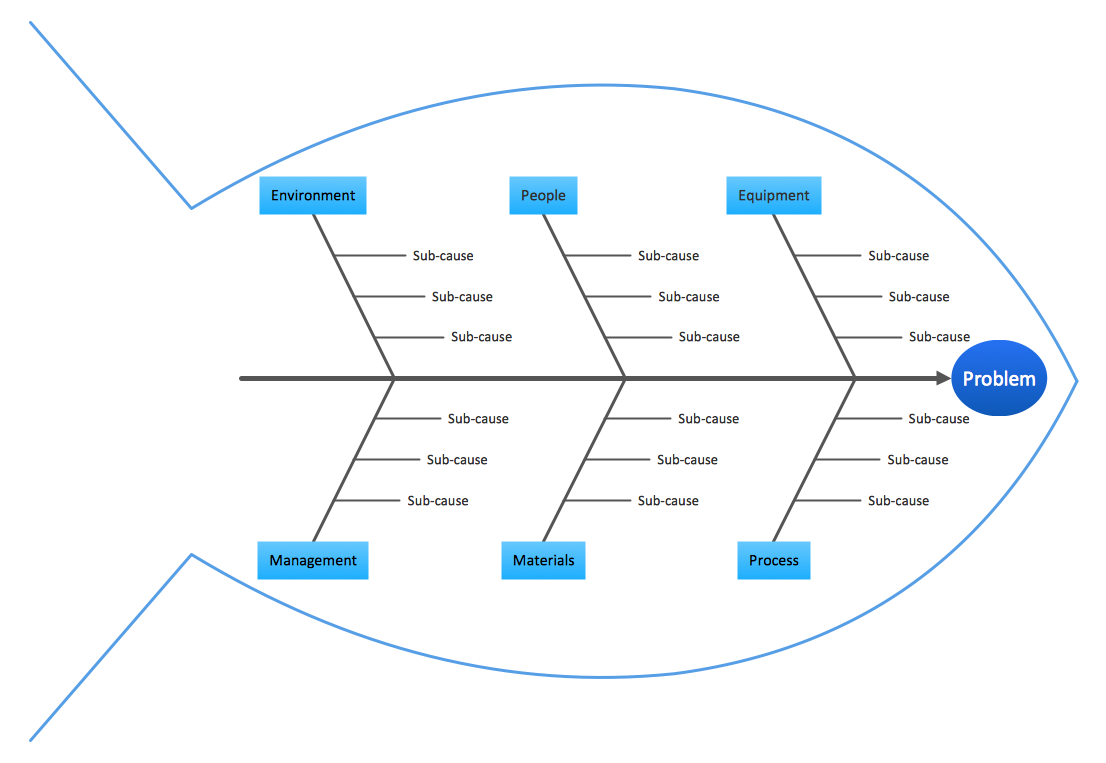
Example 2: Fishbone Diagram — Educational Template
This diagram was created in ConceptDraw DIAGRAM using the Fishbone Diagrams Library from the Fishbone Diagrams Solution. An experienced user spent 30 minutes creating this template.
This template diagram is created using the Fishbone Diagrams Solution. It contains a typical structure you can fill-in to get started with a Fishbone Diagram. There are callout tips on the template so you can get quickly started.
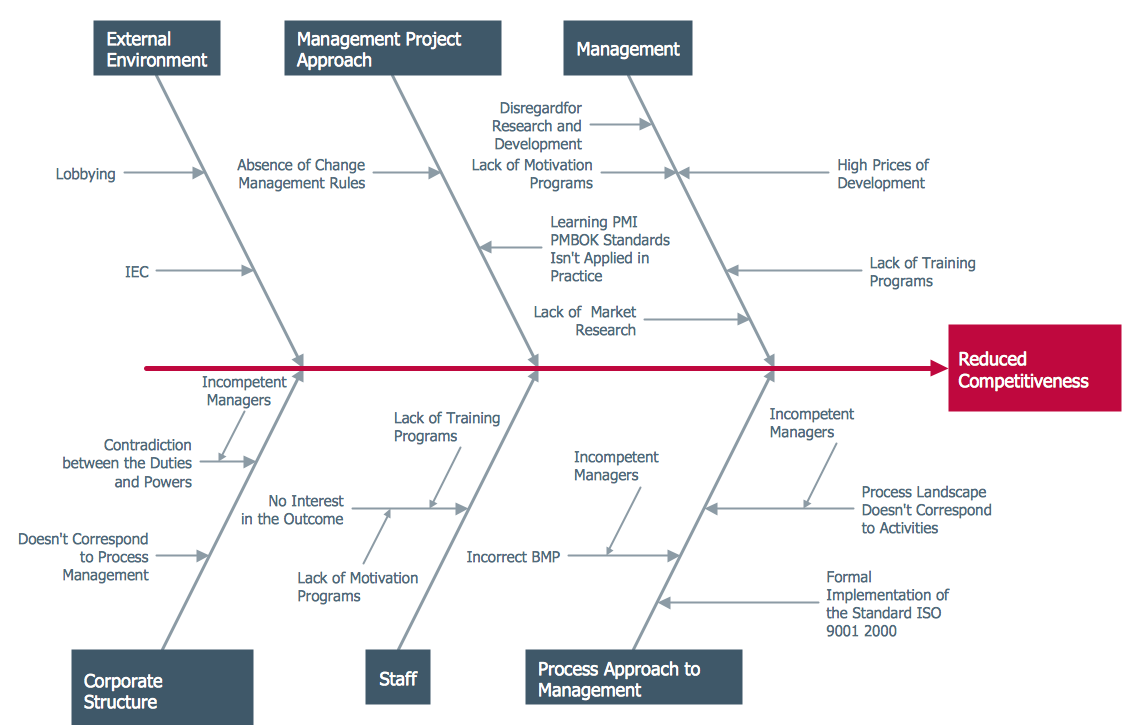
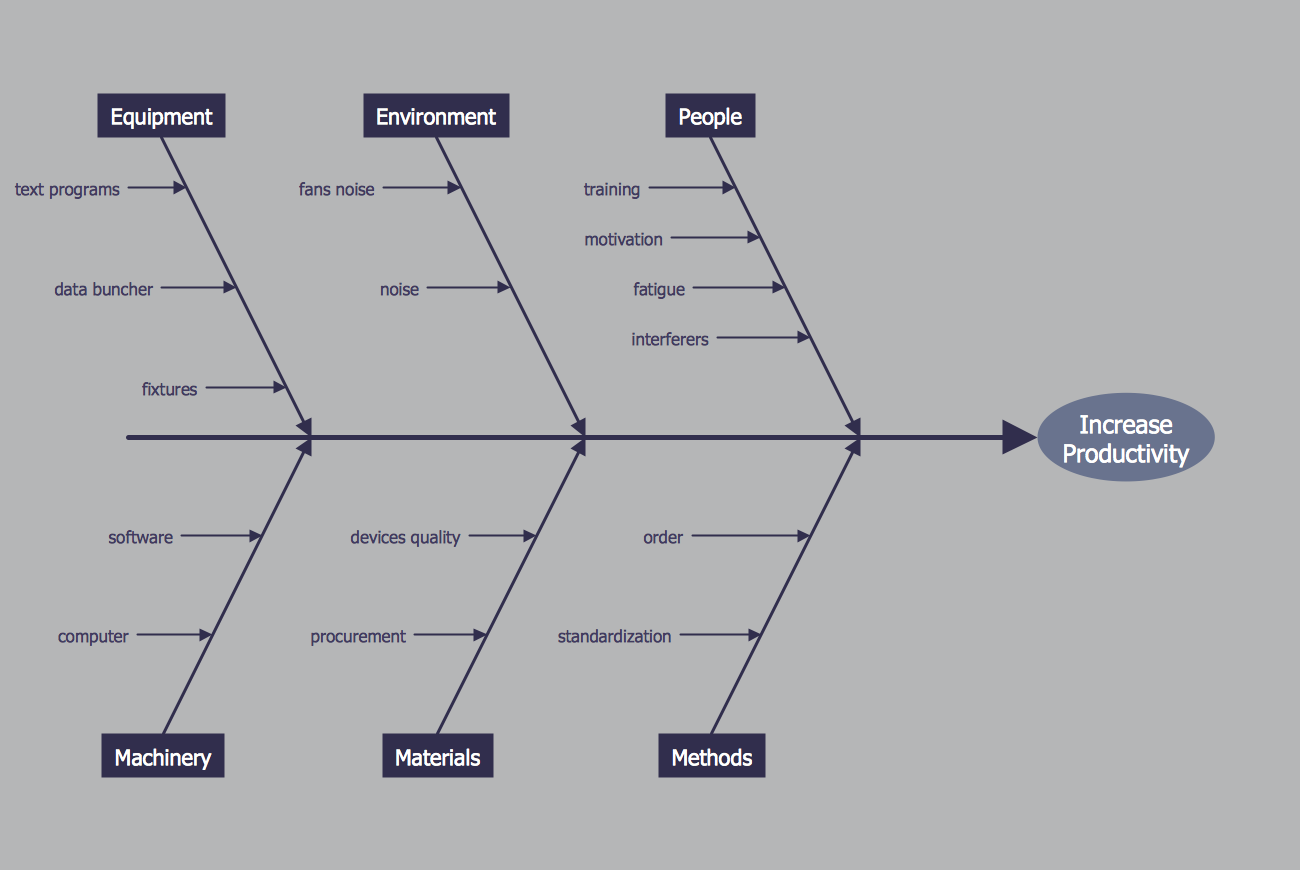
Example 3: Fishbone Diagram — Factors Reducing Competitiveness
This diagram was created in ConceptDraw DIAGRAM using the Fishbone Diagrams Library from the Fishbone Diagrams Solution. An experienced user spent 20 minutes creating this sample.
This sample diagram from the Fishbone Diagrams Solution visualizes the most frequent causes and effects that can occur when developing a business.
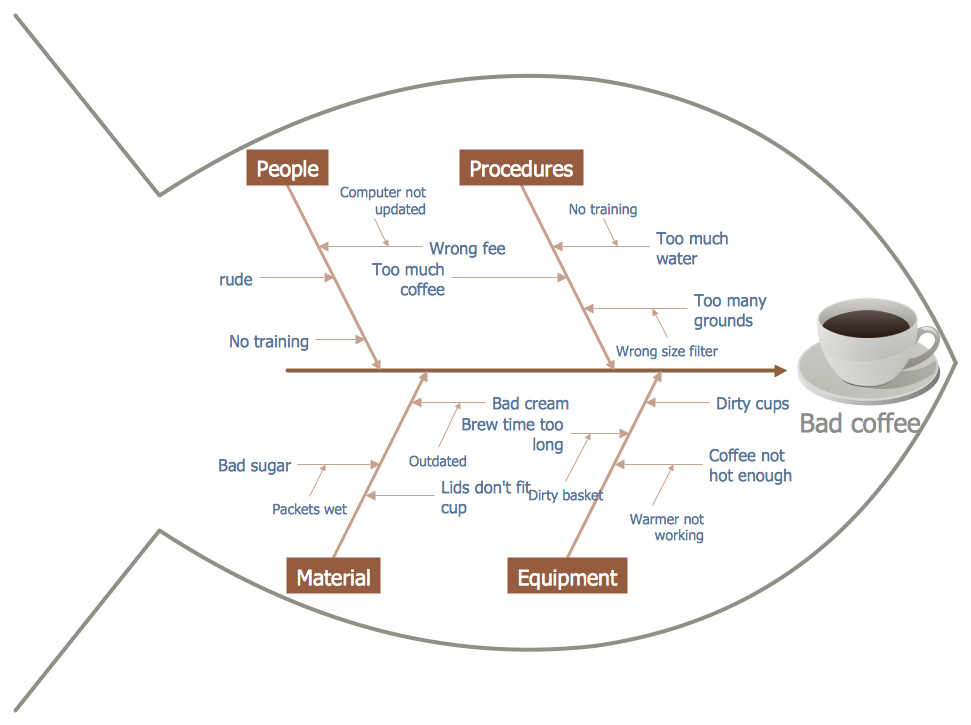
Example 4: Fishbone Diagram — Bad Coffee
This diagram was created in ConceptDraw DIAGRAM using the Fishbone Diagrams Library from the Fishbone Diagrams Solution. An experienced user spent 15 minutes creating this sample.
This sample diagram using the Fishbone Diagram Solution visualizes the potential factors that cause an overall effect, making it possible to solve the problem. It is an excellent idea to use the clipart on the fishbone diagram to make it bright, interesting and attractive.
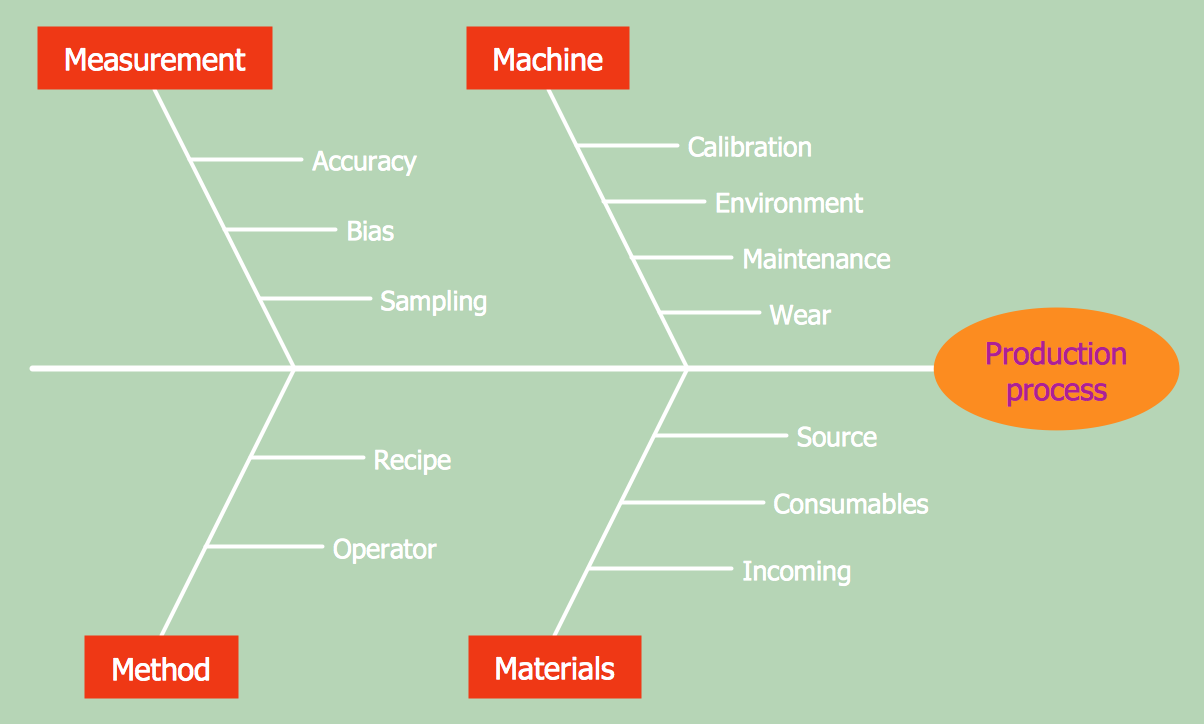
Example 5: Fishbone Diagram — Production Process
This diagram was created in ConceptDraw DIAGRAM using the Fishbone Diagrams Library from the Fishbone Diagrams Solution. An experienced user spent 10 minutes creating this sample.
This sample diagram using the Fishbone Diagram Solution shows factors that are the possible causes of a problem and the relationships among these factors. It’s very useful and convenient to add color accents on the fishbone diagram for a bigger impact.
Inside


What I Need to Get Started
Both ConceptDraw DIAGRAM diagramming and drawing software and the Fishbone Diagrams solution can help creating the business planning diagrams you need. The Fishbone Diagrams solution can be found in the Management area of ConceptDraw STORE application that can be downloaded from this site. Make sure that both ConceptDraw DIAGRAM and ConceptDraw STORE applications are installed on your computer before you get started.
How to install
After ConceptDraw STORE and ConceptDraw DIAGRAM are downloaded and installed, you can install the Fishbone Diagrams solution from the ConceptDraw STORE.

Start using
To make sure that you are doing it all right, use the pre-designed symbols from the stencil libraries from the solution to make your drawings look smart and professional. Also, the pre-made examples from this solution can be used as drafts so your own drawings can be based on them. Using the samples, you can always change their structures, colors and data.

Fishbone Diagrams
A causal model is an abstract concept, that describes the causal mechanisms of a system, by noting certain variables and their influence on each other, in an effort to discover the cause of a certain problem or flaw. This model is presented in diagram form by using a fishbone diagram — also known as a cause and effect diagram, herringbone diagram or Ishikawa diagram, the latter name referring to the inventor of the technique, Kaoru Ishikawa. The fish-themed names are used due to the visual arrangement of the numerous variables, designed to represent the ribs of a skeletal fish, that arrow into a central spine whereupon the main problem is placed where the head would be.
A generic fishbone diagram, identifying key points — created using ConceptDraw DIAGRAM
The primary aim of a fishbone diagram is to identify the root cause of a certain effect, achieved by breaking the causes down into successive levels of detail, in order to assess the level of influence for each one. This makes them popular for use product design and quality control; for systems that have a wide source variables acting upon them, and where it isn't always immediately apparent which variable is negatively affecting the end result. For example, say a product is coming off the line which is of poor quality. Is it the fault of the materials? The line equipment? Perhaps the input of the workers on the line? A fishbone diagram allows you to collect all these causes in terms of their relationship with one another, and narrow down the problem to the root cause.
Causes are commonly grouped into a number of distinct categories. There are other variations to this list, and other causes specific to certain industries, which we will look at later. But this list shows the type of causes and variables that often need to be identified:
- People — anyone who directly influences a process, employees, couriers, customers etc.
- Machines — the equipment required for a task, computers, tooling, transport.
- Materials — resources used in a process, or used to design products.
- Methods — rules and regulations that are attributed to a task, certain policies and procedures.
- Environment — environmental conditions such as location, temperature, time, and even local culture.
As an indication of their usefulness in regards to quality management, fishbone diagrams represent one of the Seven Basic Tools of Quality, a collection of diagram techniques seen as the most helpful in a troubleshooting scenario. The other diagrams in this group include the check sheet, control chart, histogram, Pareto chart, scatter diagram and flow chart — they are known as 'basic' tools due to their relative ease of use people unfamiliar with diagram techniques.
The industry of causation
While certain causes and effects can be found in any line of industry, different forms of business with different end-goals will choose a particular emphasis when identifying possible variables. Manufacturing problems are most likely to arise through machinery or material causation, while service industries can look at pricing and customer interaction aspects. As such, certain industries have their own framework from which to pinpoint variables; this reference guide can then be brainstormed collaboratively and grouped into relevant categories on the fishbone.
Here are some examples of industry specific causation categories:
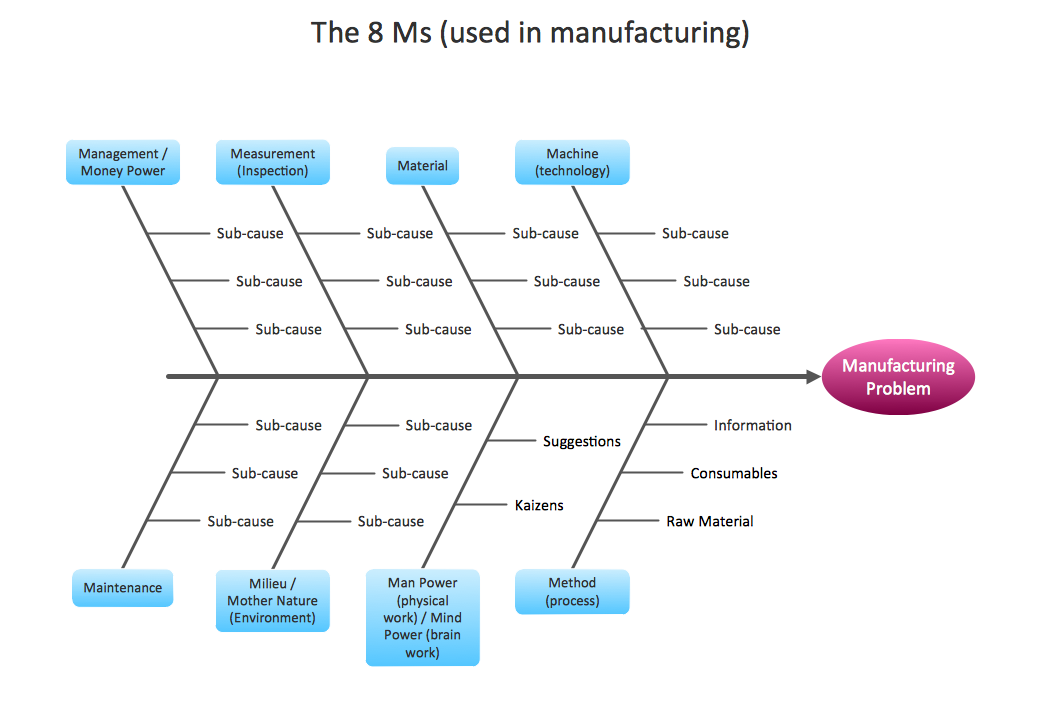
Manufacturing — The 5 Ms
- Machine (equipment and technology)
- Measurement (inspection, data results)
- Material (raw materials, consumables and information)
- Method (steps in design process)
- Man/Mind Power (physical labour or brainpower)
Cause of product issue during manufacture, created using ConceptDraw DIAGRAM
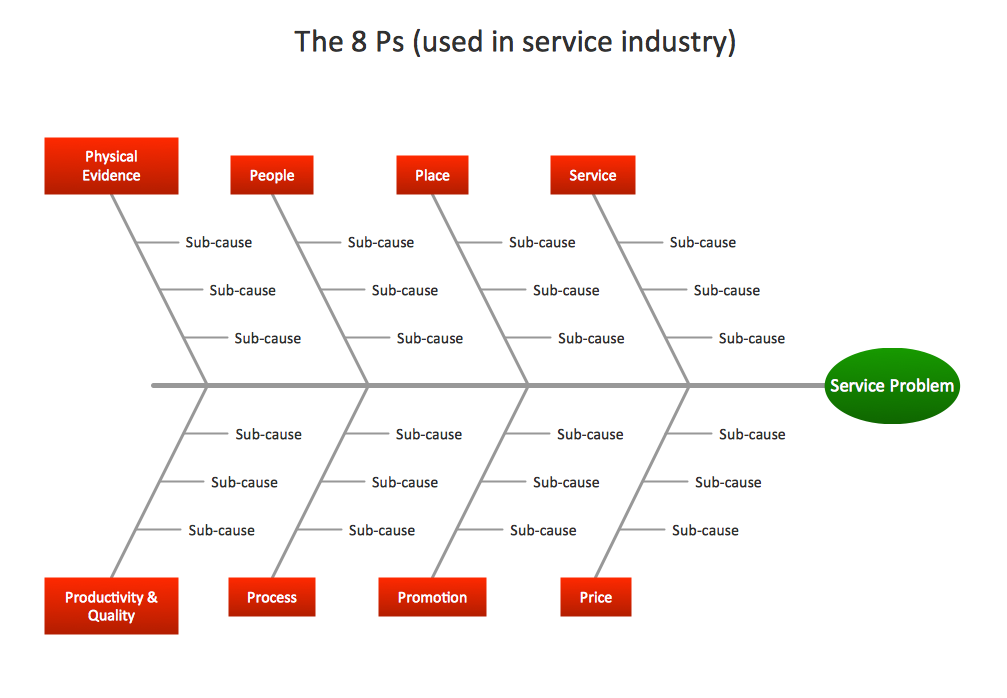
Marketing — The 8 Ps
- Product (product quality, features, brand, packaging)
- Distribution (locations, middle men, availability, stock levels)
- Price (retail price, manufacturing cost, discounts, pricing strategies)
- Promotion (advertising, publicity, web presence, market research)
- People (expertise, capabilities, experience, training)
- Processes (project management, product development)
- Performance (productivity, profitability)
- Philosophy (mission, planning, vision)
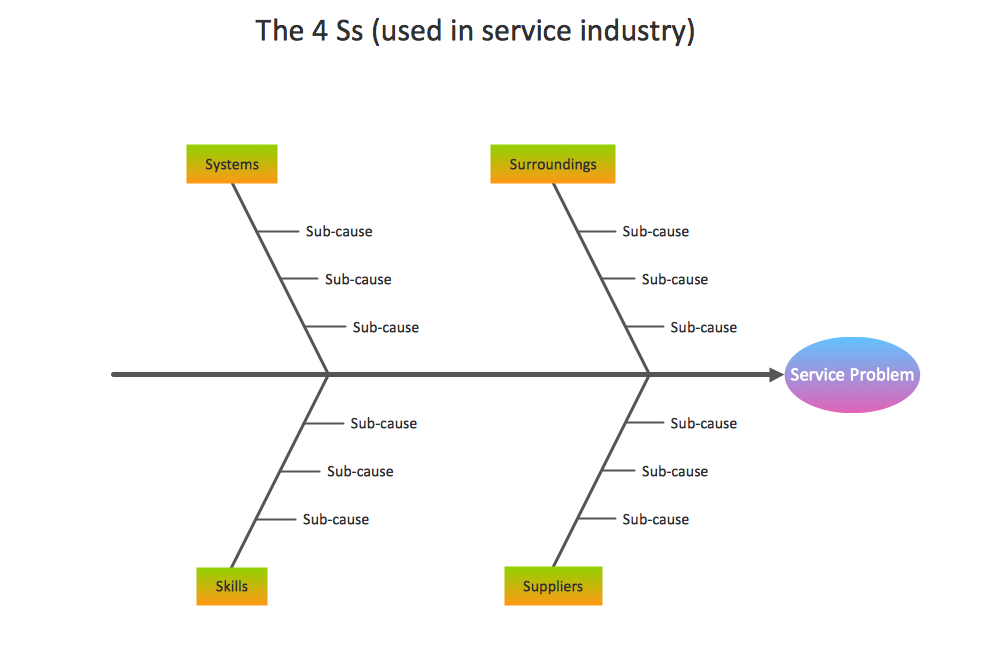
Services — The 5 Ss
- Surrounding (locations, local rules and customs)
- Suppliers (who provides resources, materials etc)
- Systems (computer systems or networks)
- Skills (aptitude of the workforce)
- Safety (codes and standards of best practice that must be followed)
These are some of the more common variants; different lists exist which add or take away certain elements, but these surmise the core principles. The simple intention is to encourage thorough inspection of anything that might relate to a core problem that needs solving — really, the prompts you use to do this are up to you.
Solving problems with ConceptDraw
As part of ConceptDraw's ever expanding portfolio of business productivity tools, the Fishbone Diagram solution offers assistance to those using problem solving techniques in their line of work. Combined with the intuitive controls of ConceptDraw DIAGRAM, the solution aims to be accessible for any level of user, with a full tutorial and video section for beginners. As ever with solutions from CS Odessa, full vector stencil libraries are provided, full of professionally designed graphics and icons, as well as an array of templates and samples that give an example of the sort of form a fishbone diagram can take.
The Fishbone Diagram solution is one of a number of solutions aimed at creating causal models and workflow problem solving. In fact, many of the diagrams listed alongside fishbones as the Seven Basic Tools of Quality have a dedicated solution or library found in ConceptDraw's Solution Park, such as root cause diagrams, flowcharts, and histograms. Taken together, all these elements combine to create a powerful software suite capable of taking care of all your problem solving requirements.