How to Create a Fishbone (Ishikawa) Diagram Quickly
The Cause and Effect analysis method is often used in management to identify the possible causes of a problem to eliminate them. The main goal of the Fishbone diagram is to illustrate graphically the relationship between a given outcome and all the factors that influence this outcome. The complete diagram resembles a fish skeleton, as its name implies. We recommend using ConceptDraw MINDMAP for generating structured data employed in Cause and Effect analysis, and then, ConceptDraw DIAGRAM for data visualization in a Fishbone (Ishikawa) diagram. The ability to create a Fishbone diagram from a mind map is delivered by the Fishbone Diagrams solution. This solution is installed for both MINDMAP and DIAGRAM.
- Run ConceptDraw MINDMAP.
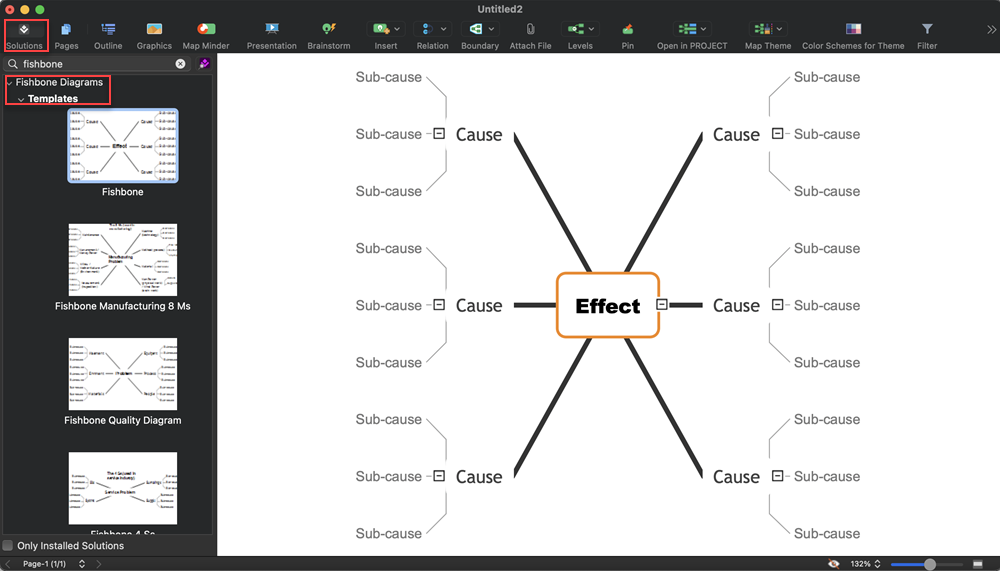
- You can use one of the pre-designed mind map templates, provided with the Fishbone Diagram solution. Develop a mind map that rates the potential causes according to their level of importance.

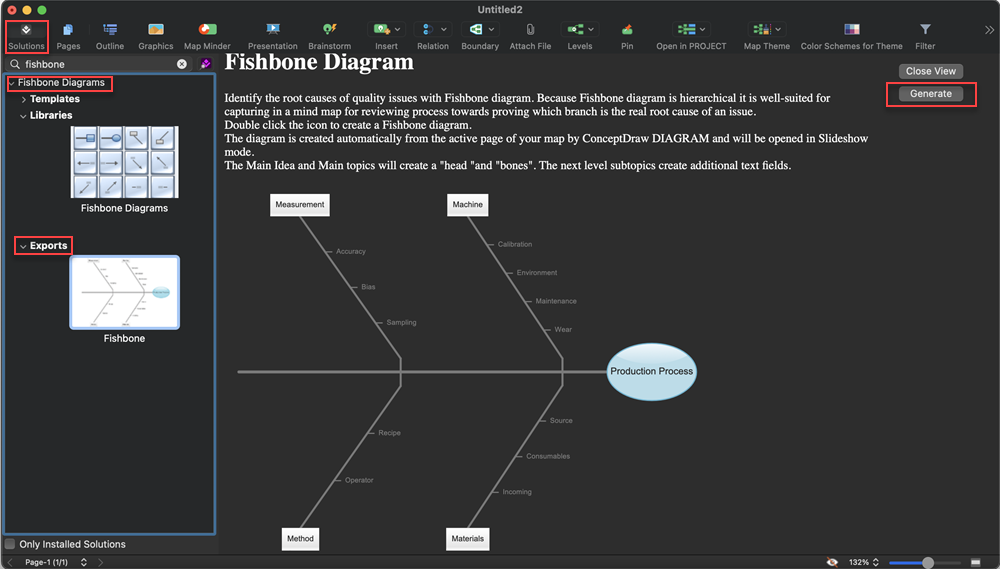
- Open the Export section, click the "Generate" button to convert the active page of your mind map into a Fishbone diagram.

- A Fishbone diagram will be generated in ConceptDraw DIAGRAM. It will be instantly opened in a presentation view.

Result: A Fishbone diagram is based on a mind map structure through ConceptDraw DIAGRAM.
|
How it works:
- Data exchange capabilities between
ConceptDraw MINDMAP and PRO
- Powerful management diagramming tool
Useful Solutions and Products:
- Easily draw charts and diagrams.
- Visualize business information
- Block Diagrams
- Bubble Diagrams
- Circle-Spoke Diagrams
- Circular Arrows Diagrams
- Concept Maps
- Flowcharts
- Venn Diagrams
- Management Diagrams: Matrixes, Deployment Charts, Organizational Charts, Fishbone Diagrams, Timelines.
- Mind Maps: decision making, scheduling, thinking ideas, problem solving, business planning, company organizing, meetings and presentations.
- Diagraming and Charts
- Vector Illustrations
- Maps
- Floor plans
- Engineering drawings
- Business dashboards
- Infographics
- Presentation
- Over 10 000 vector stencils
- Export to vector graphics files
- Export to Adobe Acrobat PDF
- Export to MS PowerPoint
- Export to MS Visio VSDX, VDX
|


 How To Use Solutions