- Electric and Telecom Plans Free
- Fire and Emergency Plans Free
- Floor Plans Free
- Plant Layout Plans Free
- School and Training Plans Free
- Seating Plans Free
- Security and Access Plans Free
- Site Plans Free
- Sport Field Plans Free
- Business Process Diagrams Free
- Business Process Mapping Free
- Classic Business Process Modeling Free
- Cross-Functional Flowcharts Free
- Event-driven Process Chain Diagrams Free
- IDEF Business Process Diagrams Free
- Logistics Flow Charts Free
- Workflow Diagrams Free
- ConceptDraw Dashboard for Facebook Free
- Mind Map Exchange Free
- MindTweet Free
- Note Exchange Free
- Project Exchange Free
- Social Media Response Free
- Active Directory Diagrams Free
- AWS Architecture Diagrams Free
- Azure Architecture Free
- Cisco Network Diagrams Free
- Cisco Networking Free
- Cloud Computing Diagrams Free
- Computer Network Diagrams Free
- Google Cloud Platform Free
- Interactive Voice Response Diagrams Free
- Network Layout Floor Plans Free
- Network Security Diagrams Free
- Rack Diagrams Free
- Telecommunication Network Diagrams Free
- Vehicular Networking Free
- Wireless Networks Free
- Comparison Dashboard Free
- Composition Dashboard Free
- Correlation Dashboard Free
- Frequency Distribution Dashboard Free
- Meter Dashboard Free
- Spatial Dashboard Free
- Status Dashboard Free
- Time Series Dashboard Free
- Basic Circle-Spoke Diagrams Free
- Basic Circular Arrows Diagrams Free
- Basic Venn Diagrams Free
- Block Diagrams Free
- Concept Maps Free
- Family Tree Free
- Flowcharts Free
- Basic Area Charts Free
- Basic Bar Graphs Free
- Basic Divided Bar Diagrams Free
- Basic Histograms Free
- Basic Line Graphs Free
- Basic Picture Graphs Free
- Basic Pie Charts Free
- Basic Scatter Diagrams Free
- Aerospace and Transport Free
- Artwork Free
- Audio, Video, Media Free
- Business and Finance Free
- Computers and Communications Free
- Holiday Free
- Manufacturing and Maintenance Free
- Nature Free
- People Free
- Presentation Clipart Free
- Safety and Security Free
- Analog Electronics Free
- Audio and Video Connectors Free
- Basic Circuit Diagrams Free
- Chemical and Process Engineering Free
- Digital Electronics Free
- Electrical Engineering Free
- Electron Tube Circuits Free
- Electronic Block Diagrams Free
- Fault Tree Analysis Diagrams Free
- GHS Hazard Pictograms Free
- Home Automation and Wiring Free
- Mechanical Engineering Free
- One-line Diagrams Free
- Power Сircuits Free
- Specification and Description Language (SDL) Free
- Telecom and AV Circuits Free
- Transport Hazard Pictograms Free
- Data-driven Infographics Free
- Pictorial Infographics Free
- Spatial Infographics Free
- Typography Infographics Free
- Calendars Free
- Decision Making Free
- Enterprise Architecture Diagrams Free
- Fishbone Diagrams Free
- Organizational Charts Free
- Plan-Do-Check-Act (PDCA) Free
- Seven Management and Planning Tools Free
- SWOT and TOWS Matrix Diagrams Free
- Timeline Diagrams Free
- Australia Map Free
- Continent Maps Free
- Directional Maps Free
- Germany Map Free
- Metro Map Free
- UK Map Free
- USA Maps Free
- Customer Journey Mapping Free
- Marketing Diagrams Free
- Matrices Free
- Pyramid Diagrams Free
- Sales Dashboard Free
- Sales Flowcharts Free
- Target and Circular Diagrams Free
- Cash Flow Reports Free
- Current Activities Reports Free
- Custom Excel Report Free
- Knowledge Reports Free
- MINDMAP Reports Free
- Overview Reports Free
- PM Agile Free
- PM Dashboards Free
- PM Docs Free
- PM Easy Free
- PM Meetings Free
- PM Planning Free
- PM Presentations Free
- PM Response Free
- Resource Usage Reports Free
- Visual Reports Free
- House of Quality Free
- Quality Mind Map Free
- Total Quality Management TQM Diagrams Free
- Value Stream Mapping Free
- Astronomy Free
- Biology Free
- Chemistry Free
- Language Learning Free
- Mathematics Free
- Physics Free
- Piano Sheet Music Free
- Android User Interface Free
- Class Hierarchy Tree Free
- Data Flow Diagrams (DFD) Free
- DOM Tree Free
- Entity-Relationship Diagram (ERD) Free
- EXPRESS-G data Modeling Diagram Free
- IDEF0 Diagrams Free
- iPhone User Interface Free
- Jackson Structured Programming (JSP) Diagrams Free
- macOS User Interface Free
- Object-Role Modeling (ORM) Diagrams Free
- Rapid UML Free
- SYSML Free
- Website Wireframe Free
- Windows 10 User Interface Free
Health Informatics
The medicine is developed very rapidly today, and the use of computer technologies and informatics in the healthcare field is very common and only contributes to this fact. The Health informatics is a specialized field combining information technologies and healthcare. It includes the resources, methods, technologies, information and communication systems, specialized software and devices necessary to collect, store, study, search, manage, process and use of medical data and information.
Health informatics is aimed at the improvement of the medical services quality, provision better medical care to the patients, automation of medical processes, mandatory reporting optimization process, reducing of the non-medical load of doctors and acceleration the process of issuing medical documents, statements, appointments, sick lists, improvement internal medical records and increasing the speed of search for the necessary data by the medical personnel. Besides, it provides efficient and intuitive methods of controlling the stored health information, guarantees data privacy, and helps managing the clinical workflow tasks.
The use of information technologies allows studying in details the normal and pathological processes into the human body, detecting different diseases and even the slightest deviation from the norm, that contributes to the successful treatment, preservation and improvement of human health, as well as facilitates the work of doctors and lets instantly processing the results of researches, so detailed information about the possible diagnosis can be obtained in a few minutes. The application of health informatics in medical institutions provides easy keeping a total account of patients, their medical records and medical data in electronic form, all services, researches, diagnostics, laboratory tests, prescriptions provided for them.
The automation of medical institutions opens the new prospects and great opportunities for the medical statistics, classification of medical information, reporting and creation of a single medical information space combining medical, diagnostic, administrative, economic and financial processes.
Health Informatics solution supplies the ConceptDraw DIAGRAM with tools and functionalities in a field of healthcare design and healthcare informatics. Including collection of professionally designed samples and a lot of high-quality health informatics vector design objects, it is the best for designing diagrams, schematics, flow charts, workflow charts, block diagrams, infographics, illustrations, and presentations slides in a field of Health Informatics, representing the newest medical information technologies, architectures of healthcare systems, principles of work of the specialized software, structures of health records systems, medical researches processes. It is the best for use by any medical workers, medical and statistic specialists, medical consultants, professors of medical sciences and lecturers in medical institutions, specialists of medical management, biologists, microbiologists, biotechnologists, highly specialized software specialists, and many other people of healthcare-related specialties.
-
Install this solution Free -
What I need to get started -
Solution Requirements - This solution requires the following products to be installed:
ConceptDraw DIAGRAM v18 - This solution requires the following products to be installed:
-
Compatibility - Sonoma (14), Sonoma (15)
MS Windows 10, 11 - Sonoma (14), Sonoma (15)
-
Support for this Solution -
Helpdesk
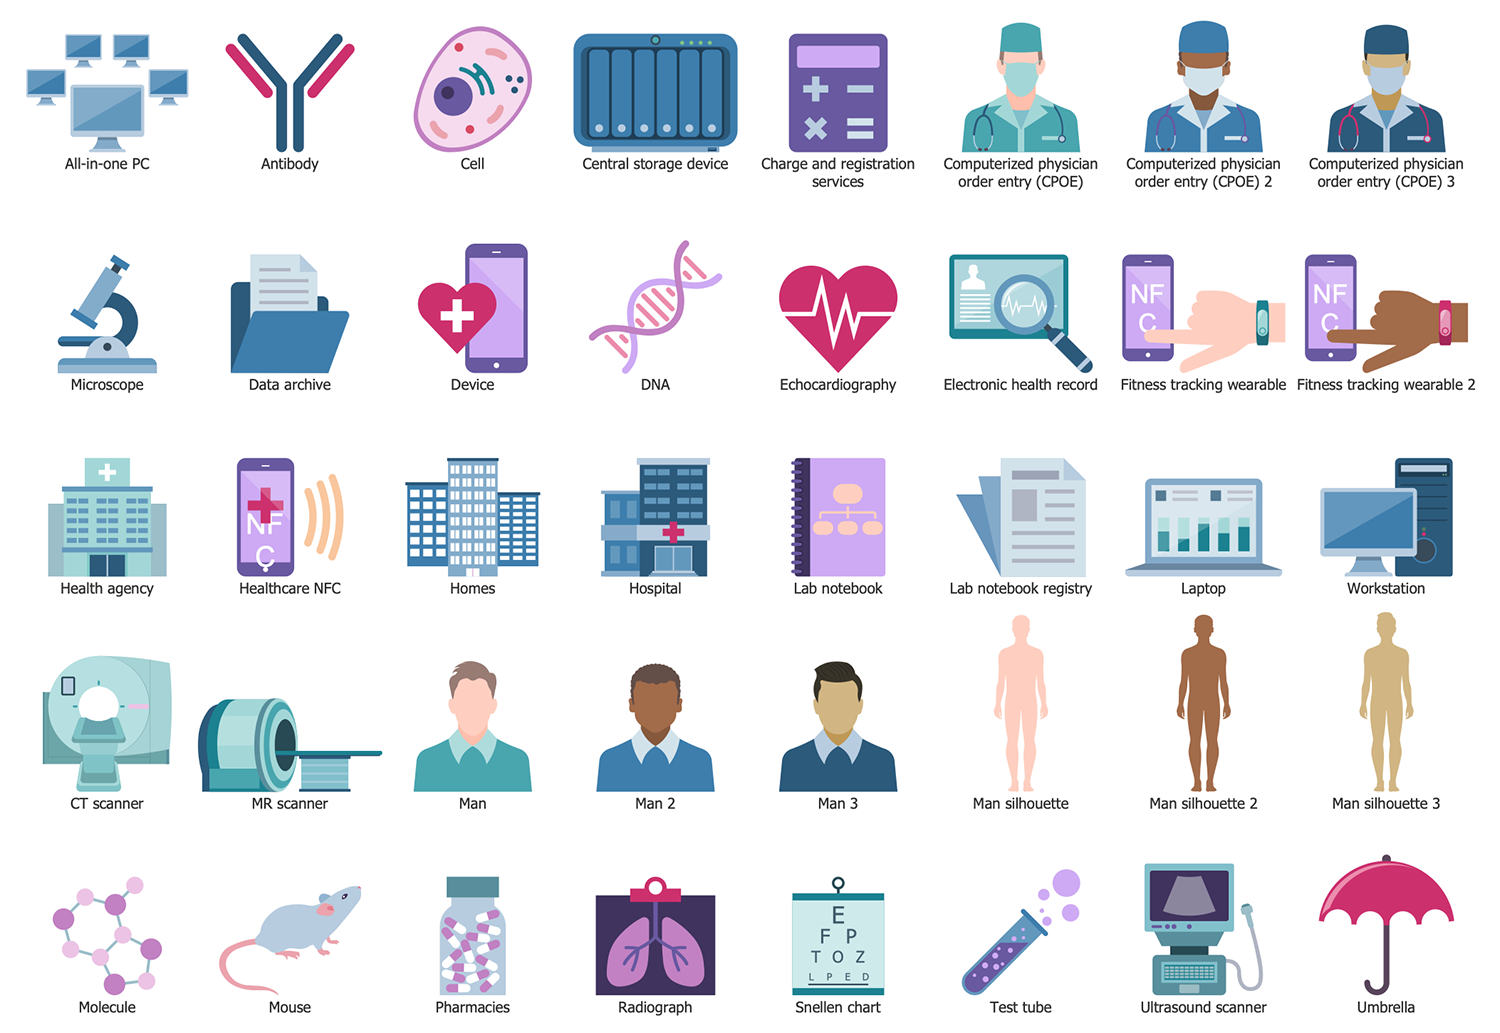
The Health Informatics solution contains 10 examples and 1 library containing 40 vector graphics and icons, to allow you to create professional looking documents.
Design Elements — Health Informatics
Examples
There are a few samples that you see on this page which were created in the ConceptDraw DIAGRAM application by using the Health Informatics solution. Some of the solution's capabilities as well as the professional results which you can achieve are all demonstrated here on this page.
All source documents are vector graphic documents which are always available for modifying, reviewing and/or converting to many different formats, such as MS PowerPoint, PDF file, MS Visio, and many other graphic ones from the ConceptDraw Solution Park or ConceptDraw STORE. The Health Informatics solution is available to all ConceptDraw DIAGRAM users to get installed and used while working in the ConceptDraw DIAGRAM diagramming and drawing software.
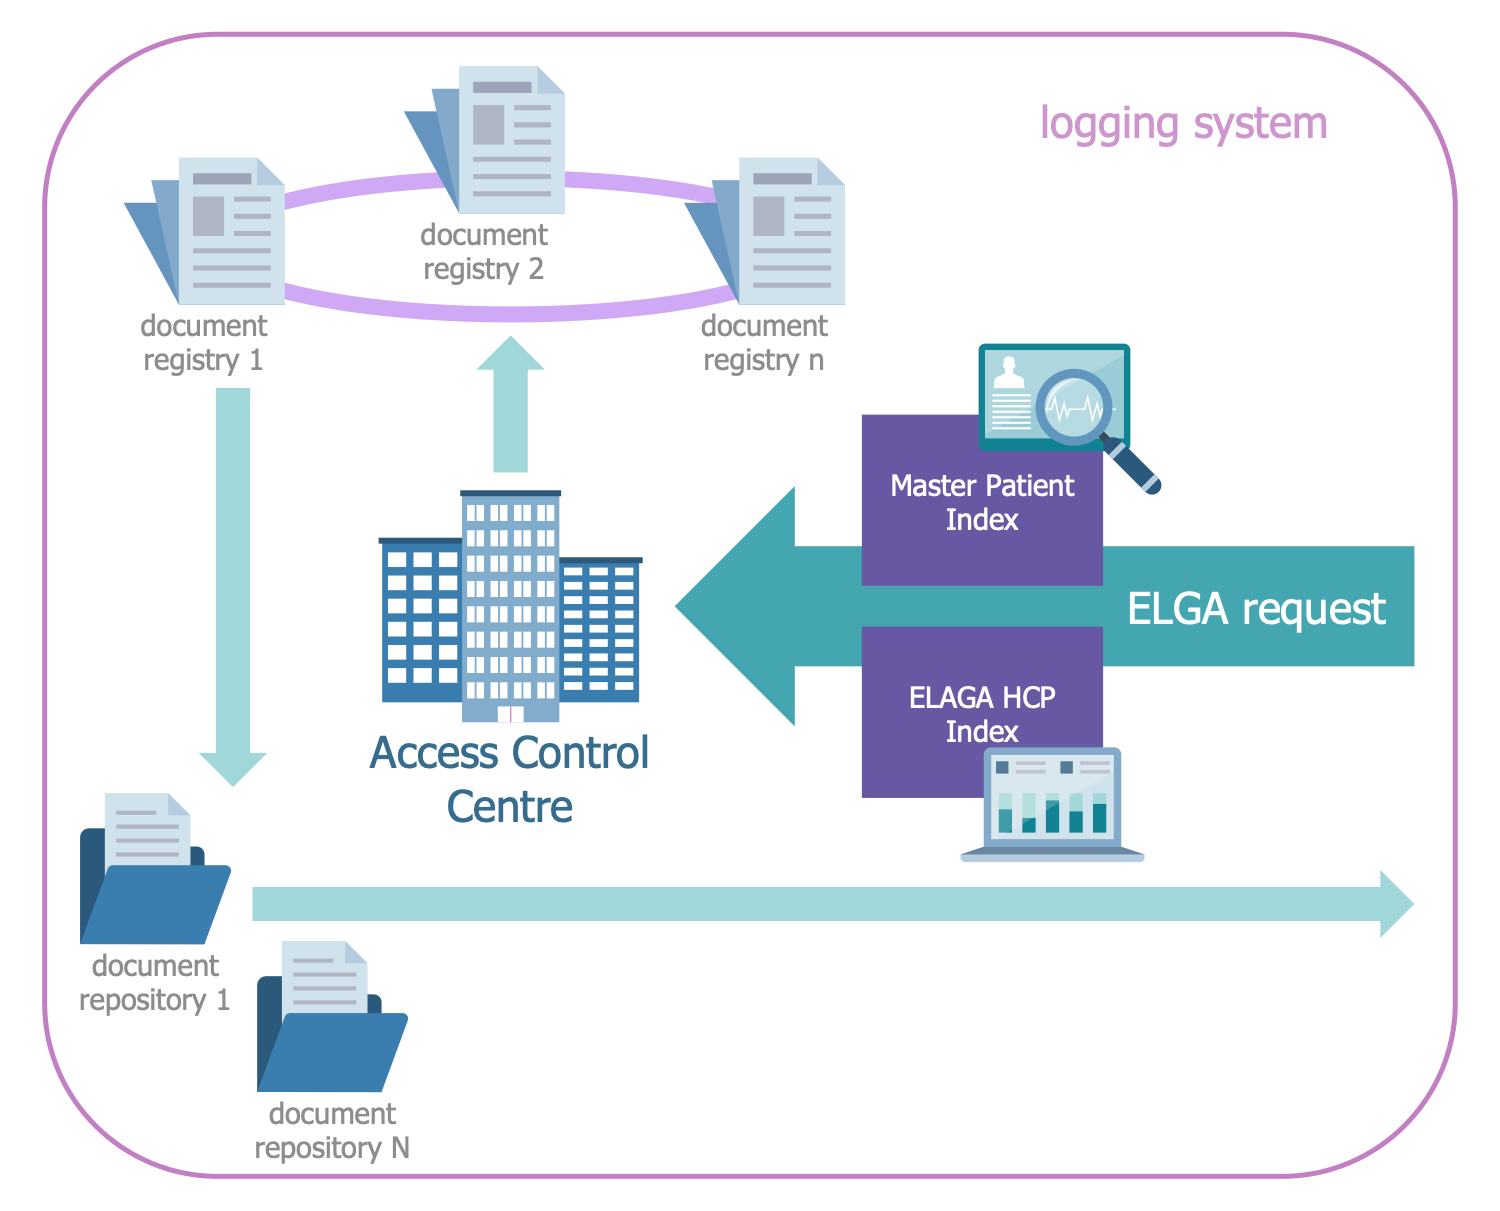
Example 1: Austrian Electronic Health Records Structure
This diagram was created in ConceptDraw DIAGRAM using the Health Informatics library from the Health Informatics Solution. An experienced user spent 10 minutes creating this sample.
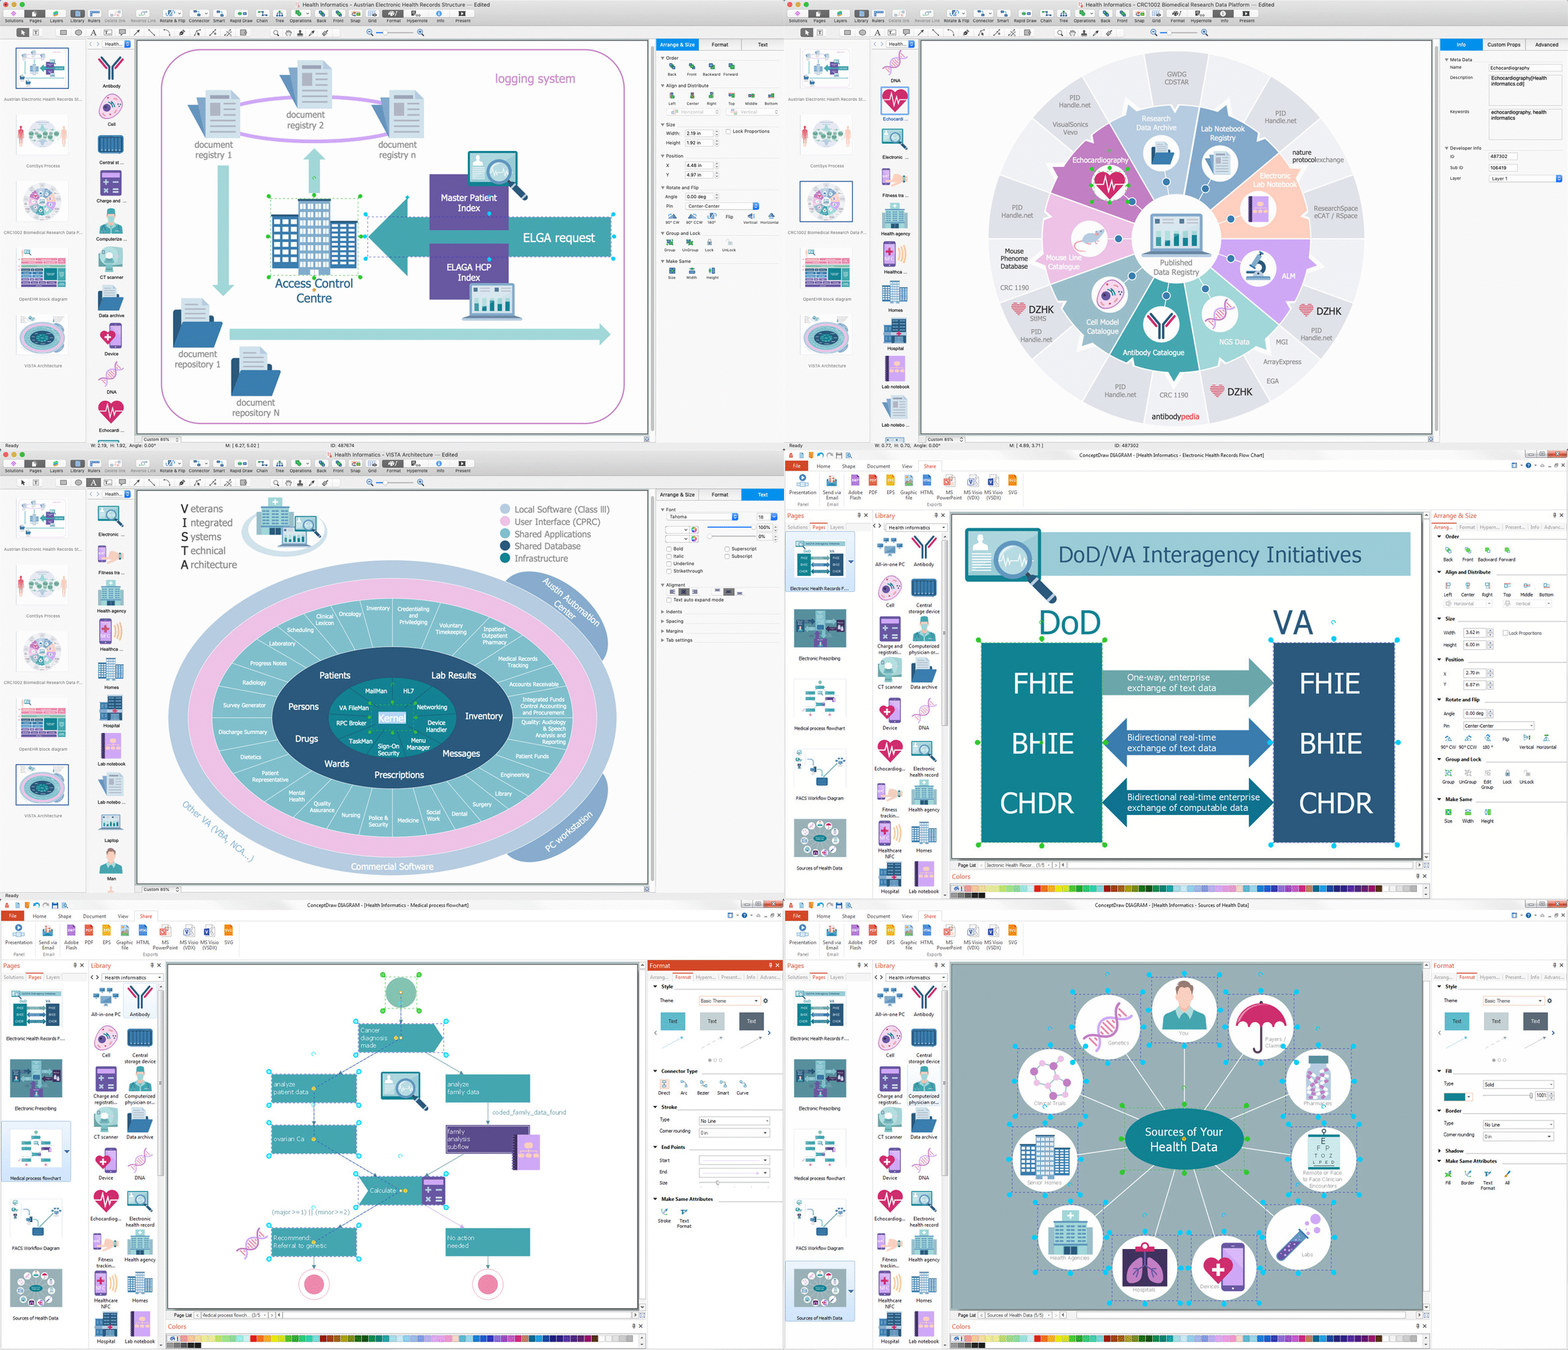
This sample represents the structure of the Austrian Electronic Health Records and its basic components. The Electronic Medical Records (EMR) or Electronic Health Records (EHR) is an electronic system that collects and stores the patients' and population health information in an electronic digital format. The EHR's data can be shared across different health care settings, but according to the law these personal health data can be used only for treatment purposes and carrying patients' rights, for the opposite cases are defined the judicial penalties, moreover data needs to be encrypted before transmission, the EHR-participants have full control over their data and can refuse the participation in a program at any moment. A similar system successfully works in Austria, where in December 2012 was introduced the Electronic Health Records Act (EHR-Act). The provisions of this document are one of the most detailed data protection rules in Austrian legislation and guarantee a high level of data protection.
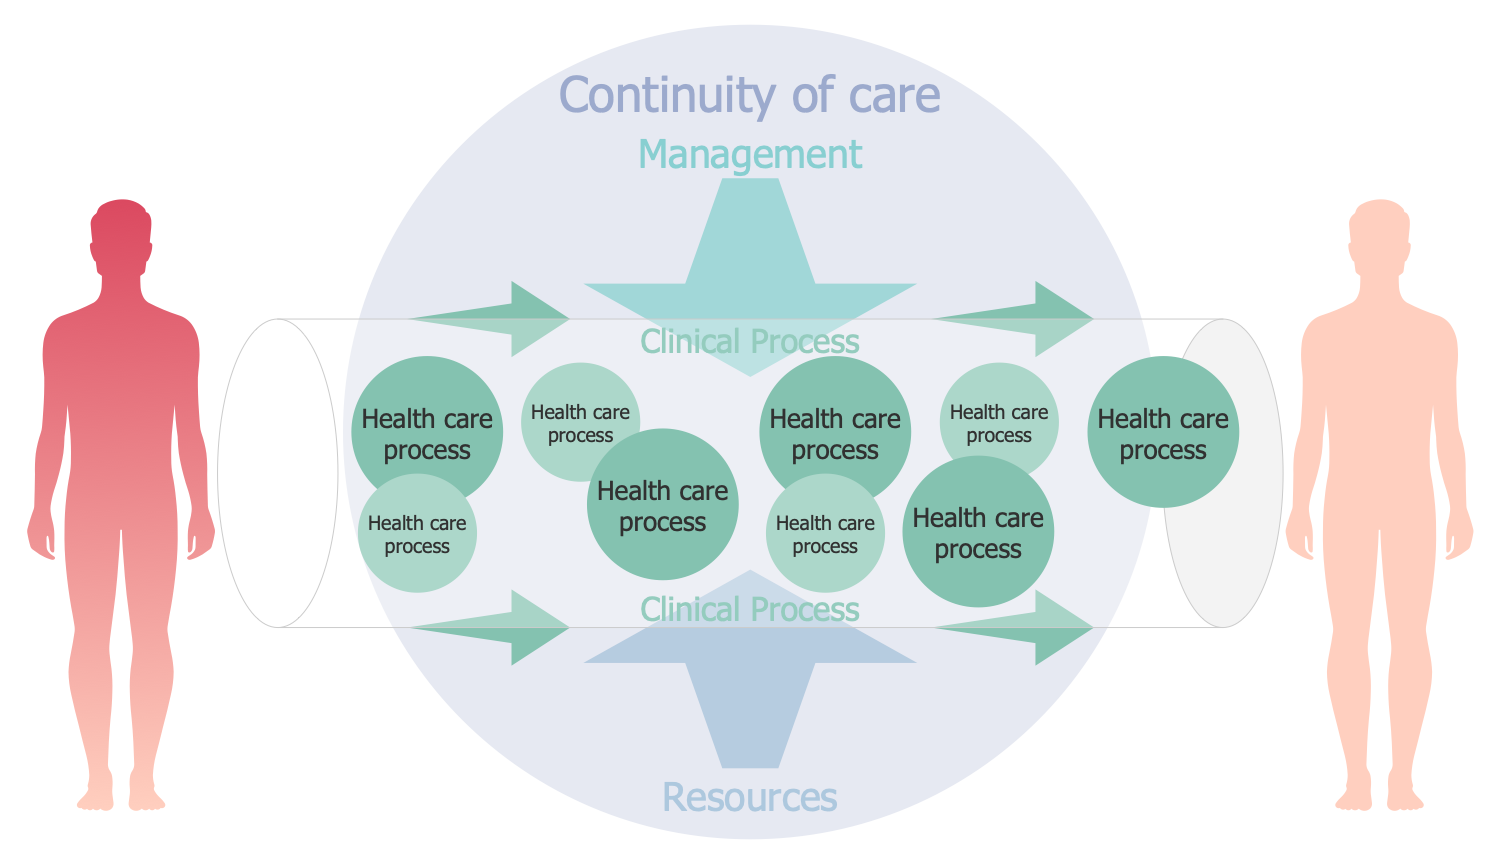
Example 2: ContSys Process
This diagram was created in ConceptDraw DIAGRAM using the Health Informatics library from the Health Informatics Solution. An experienced user spent 10 minutes creating this sample.
This sample demonstrates the System of concepts to support continuity of care (ContSys) and the relationship of the health care process to the clinical process. The ContSys is an ISO and CEN standard (EN ISO 13940) that prescribes the principles, basic concepts and aspects of quality and safety in health care. The main concepts were published as a European Norm in 2007, and later, in December 2015, a single standard conceptual model Health Informatics was formulated and published. The continuity of care is achieved in clinical processes and is influenced by the factors of management and support. The diagram aptly describes the ContSys process, clarifies the relationships between the components and depicts that the core clinical process, the management (informational and financial), and resources are required to cover continuity of care concepts. Due to the library's objects, the drawing of this and similar attractive diagrams won't take much time.
Example 3: CRC1002 Biomedical Research Data Platform
This diagram was created in ConceptDraw DIAGRAM using the Health Informatics library from the Health Informatics Solution. An experienced user spent 20 minutes creating this sample.
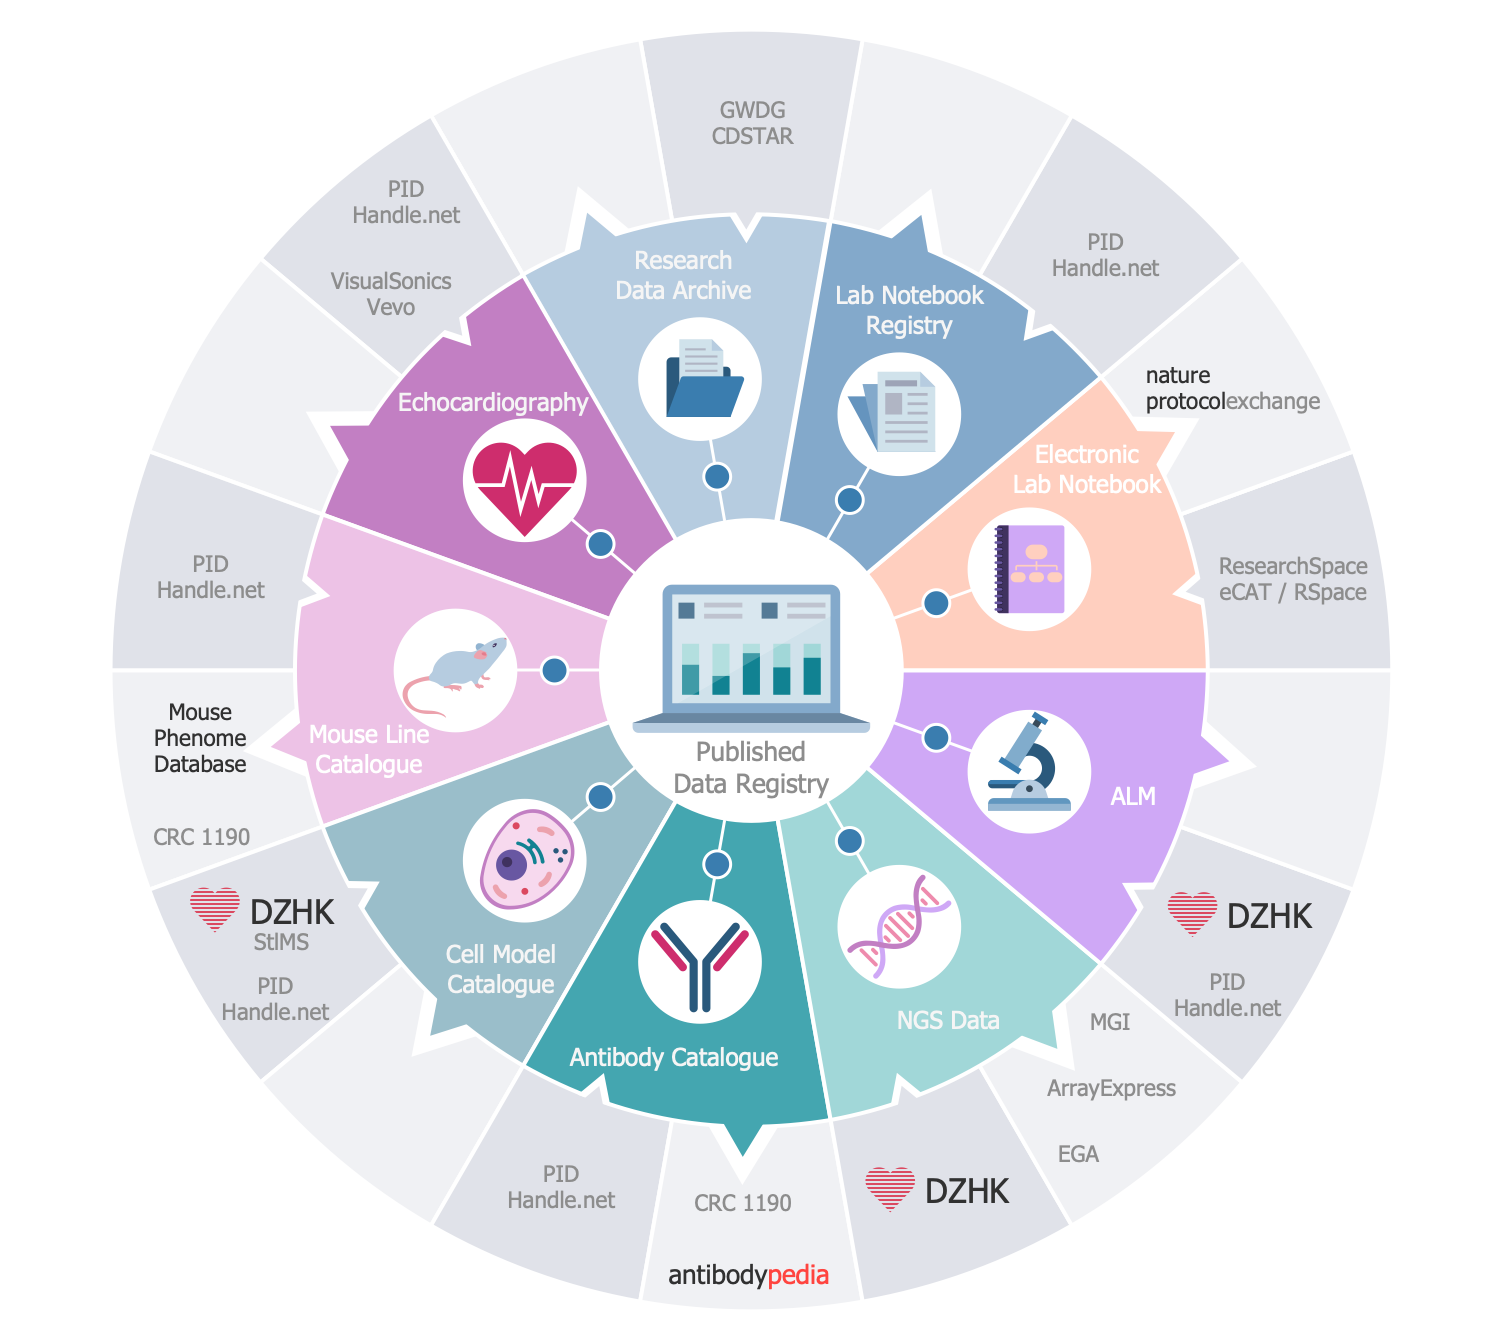
This sample diagram demonstrates the CRC 1002 Biomedical Research Data Platform. It is a modern medical platform the main goal of which is identification of the treatment targets and developing new progress therapeutic strategies to treat the patients with a heart failure, for which conventional therapeutic methods and strategies are not suitable. The identification of treatment goals is carried out by evaluating the spatial organization of signal transmission in micro- and nano-domains. The published data registry contains several catalogues and many types of data. Developed in the form of a Pie Chart, this diagram looks professional, accurate and strict, the color gamma was chosen in soothing colors, the sectors are visually separated from each other, that makes the diagram pleasing to an eye and easily perceived. The medical clipart from the Health Informatics library of the Health Informatics solution imparts to the diagram additional visualization.
Example 4: Electronic Health Records Flow Chart
This diagram was created in ConceptDraw DIAGRAM using the Health Informatics library from the Health Informatics Solution. An experienced user spent 5 minutes creating this sample.
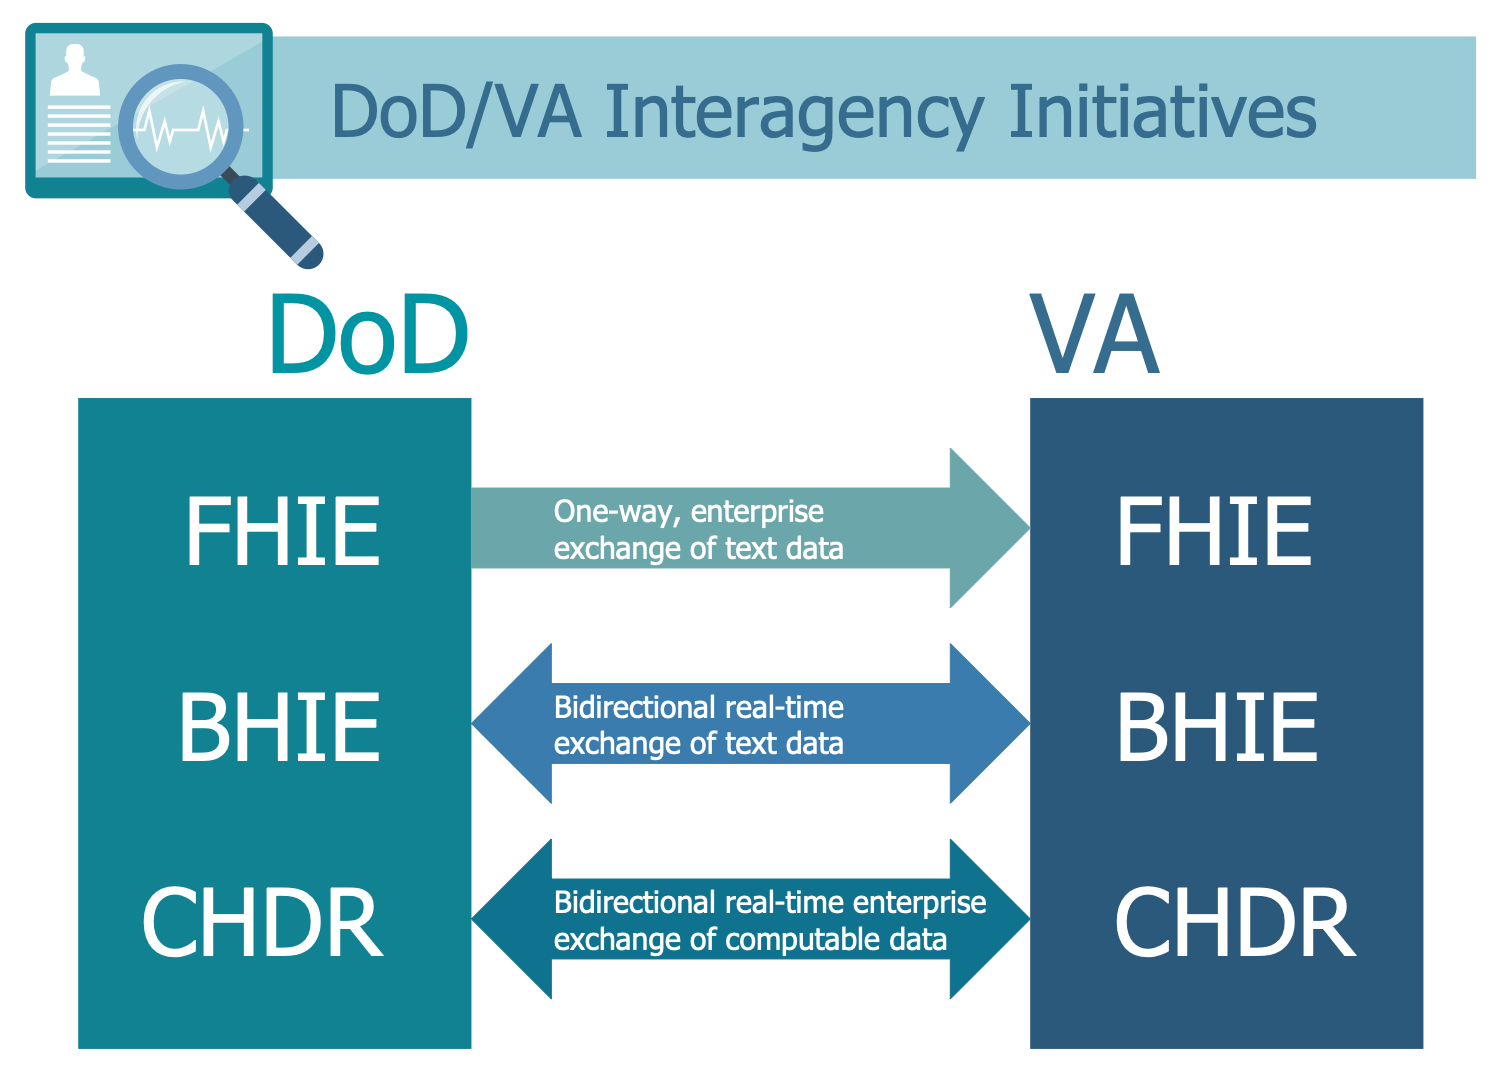
The electronic health records (EHRs) is a systematized electronically-stored collection of patients' health information, their medical histories, personal statistics, immunization status, laboratory test results, information about allergies, radiology images and billing information. It is a modern system in healthcare, actively promoted by the USA government. EHRs contribute to the improving quality of health care and use the analytics allowing preventing hospitalizations among high-risk patients. The US Department of Veterans Affairs (VA) possess the largest enterprise-wide health information system, its Computerized Patient Record System (CPRS) lets reviewing and updating the patient's medical information in any of 1000 VA's healthcare facilities. This sample shows the DoD (US Department of Defence) and VA interagency initiatives, which work together according to the National Defense Authorization Act approved in 2003 and provide the bidirectional exchange by qualitative medical images realizing the Bidirectional Health Information Exchange (BHIE), one-way Federal Health Information Exchange (FHIE) and having common Clinical Data Repository/Health Data Repository (CDHR).
Example 5: Electronic Prescribing
This diagram was created in ConceptDraw DIAGRAM using the Health Informatics library from the Health Informatics Solution. An experienced user spent 10 minutes creating this sample.
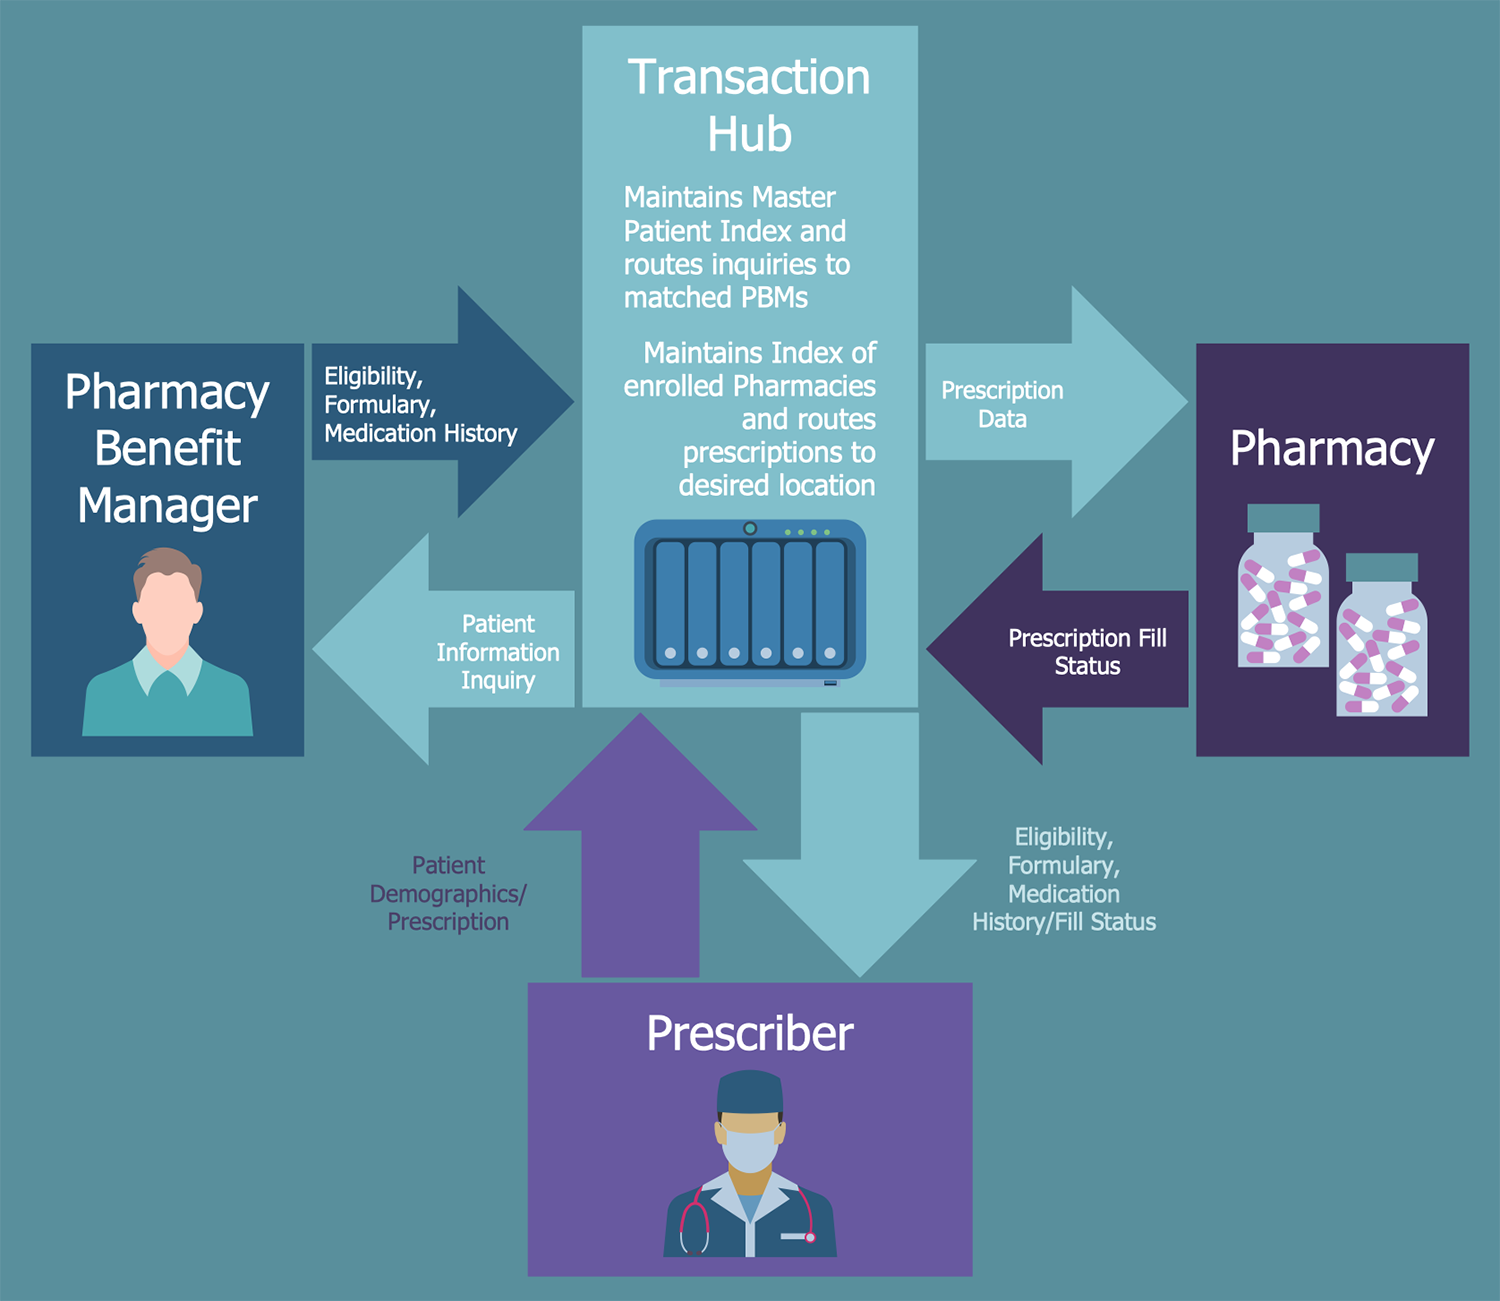
This health informatics sample shows the flow chart outlining the roles and actions involved in the process of electronic prescribing. The electronic prescribing system or e-prescribing system is a computer-based electronic system that replaces the paper prescriptions and provides transmission and filling of error-free, accurate, and understandable medical prescriptions in electronic form, as well as their sending from the healthcare provider to the pharmacy. The main components of this system are presented as boxes on the diagram, these are the prescriber (typically a physician), Pharmacy Benefit Manager (PBM), pharmacy with implemented electronic prescribing software and transaction hub. The processes are depicted by arrows. The components are consistently interacting, the Pharmacy Benefit Manager is an intermediate element that ensures the accuracy of information. The transaction hub maintains the master patient indexes and routes the inquiries to matched PBMs, also maintains the indexes of enrolled pharmacies and routes the prescriptions to the corresponding locations.
Example 6: Medical Process Flowchart
This diagram was created in ConceptDraw DIAGRAM using the Health Informatics library from the Health Informatics Solution. An experienced user spent 10 minutes creating this sample.
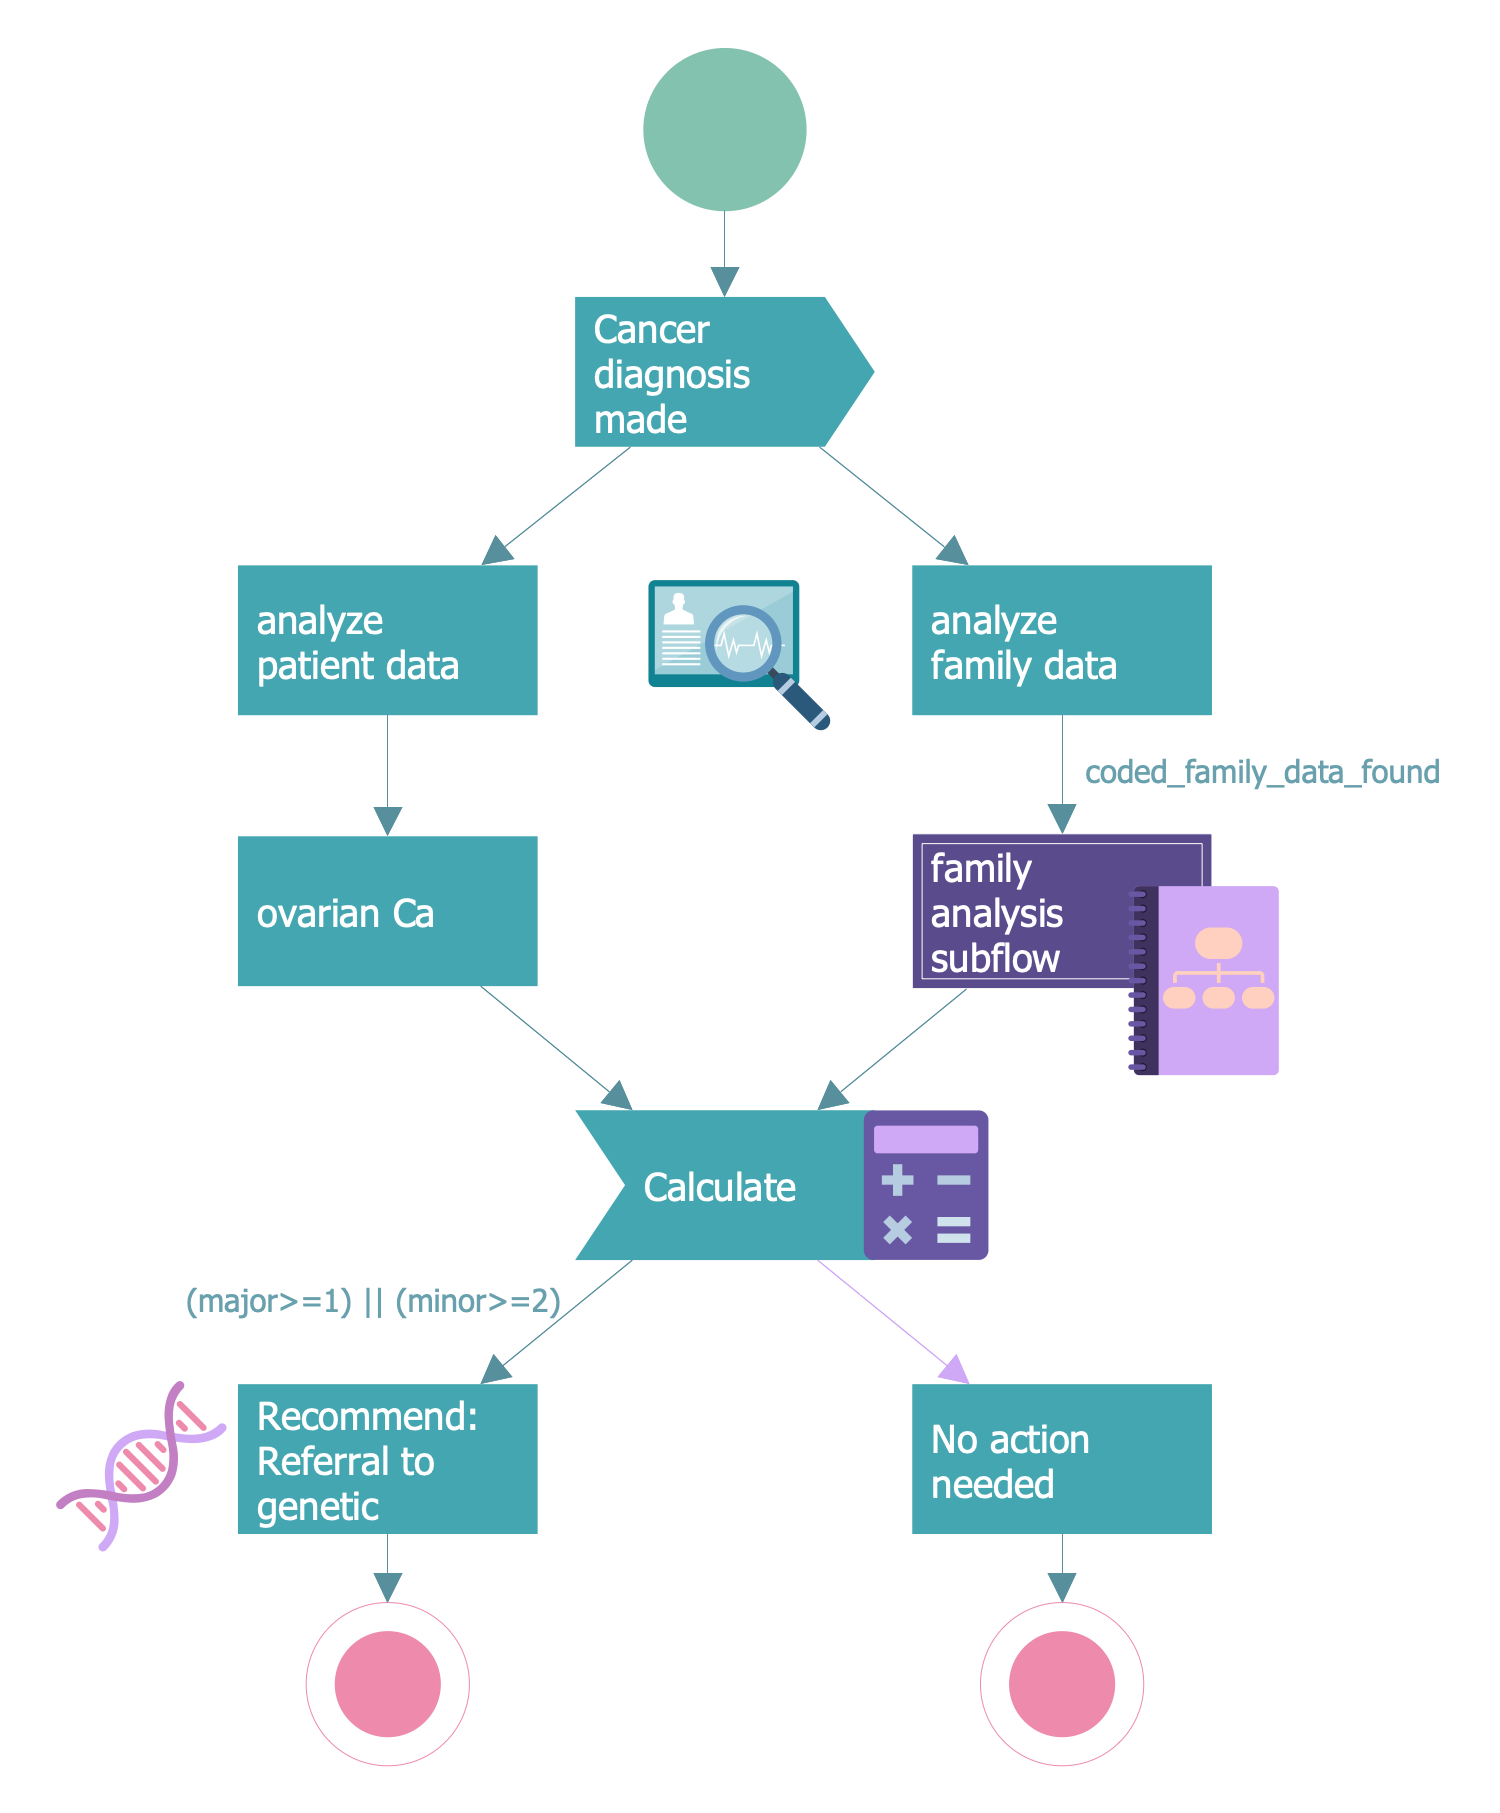
This sample represents the medical process flowchart. It is a classical flowchart designed using the XML Process Definition Language (XPDL) that is a standardized language intended for describing the definitions and implementations of different processes, for exchanging the process definitions between different information systems, both in graphic and semantic form. It is an international standard developed by the Workflow Management Coalition (WfMC). Today, the XPDL is the best choice of the file format for exchange of BPMN diagrams. The XML Process Definition Language contains the elements for storing both graphical aspects of a process diagram and executable aspects that will be used to run a definite process. The use of ConceptDraw DIAGRAM allows making the flow charts with any of modern notations. The applying of suitable clipart assists in designing your diagrams and flow charts allowing to construct them not only informative but also attractive and the best for use in presentations, articles, reports, etc.
Example 7: OpenEHR Block Diagram
This diagram was created in ConceptDraw DIAGRAM using the Health Informatics library from the Health Informatics Solution. An experienced user spent 10 minutes creating this sample.
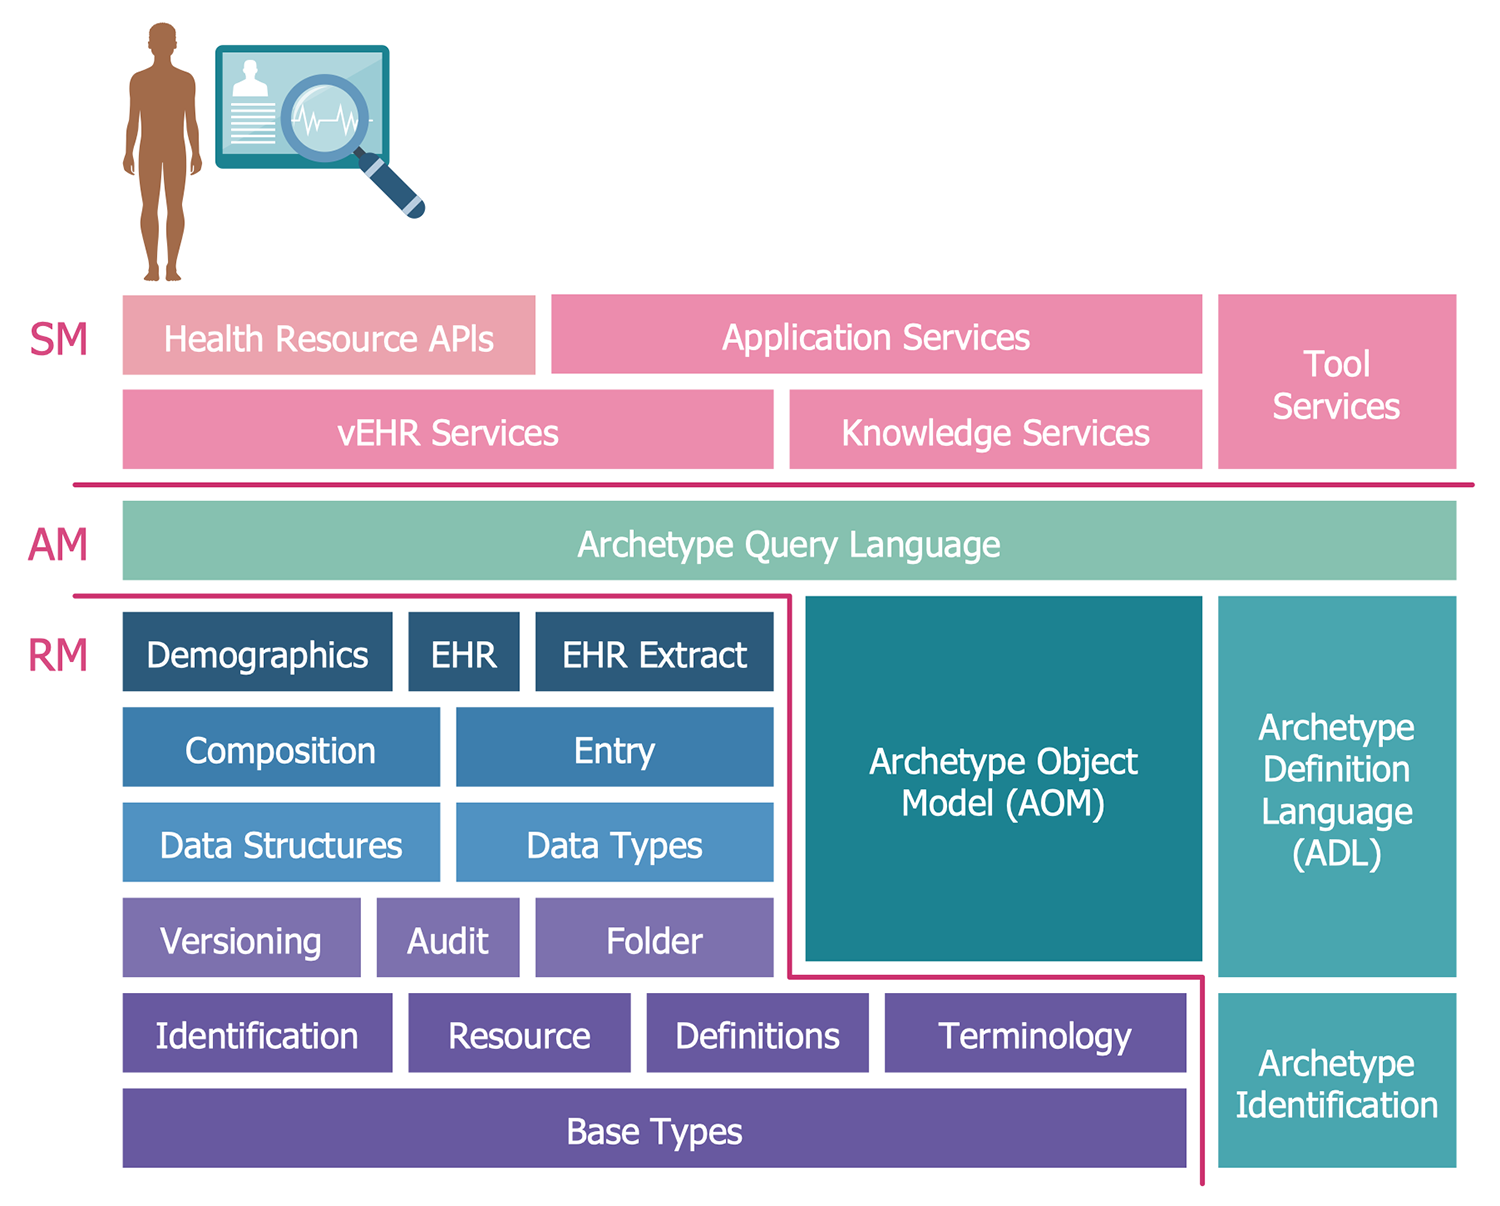
This health informatics sample illustrates the Block Diagram of the openEHR specification components. The openEHR is an open standard specification developed in a field of health informatics. It is used for describing the management, storage, retrieval, and exchange of health data in EHRs (Electronic Health Records). The openEHR specification is maintained by the not profit openEHR Foundation. The architecture overview of the openEHR specification is represented in this diagram. It is a brief description of the architecture showing that the openEHR includes a lot of components and several key elements groups, such as Reference Model (RM) or Information Model, the archetype formalism and portable archetype query language (AM), and Service Model (SM). The openEHR lets developing of the archetypes and templates, the archetype query language allows the building of queries on the base of the archetypes, not on the physical database schemes, the service model defines access to the key back-end services.
Example 8: PACS Workflow Diagram
This diagram was created in ConceptDraw DIAGRAM using the Health Informatics library from the Health Informatics Solution. An experienced user spent 10 minutes creating this sample.
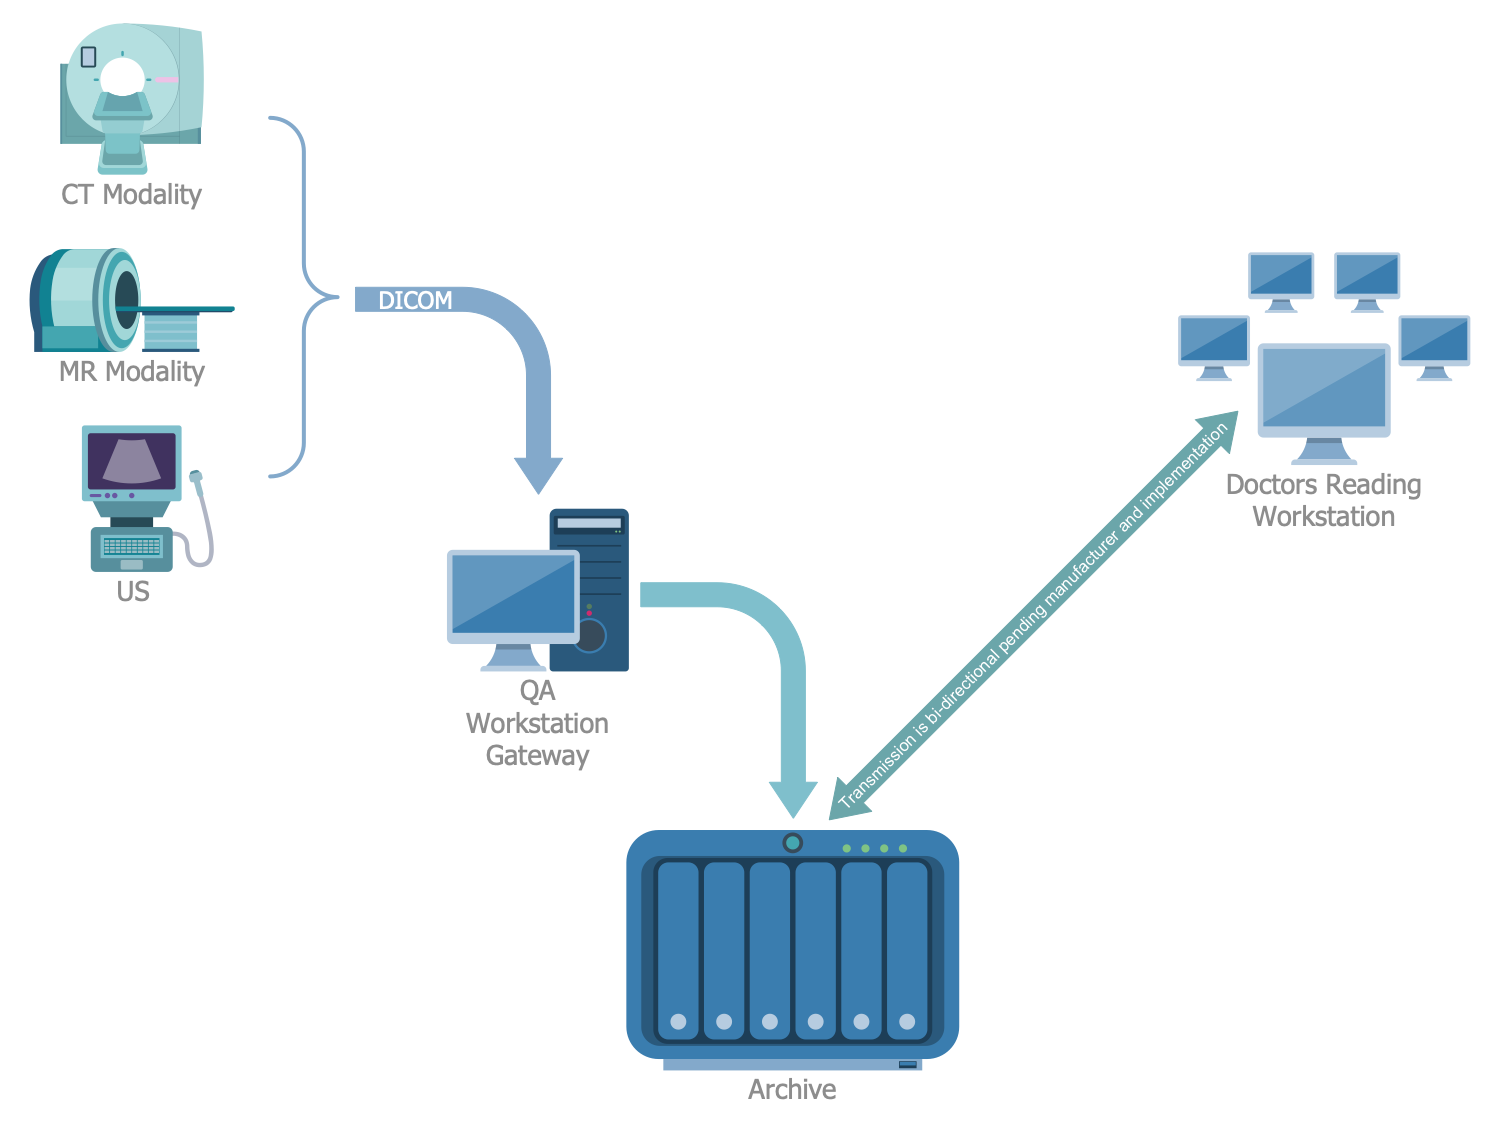
This diagram sample represents the picture archiving and communication system (PACS) workflow. PACS is a medical imaging technology that provides storage and archiving, as well as timely, efficient and convenient access and transfer of DICOM (Digital Imaging and Communications in Medicine) images. It assumes the creation of special remote archives on DICOM servers, where the huge archive can be stored a long time and be available for searching and viewing information of interest in any moment through the DICOM network. All images and reports are transmitted digitally via PACS and use a universal DICOM format. The non-image data and documents can be also included using such the PDF standard format. Among the main composing components of PACS are the following: imaging modalities (X-ray plain film (PF), computed tomography (CT), magnetic resonance imaging (MRI)), the secured network through which the patients' information is transmitted, the workstations for reviewing images, and archives for images' storage and retrieval.
Example 9: Sources of Health Data
This diagram was created in ConceptDraw DIAGRAM using the Health Informatics library from the Health Informatics Solution. An experienced user spent 10 minutes creating this sample.
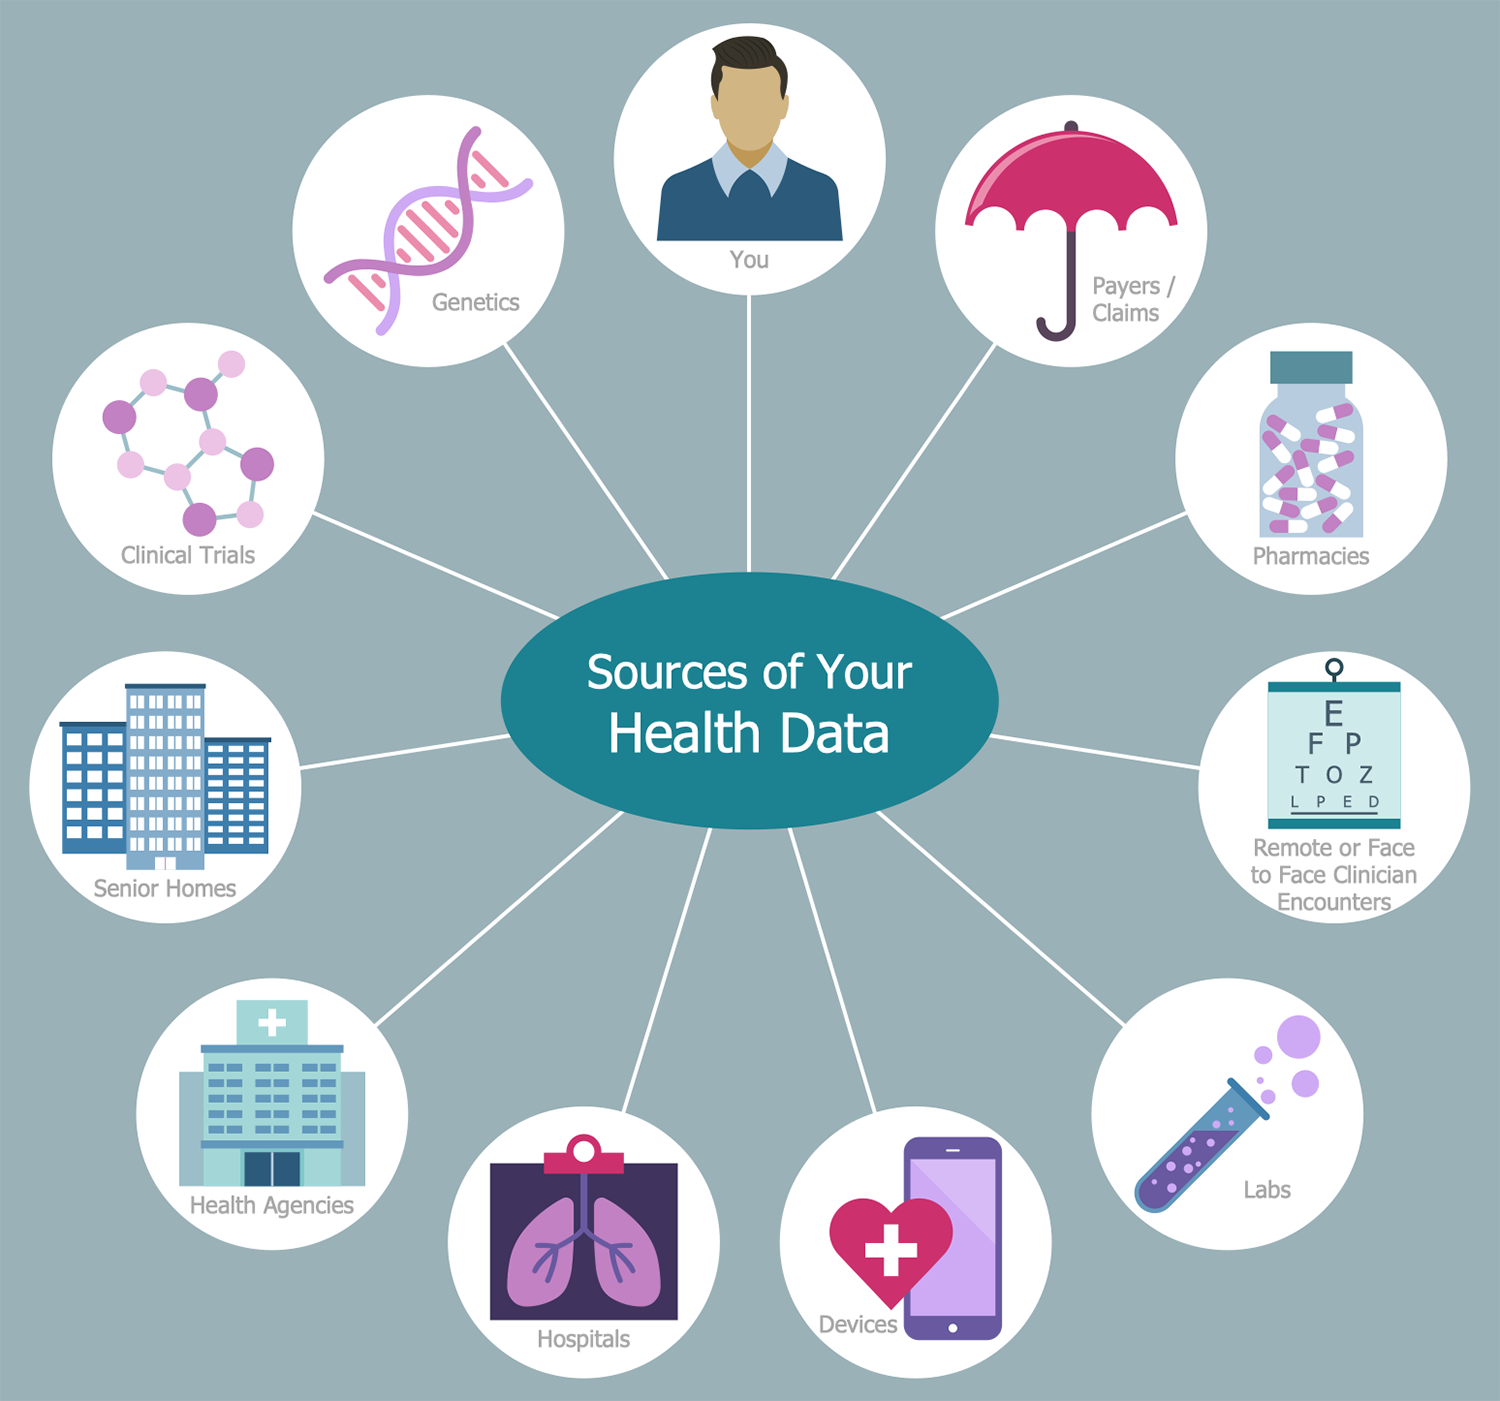
This sample diagram illustrates the sources of health data. Being made in the form of a circle-spoke diagram, it has a main topic at the center that is surrounded by the related medical data sources in the form of a wheel. Today, there are a lot of modern ways of receiving precise health data, and institutions that provide medical diagnostics and health researches. When using the health care systems, interacting with health care providers, physicians, nurses, and other health care workers in clinics, hospitals, laboratories, sanatoriums, and other health institutions, the patients get the versatile information about their health. The precise health information is collected through the surveys, analysis, clinical trials, genomic testing, at the use of modern medical devices and apparatus. Get closer to new technologies in health informatics, describe the latest achievements and technologies in the field of health and medicine in diagrams creating them with Health Informatics solution.
Example 10: VISTA Architecture
This diagram was created in ConceptDraw DIAGRAM using the Health Informatics library from the Health Informatics Solution. An experienced user spent 20 minutes creating this sample.
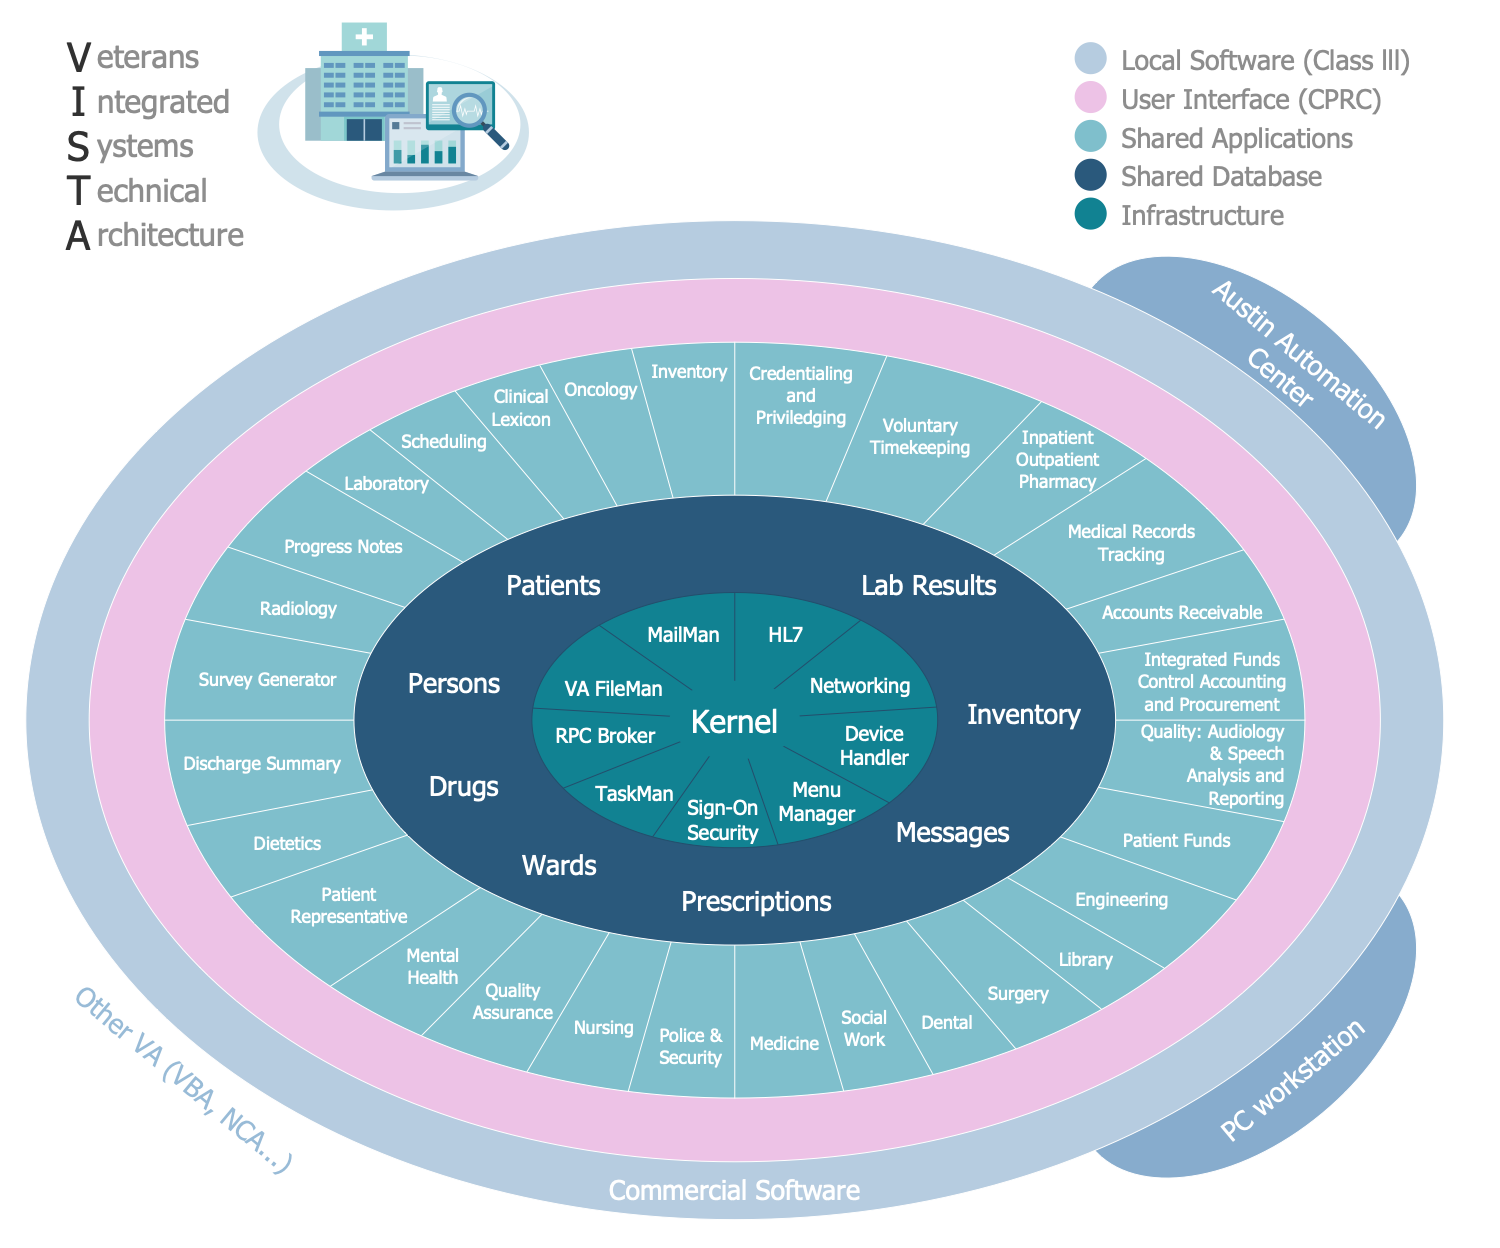
This sample demonstrates the Veterans Information Systems and Technology Architecture (VISTA) that is the USA nationwide veterans clinical and business information system. The scheme is constructed in the form of Onion diagram with concentric layers representing functions (Local software (Class III), User Interface (CPRC), Shared Applications, Shared Database, Infrastructure), the core of the system is located in the center. Each layer is filled with its own color, this division successfully performs a visual function, making the diagram more comprehensible. VISTA is a single, authoritative, and lifelong database of veterans’ health records. It is connected to the shared applications and provides a single authoritative source of data related to veterans, the care on them and other services. It includes 180 applications integrated within a single database, among them there are applications of different functions — clinical, financial, administrative, which are used by more than 1200 hospitals and clinics of the Veterans Health Administration.
Inside
What I Need to Get Started
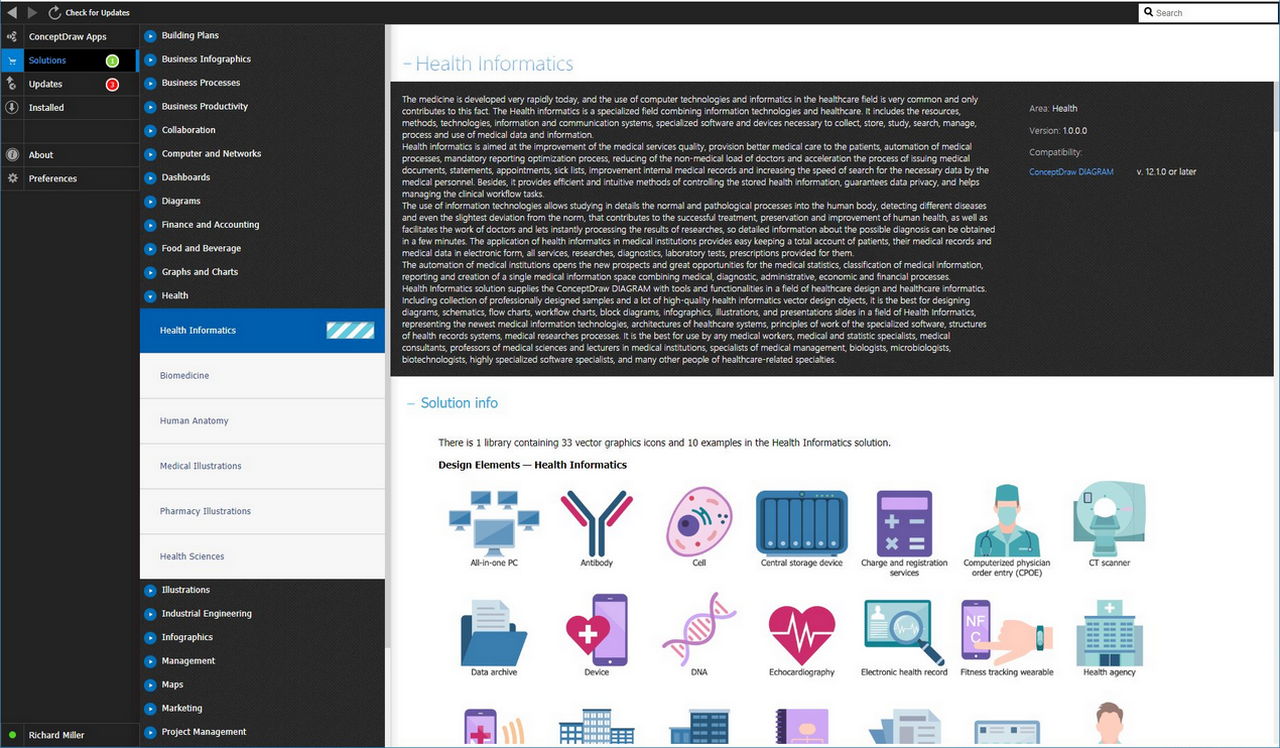
Both ConceptDraw DIAGRAM diagramming and drawing software and the Health Informatics solution can help creating the designing diagrams, schematics, flow charts, workflow charts, block diagrams, infographics, illustrations, and presentations slides you need. The Health Informatics solution can be found in the Health area of ConceptDraw STORE application that can be downloaded from this site. Make sure that both ConceptDraw DIAGRAM and ConceptDraw STORE applications are installed on your computer before you get started.
How to install
After ConceptDraw STORE and ConceptDraw DIAGRAM are downloaded and installed, you can install the Health Informatics solution from the ConceptDraw STORE.
Start using
To make sure that you are doing it all right, use the pre-designed symbols from the stencil libraries from the solution to make your drawings look smart and professional. Also, the pre-made examples from this solution can be used as drafts so your own drawings can be based on them. Using the samples, you can always change their structures, colors and data.
