- Electric and Telecom Plans Free
- Fire and Emergency Plans Free
- Floor Plans Free
- Plant Layout Plans Free
- School and Training Plans Free
- Seating Plans Free
- Security and Access Plans Free
- Site Plans Free
- Sport Field Plans Free
- Business Process Diagrams Free
- Business Process Mapping Free
- Classic Business Process Modeling Free
- Cross-Functional Flowcharts Free
- Event-driven Process Chain Diagrams Free
- IDEF Business Process Diagrams Free
- Logistics Flow Charts Free
- Workflow Diagrams Free
- ConceptDraw Dashboard for Facebook Free
- Mind Map Exchange Free
- MindTweet Free
- Note Exchange Free
- Project Exchange Free
- Social Media Response Free
- Active Directory Diagrams Free
- AWS Architecture Diagrams Free
- Azure Architecture Free
- Cisco Network Diagrams Free
- Cisco Networking Free
- Cloud Computing Diagrams Free
- Computer Network Diagrams Free
- Google Cloud Platform Free
- Interactive Voice Response Diagrams Free
- Network Layout Floor Plans Free
- Network Security Diagrams Free
- Rack Diagrams Free
- Telecommunication Network Diagrams Free
- Vehicular Networking Free
- Wireless Networks Free
- Comparison Dashboard Free
- Composition Dashboard Free
- Correlation Dashboard Free
- Frequency Distribution Dashboard Free
- Meter Dashboard Free
- Spatial Dashboard Free
- Status Dashboard Free
- Time Series Dashboard Free
- Basic Circle-Spoke Diagrams Free
- Basic Circular Arrows Diagrams Free
- Basic Venn Diagrams Free
- Block Diagrams Free
- Concept Maps Free
- Family Tree Free
- Flowcharts Free
- Basic Area Charts Free
- Basic Bar Graphs Free
- Basic Divided Bar Diagrams Free
- Basic Histograms Free
- Basic Line Graphs Free
- Basic Picture Graphs Free
- Basic Pie Charts Free
- Basic Scatter Diagrams Free
- Aerospace and Transport Free
- Artwork Free
- Audio, Video, Media Free
- Business and Finance Free
- Computers and Communications Free
- Holiday Free
- Manufacturing and Maintenance Free
- Nature Free
- People Free
- Presentation Clipart Free
- Safety and Security Free
- Analog Electronics Free
- Audio and Video Connectors Free
- Basic Circuit Diagrams Free
- Chemical and Process Engineering Free
- Digital Electronics Free
- Electrical Engineering Free
- Electron Tube Circuits Free
- Electronic Block Diagrams Free
- Fault Tree Analysis Diagrams Free
- GHS Hazard Pictograms Free
- Home Automation and Wiring Free
- Mechanical Engineering Free
- One-line Diagrams Free
- Power Сircuits Free
- Specification and Description Language (SDL) Free
- Telecom and AV Circuits Free
- Transport Hazard Pictograms Free
- Data-driven Infographics Free
- Pictorial Infographics Free
- Spatial Infographics Free
- Typography Infographics Free
- Calendars Free
- Decision Making Free
- Enterprise Architecture Diagrams Free
- Fishbone Diagrams Free
- Organizational Charts Free
- Plan-Do-Check-Act (PDCA) Free
- Seven Management and Planning Tools Free
- SWOT and TOWS Matrix Diagrams Free
- Timeline Diagrams Free
- Australia Map Free
- Continent Maps Free
- Directional Maps Free
- Germany Map Free
- Metro Map Free
- UK Map Free
- USA Maps Free
- Customer Journey Mapping Free
- Marketing Diagrams Free
- Matrices Free
- Pyramid Diagrams Free
- Sales Dashboard Free
- Sales Flowcharts Free
- Target and Circular Diagrams Free
- Cash Flow Reports Free
- Current Activities Reports Free
- Custom Excel Report Free
- Knowledge Reports Free
- MINDMAP Reports Free
- Overview Reports Free
- PM Agile Free
- PM Dashboards Free
- PM Docs Free
- PM Easy Free
- PM Meetings Free
- PM Planning Free
- PM Presentations Free
- PM Response Free
- Resource Usage Reports Free
- Visual Reports Free
- House of Quality Free
- Quality Mind Map Free
- Total Quality Management TQM Diagrams Free
- Value Stream Mapping Free
- Astronomy Free
- Biology Free
- Chemistry Free
- Language Learning Free
- Mathematics Free
- Physics Free
- Piano Sheet Music Free
- Android User Interface Free
- Class Hierarchy Tree Free
- Data Flow Diagrams (DFD) Free
- DOM Tree Free
- Entity-Relationship Diagram (ERD) Free
- EXPRESS-G data Modeling Diagram Free
- IDEF0 Diagrams Free
- iPhone User Interface Free
- Jackson Structured Programming (JSP) Diagrams Free
- macOS User Interface Free
- Object-Role Modeling (ORM) Diagrams Free
- Rapid UML Free
- SYSML Free
- Website Wireframe Free
- Windows 10 User Interface Free
Marketing Diagrams
The modern market is characterized by high dynamic and variability, and the business success consists from the number of factors and criteria, which require from businessmen the constant attention. Whatever business sphere you will consider, it is important to develop the correct company's promotion strategy on the market, as well as regularly realize the marketing analysis and marketing researches with a goal of effective realization the company's potential in a competitive environment, maximization profits, attraction the new customers and retaining the regular ones. For company’s successful development, for stable and growing income, you need analyze many factors and indicators, such as consumer demand, the competitiveness of product and company as a whole, the ability to adapt to the changing market conditions, etc. That is why the marketing, marketing researches, marketing analysis and other types of marketing activities are important components of business and any business project.
The marketing analysis is quite diverse. The marketing analysis of the market implies collection, analysis and processing of marketing information, evaluation, modelling and prediction of processes and market’s phenomena. The marketing analysis of particular enterprise’s activity is also important, it includes analysis of all processes occurring at the company and is performed with help of economic, statistical and other research methods. The marketing analysis of competitors lets you to determine the competitiveness of your company, while the marketing analysis of project or product is an analysis of processes for implementation of an individual project and the competitiveness of this product on market.
The marketing data analysis is quite complex and time-consuming process, which always depends on a number of factors. At the same time, there are many specially developed algorithms, methods and techniques allowing facilitate this process. Many of them use a visualization with help of appropriate types of marketing diagrams and graphs. Speaking about the marketing researches and results of their realization, we want also note the necessity of composing the reports, presentations and other types of reporting documentation, which typically consist of text and graphical illustrations. The visual representation of data is implemented using the tables, graphs and charts, which help fully and accurately convey the goals, objectives and methodology of researches, the main results and conclusions. The brevity, clarity, and precision of data representation on the diagrams lets to see important details in a moment, as well as to keep the audience's attention and interest during the presentations and reports.
Marketing Diagrams solution extends ConceptDraw DIAGRAM diagramming software with abundance of samples, templates and vector design elements that are gathered within library and intended for easy graphical visualization and drawing different types of Marketing diagrams and graphs, including Branding Strategies Diagram, Five Forces Model Diagram, Decision Tree Diagram, Puzzle Diagram, Step Diagram, Process Chart, Strategy Map, Funnel Diagram, Value Chain Diagram, Ladder of Customer Loyalty Diagram, Leaky Bucket Diagram, Promotional Mix Diagram, Service-Goods Continuum Diagram, Six Markets Model Diagram, Sources of Customer Satisfaction Diagram, etc. Analyze effectively the marketing activity of your company and apply the optimal marketing methods with ConceptDraw DIAGRAM software.
-
Install this solution Free -
What I need to get started -
Solution Requirements - This solution requires the following products to be installed:
ConceptDraw DIAGRAM v18 - This solution requires the following products to be installed:
-
Compatibility - Sonoma (14), Sonoma (15)
MS Windows 10, 11 - Sonoma (14), Sonoma (15)
-
Support for this Solution -
Helpdesk
Design Elements — Marketing Diagrams

Related News:
Important Update to Marketing Diagrams Solution
CS Odessa Announces Additions to Marketing Area in ConceptDraw Solution Park
Examples
There are a few samples that you see on this page which were created in the ConceptDraw DIAGRAM application by using the Marketing Diagrams solution. Some of the solution's capabilities as well as the professional results which you can achieve are all demonstrated here on this page.
All source documents are vector graphic documents which are always available for modifying, reviewing and/or converting to many different formats, such as MS PowerPoint, PDF file, MS Visio, and many other graphic ones from the ConceptDraw Solution Park or ConceptDraw STORE. The Marketing Diagrams solution is available to all ConceptDraw DIAGRAM users to get installed and used while working in the ConceptDraw DIAGRAM diagramming and drawing software.
Example 1: Diffusion of Innovations Graph
This diagram was created in ConceptDraw DIAGRAM using the "Marketing Diagrams" library from the Marketing Diagrams Solution. An experienced user spent 5 minutes creating this sample.
This sample diagram shows the Diffusion of Innovations (DOI) graph visually illustrating the diffusion of innovations theory. Diffusion is a process of transmission the innovations through the channels over time among the members of a certain social system. Diffusion of Innovations is a theory of Everett Rogers, which is based on the concept that there are four basic elements influencing the spread of new technologies and new ideas, these are: innovations, communication channels, time, and social system. This theory helps to explain how, why, and at what rate these new ideas and technologies spread in different cultures and fields, because it largely depends from the human capital, the type of adopters, the innovation-decision process, and expresses differently in various cultures. This graph visually displays the groups of consumers adopting the new technology. You can see the percentage distribution of following adopters' categories: Innovators, Early Adopters, Early Majority, Late Majority, and Laggards.

Example 2: Marketing Diagram — Decision Tree
This diagram was created in ConceptDraw DIAGRAM using the "Marketing Diagrams" library from the Marketing Diagrams Solution. An experienced user spent 15 minutes creating this sample.
This sample shows the decision tree that is a visual and analytical tool for displaying a decision making process, all possible variants and consequences, even including resource costs, utility, expected values of competing alternatives and chance event outcomes. Decision trees look like the flowcharts designed in a form of trees and are daily used in statistics and data analysis, decision analysis and operations researches. They successfully help to define the best strategy to reach a goal. Decision trees use three types of nodes: decision nodes that are represented by squares, chance nodes are depicted by circles, and end nodes are represented by triangles on a diagram. Internal nodes represent the test on attributes, the branches are the outcomes of tests and leaf nodes represent the class labels, at this decision is taken after computing all attributes and the path from a root to leaf represents classification rules. It is useful to use the color accents for the final decisions to make them evident.

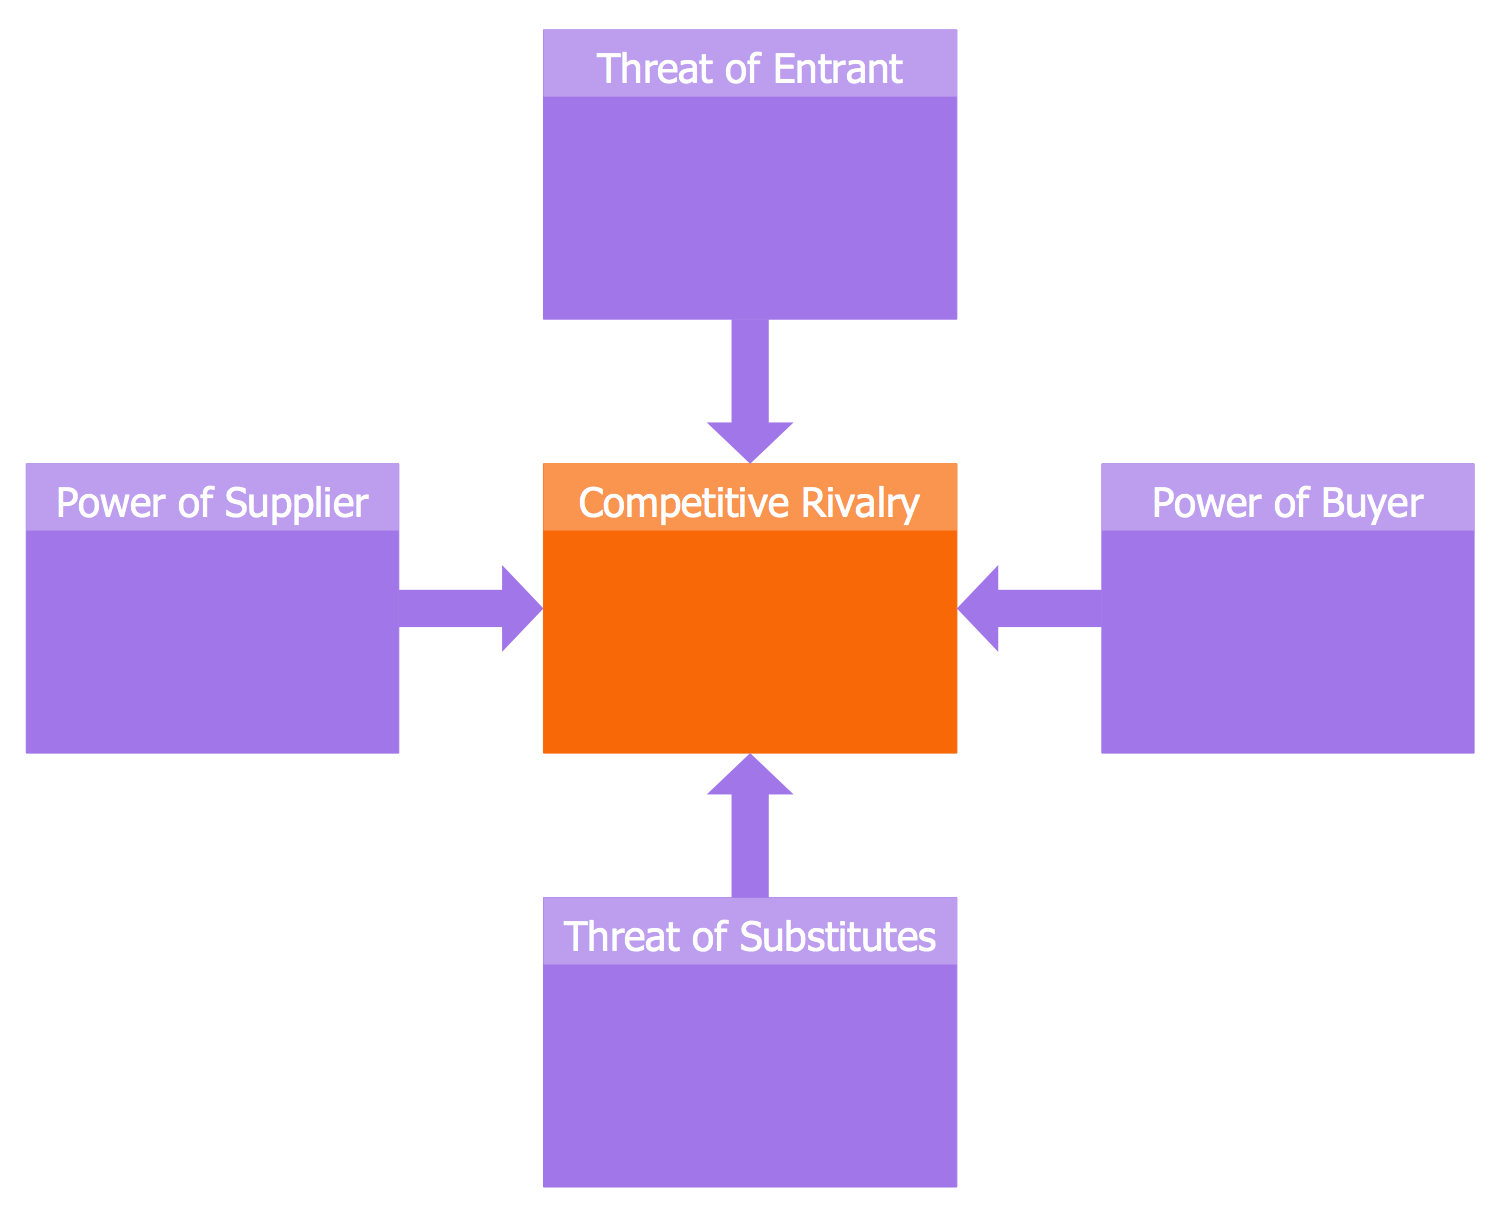
Example 3: Marketing Diagram — Five Forces Model
This diagram was created in ConceptDraw DIAGRAM using the "Marketing Diagrams" library from the Marketing Diagrams Solution. An experienced user spent 10 minutes creating this sample.
This sample represents the graphical view of the Porter's Five Forces Model that is the canon for modern business strategy development and industry analysis. It is named so in honor of economist Michael E. Porter, who developed and published it in his "Competitive strategy" book in 1979. The competition is an accumulation of the main forces influencing the company's economic viability. The essence of the Porter's theory is a differentiation of competitive forces and analysis of individual indicators. Porter's five forces model identifies five key factors crucial for a competition in the industry, these are: Power of supplier, Threat of Entrant, Power of buyer, Threat of Substitutes, and Competitive Rivalry. Three of them are the factors from the horizontal competition and two forces are from vertical competition. All these factors you can observe on a given diagram. It’s very useful and convenient to design different Marketing diagrams using the predesigned objects from the ConceptDraw DIAGRAM solutions libraries.

Example 4: Marketing Diagram — Leaky Bucket
This diagram was created in ConceptDraw DIAGRAM using the "Marketing Diagrams" library from the Marketing Diagrams Solution. An experienced user spent 5 minutes creating this sample.
This sample shows the Leaky Bucket Algorithm that is widely used in the field of packet-switched computer networks and telecommunications networks. This one and other professional looking diagrams, created in ConceptDraw DIAGRAM can be used at the presentations, conferences, and various publications. They attract attention and are easy to remember. As for the leaky bucket theory, it is a simple model that is used to describe the process of gaining and losing clients. This theory assists in definition the customer attrition rates and in making customer attrition analysis. One of the key terms of relationship marketing and the main goal of each market and each company is retention of existing customers and attraction of new ones, at this it is well known that retaining of existing customer is easier and less expensive that acquiring the new. But there are also those companies, which vice versa are concentrated on the involvement new customers.

Example 5: Marketing Diagram — Opportunities in Agro and Food Processing
This diagram was created in ConceptDraw DIAGRAM using the "Marketing Diagrams" library from the Marketing Diagrams Solution. An experienced user spent 10 minutes creating this sample.
This diagram sample created on the base of webpage from the Invest Punjab website. India has highly advanced agriculture and is one of the largest producers of milk, fruits, coconuts and cashew nuts, pulses, tea, and food grain production in a world. This diagram illustrates opportunities and the main steps in agriculture and food processing in India's Punjab. Agriculture and agri-food manufacturing are developed from the ancient times, but the modern opportunities and trends gave even greater development for these areas. Agro industry covers a wide range of activities with utilization of farm, animal and forestry based products as raw materials for manufacturing different products. This Step diagram is composed from the ready-to-use step chart blocks offered by the Marketing Diagrams library. So, you can see four steps on this diagram: Agriculture, Processing, Supply Chain, and Sales, under which is listed the corresponding detailed information. Moreover, all steps are brightly highlighted with red, but if you need, you can change accents according to your taste.

Example 6: Balanced Scorecard Strategy Map
This diagram was created in ConceptDraw DIAGRAM using the "Marketing Diagrams" library from the Marketing Diagrams Solution. An experienced user spent 10 minutes creating this sample.
This sample shows the Balanced scorecard strategy map. It is a good example of Strategy map, which is a type of diagram used to document in a visual view the primary strategic goals that are pursued by an organization or a management team. They are commonly-used elements of documentation associated with the balanced scorecard. The Strategy map usually has a simple view, includes less than 20 objectives, which are represented as ovals on the map and arrayed across two or more horizontal bands representing the perspectives, and finally the objectives are connected with arrows that depict the causal relationships. The ConceptDraw DIAGRAM software gives you a freedom of choice – you can design your Strategy map in a strict or free form, you can differ the color filling or color intensity of map’s elements according to your taste or documentation design requirements, and finally you can resize the elements without loss of quality by slightly movement.

Example 7: Cloud Testing Steps Chart
This diagram was created in ConceptDraw DIAGRAM using the "Marketing Diagrams" library from the Marketing Diagrams Solution. An experienced user spent 10 minutes creating this sample.
This Step Chart sample demonstrates the steps required in cloud testing. The cloud testing is a form of testing software, when web applications use the cloud infrastructure or cloud computing environment to simulate a real-world user traffic. The cloud testing is the best tool to solve variety of problems associated with testing in conditions of the limited budget and high costs per testing, great quantity of test cases, defined terms, and extensive geographical distribution of users. The cloud testing lets reduce the execution time of testing that is especially important for the large applications, it is a cost-effective solution and offers the quick availability of infrastructure with the scalability, effective unlimited storage, the flexibility and availability of a distributed testing environment. This simple diagram was extremely easy for creation in ConceptDraw DIAGRAM thanks to the offered “Step diagram block” library object. Using it you can design the similar diagrams with anyone quantity of elements and color them arbitrarily, making desired accents.

Example 8: Freeway Management Programs
This diagram was created in ConceptDraw DIAGRAM using the "Marketing Diagrams" library from the Marketing Diagrams Solution. An experienced user spent 10 minutes creating this sample.
This Marketing diagram example represents the Puzzle diagram. It was redesigned from the "Ramp Management and Control" webpage of US Department of Transportation Federal Highway Administration website. The central Ramp Management puzzle object is surrounded with five puzzles: HOV treatments, Information dissemination, Ramp management, Surveillance and incident detection, Incident management, Lane use control. The ramp management is the application of varied control devices, such as the traffic signals, gates, signing to control and to regulate the quantity of vehicles entering and leaving a freeway, with a goal of observance the operational objectives. There are generally accepted four strategies of managing the ramp-based traffic: ramp metering, ramp closure, special use treatments, and ramp terminal treatments. Using the ConceptDraw's puzzle elements of different forms you can compose varied variants of Puzzle combinations. The puzzle pieces exactly match one to another, you need only choose desired ones, drag to your document and dock them.

Example 9: Marketing Diagram — Image Chart
This diagram was created in ConceptDraw DIAGRAM using the "Marketing Diagrams" library from the Marketing Diagrams Solution. An experienced user spent 10 minutes creating this sample.
This sample is a perfect example of Marketing Image Chart, which reflects the total financing of Philippines at the period from 2001 to 2010. The group of Image Charts can be allocated among various types of diagrams. Usually these are attractive and bright charts reflecting the data and information in a visual way, and replete by colorful objects and images. The Philippines' economy is one of the largest and actively emerging markets in a world; according to the common rating of International Monetary Fund in 2012, it was on the 40th place. It is a newly industrialized country, which relatively recently passed from the simple agriculture to the agriculture based on the services and manufacturing. According to this graph, the values differ from the year to year, the minimum is observed in 2007 and maximum in 2010. You can use the ConceptDraw DIAGRAM software to design the similar diagrams for any other country in minutes.

Example 10: Ladder of Customer Loyalty Diagram
This diagram was created in ConceptDraw DIAGRAM using the "Marketing Diagrams" library from the Marketing Diagrams Solution. An experienced user spent 10 minutes creating this sample.
This Marketing diagram shows the relationship ladder of customer loyalty. Made with help of ready vector object from the Marketing Diagrams library, it represents the following groups of customers formed according to the level of loyalty: Prospect (a human that going to buy a product, but have not purchased it), Customer, Client, Supporter, Advocate, and Partner. The relationship marketing is an actively developed form of marketing defined as a direct response marketing campaign focused on the customer retention and satisfaction instead the dominant focus on sales transactions, i.e. relationship marketing supports the value of long term relationships with customers, which are usually decisive factor of competitiveness. It extends the communication far outside the obsessive promotional messages and seeks to establish tight economic, technical and social relationships with partners, which let to increase the values of commercial activity on the market, to decrease the transaction costs and to save the enterprise resources.

Example 11: Marketing Mix Diagram
This diagram was created in ConceptDraw DIAGRAM using the "Marketing Diagrams" library from the Marketing Diagrams Solution. An experienced user spent 10 minutes creating this sample.
This sample shows the Marketing Mix diagram that was designed in minutes with help of extensive set of ConceptDraw DIAGRAM drawing tools. The Marketing Mix is a basic marketing model and well-known business tool actively used in marketing field. It is associated with four P's, such as price, product, promotion, and place. Marketing mix is successfully used to describe the product's strategic position on the market and often has a crucial value when choosing some product or brand's offer. Any company on the market can use the Marketing Mix model as an integral part of its marketing strategy to implement the overall corporate strategy. Having the possibility to correct regularly the composition of its 4P categories, the company is able actively develop and flexibly respond to the changing needs of customers from the specific market segment and other stakeholders operating in the marketing environment. This diagram is detailed version of Marketing Mix concept.

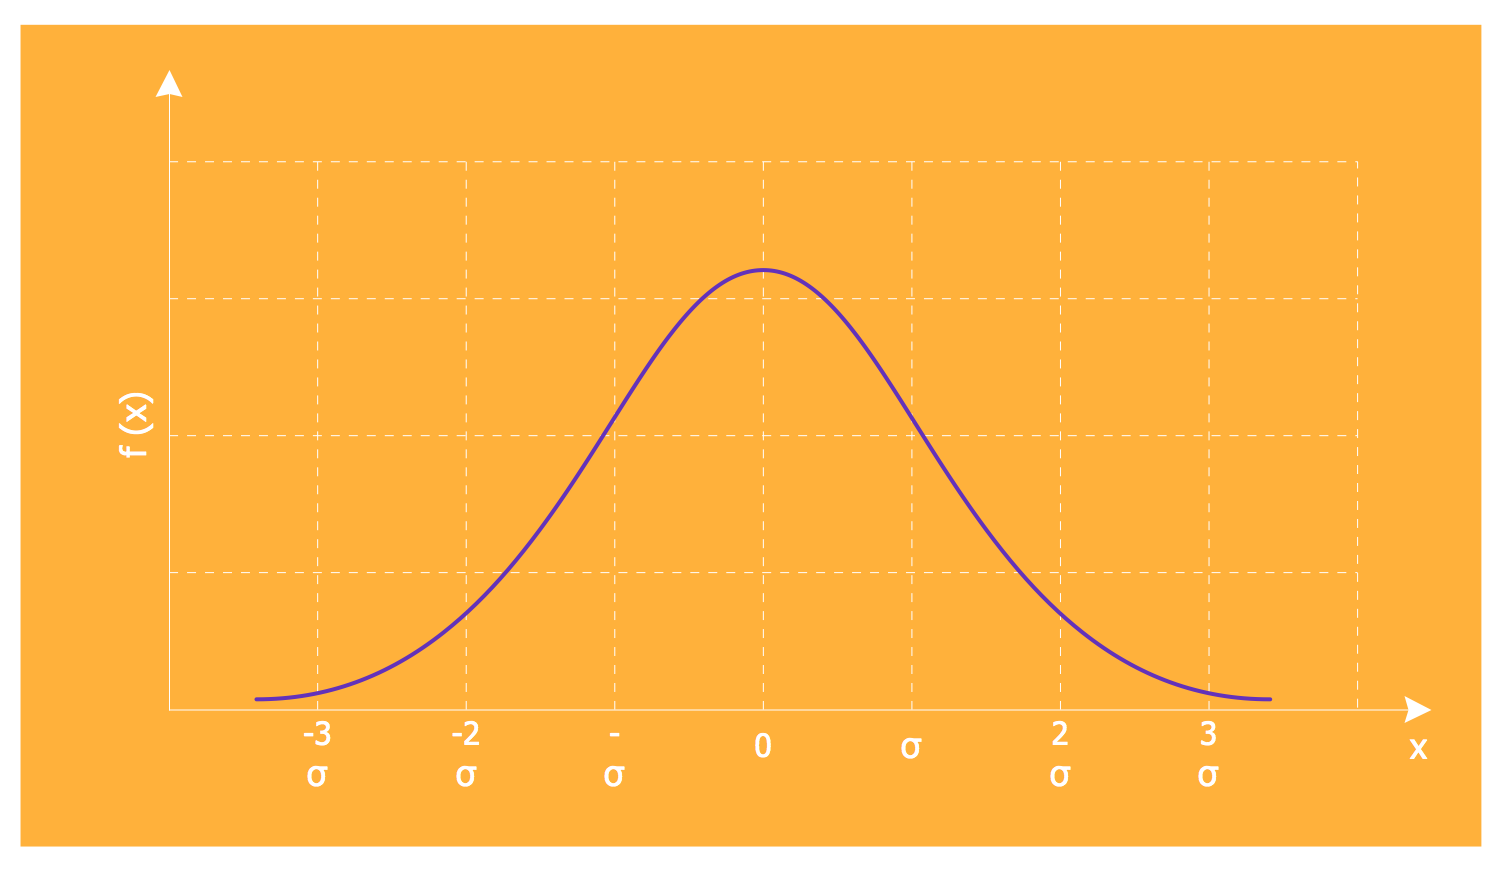
Example 12: Normal Gaussian Distribution Graph
This diagram was created in ConceptDraw DIAGRAM using the "Marketing Diagrams" library from the Marketing Diagrams Solution. An experienced user spent 10 minutes creating this sample.
This Marketing diagram sample shows the graph of univariate normal or Gaussian distribution that is the most common type of distribution. In 1733, it was first discovered by Moivre. Sometimes, this graph is called a bell curve. The Gaussian distribution plays important role in data analysis, in analysis of measurement errors, at the control of technological processes and regimes, in analysis and forecasting of different phenomena in the probability theory, mathematical statistics, statistical physics, biology, medicine, and other areas of knowledge. If the result of some observation is the sum of many weakly interdependent random variables, each of which makes a small contribution relatively to the total amount, then increasing the number of components, the distribution of centered and normalized result will tend to the normal. The main feature of the normal distribution is that it is limiting, to which approximate other distributions, and only continuous random variables comply with him.

Example 13: Process Chart
This diagram was created in ConceptDraw DIAGRAM using the "Marketing Diagrams" library from the Marketing Diagrams Solution. An experienced user spent 10 minutes creating this sample.
This Process Chart sample shows the Contracting process line. The contract administration or the contract management is a process of systematical and efficient management the contracts, which are made with all variety of stakeholders, such as customers, vendors, partners, employees, on all stages from the planning, creation, execution, and also analysis with purpose of minimization risks and maximization financial and operational performance. The contract management process includes the negotiation and approval of the contracts' terms and conditions, the documenting of the terms and conditions, and ensuring their compliance, as well as correction of any changes and modifications, and making additions that may appear during the contract implementation or execution. On this ConceptDraw diagram at the chain of steps are allocated three stages and highlighted with different colors: Acquisition Planning, Source Selection, and Contract Administration. It is effective to use a way of a visual differentiation the information with some favorite colors.

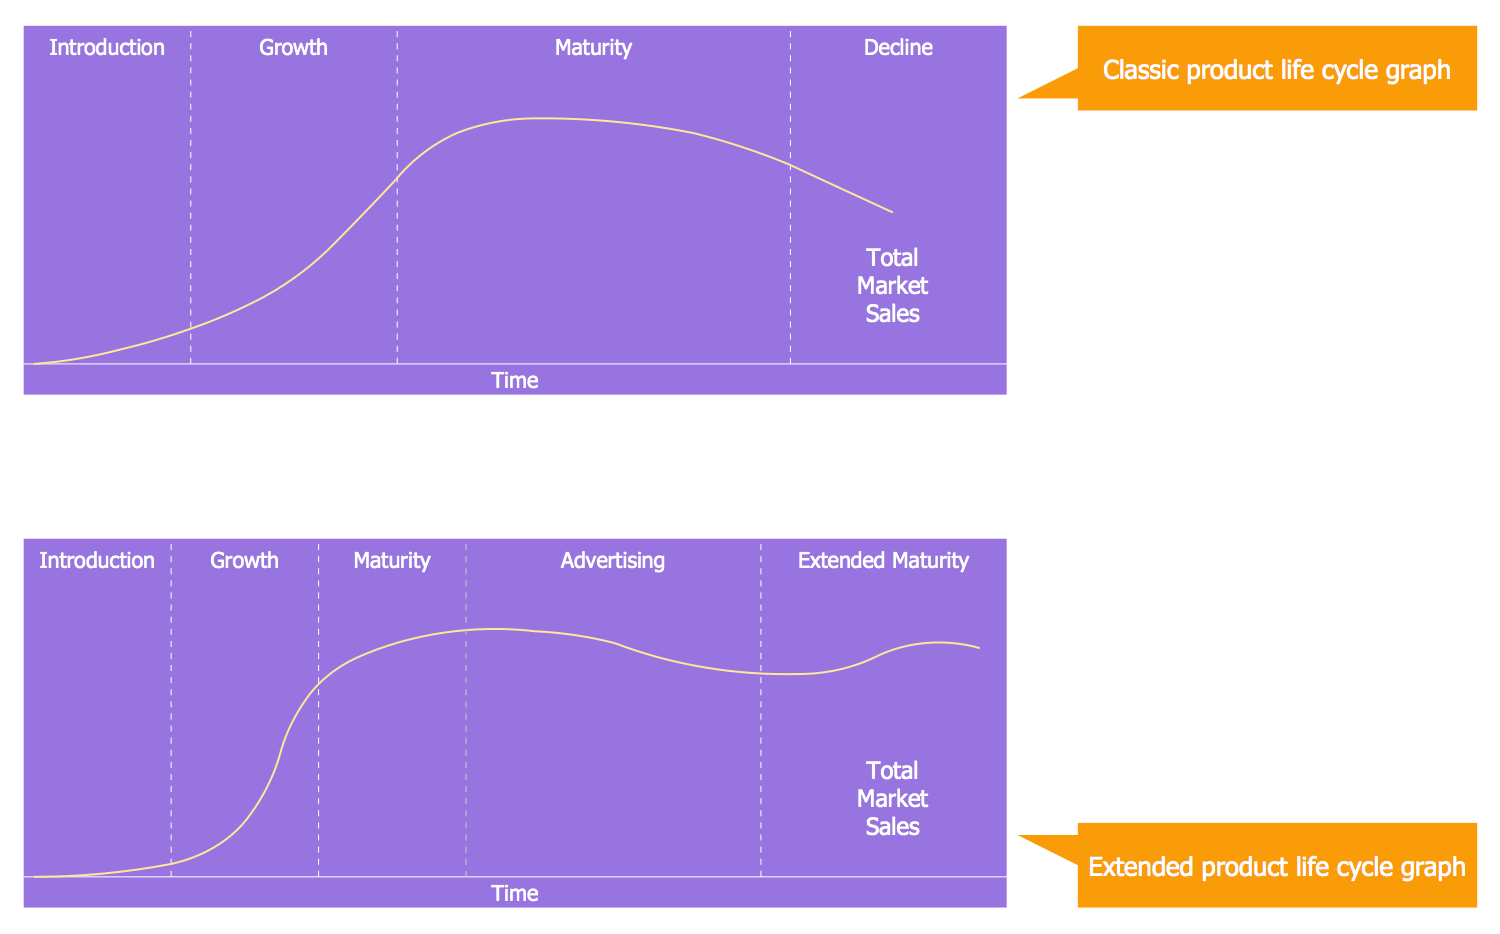
Example 14: Product Life Cycle Graph
This diagram was created in ConceptDraw DIAGRAM using the "Marketing Diagrams" library from the Marketing Diagrams Solution. An experienced user spent 10 minutes creating this sample.
This Marketing diagram example illustrates the Product Life Cycle Graph. The Product life cycle (PLC) is one of the fundamental marketing terms. It is a business analysis with a goal of definition the set of common stages at the life of different commercial products. It is visualized on paper or at the electronic form on computer screen with help of graph or a curve that depicts the progress of a new product and the product's life duration via the sequence of four stages, among which are the introduction, growth, maturity, and decline. This sequence of stages of a product's life cycle is directly connected with changes in marketing situation, which influence on the marketing strategy and marketing mix. The graphs are often much useful than strict numbers, it is enough one glance on the graph to see the product life cycle development, the progress or decline, the product revenue and profits, and other information.

Example 15: Purchase Funnel
This diagram was created in ConceptDraw DIAGRAM using the "Marketing Diagrams" library from the Marketing Diagrams Solution. An experienced user spent 10 minutes creating this sample.
This Marketing sample represents the Funnel diagram, which contains 5 stages of a purchase funnel: Awareness, Opinion, Consideration, Preference, Purchase. The general definition says that the purchase funnel is a marketing model focused on the consumer and illustrating the customer's way from the proposition towards the purchase of some product or service. This term is popular and has a lot of synonyms: purchasing funnel, customer funnel, sales funnel, sales pipeline, marketing funnel, or conversion funnel. It is actively used in marketing and customer relationship management, in guiding the promotional, management and marketing campaigns. In conditions of large offer the different types of products on the modern market and high competition, it is often quite difficult to attract the customers. In this situation can help a correctly constructed purchase funnel, which assists the businesses in efficient work, increasing sales and profits of commercial projects, and sufficiently effective influencing on potential customers.

Example 16: Puzzle Piece Diagram Alternating Sign Matrix
This diagram was created in ConceptDraw DIAGRAM using the "Marketing Diagrams" library from the Marketing Diagrams Solution. An experienced user spent 10 minutes creating this sample.
A variety of kinds of Marketing charts amazes by its abundance. This sample shows one of the most extraordinary diagram types - a Puzzle Piece Diagram for an Alternating Sign Matrix. The alternating sign matrices generalize the permutation matrices. The first defined by David Robbins, William Mills and Howard Rumsey, the Alternating Sign Matrices are the square matrices of 0s, 1s, and c1s, at this the sum of each row and column equals 1 and the values differing from 0 in each row and column alternate in sign. This sample is composed from the puzzle pieces, which are fully editable, you can change some of them on another ones, rearrange, resize, or recolor them to construct your own models and informative diagrams in a form of Puzzle charts. At the same time, this sample can be used as is and without changes paste at your documents, presentation slides, reports, etc.

Example 17: Service Goods Continuum Diagram
This diagram was created in ConceptDraw DIAGRAM using the "Marketing Diagrams" library from the Marketing Diagrams Solution. An experienced user spent 10 minutes creating this sample.
This Marketing diagram sample demonstrates the service-goods continuum. At the left endpoint is placed the pure commodity good and pure service at the other side. However, division of consumables into the physical goods and services is not always correct. There are many companies at the market, which provide exclusively services and there are also other enterprises, which deliver for consumers only the physical goods. But at the same time, there is large quantity of products situated between these two extremes. For example, if we will talk about cafes, restaurants, shopping malls, kids entertainment centers, and many other similar places, you can observe that together with physical goods, such as prepared food or any other goods, you receive also comfortable atmosphere, cleanliness, heat, Wi-Fi, and many other automatically included services, and vice versa. Thus, these two categories are often closely intertwined between each other. Usually the goods can be returned, while delivered services cannot.

Example 18: Value Chain Analysis Diagram
This diagram was created in ConceptDraw DIAGRAM using the "Marketing Diagrams" library from the Marketing Diagrams Solution. An experienced user spent 10 minutes creating this sample.
This sample illustrates the value chain analysis with help of Value chain analysis diagram. It is a typical value chain of agricultural commodities. At the beginning of millennium the specialists at the field of agricultural development, especially in developing countries, was interested in creation the powerful and useful tools. Just then, they were developed a special agricultural value chain concept, which describes all range of goods and services required for movement the agricultural products from the farm to the final consumers. Value chain analysis can be applied at the different fields of activity, it helps the companies to improve profits by creating such products or services, which are profitable, i.e. the profits from their sale are much larger than the costs of their production. Provide easily the value chain analysis, realize the value chain improvement and make Value Chain Analysis Diagrams in ConceptDraw DIAGRAM to increase significantly your company's competitive advantage and high incomes.

Example 19: Value Chain Step Chart
This diagram was created in ConceptDraw DIAGRAM using the "Marketing Diagrams" library from the Marketing Diagrams Solution. An experienced user spent 10 minutes creating this sample.
This Step chart sample represents the engineering value chain (EVC) that is the tool of strategic analysis, focused on the detailed studying the organization's activity and potential sources providing the greatest value to consumers with purpose of strategic planning and identification the synergism effects. The idea of a value chain was first suggested by Michael Porter to identify the sources of competitive advantage. A value chain includes as the chain elements all activities of an organization, aimed at the creation the value for consumers. On this chart, you can see the classic model of organization these activities, which includes the following five steps: idea generation and selection, design and development, production and delivery, service and support, disposal and recycling. All these listed steps are represented one after another on the offered diagram using the predesigned ConceptDraw's vector step blocks from the Marketing Diagrams solution libraries. For additional visuality, each step block is colored inimitably.

More Examples and Templates:
Inside

What I Need to Get Started
Both ConceptDraw DIAGRAM diagramming and drawing software and the Marketing Diagrams solution can help creating the marketing and sales communication diagrams you need. The Marketing Diagrams solution can be found in the Marketing area of ConceptDraw STORE application that can be downloaded from this site. Make sure that both ConceptDraw DIAGRAM and ConceptDraw STORE applications are installed on your computer before you get started.
How to install
After ConceptDraw STORE and ConceptDraw DIAGRAM are downloaded and installed, you can install the Marketing Diagrams solution from the ConceptDraw STORE.

Start Using
To make sure that you are doing it all right, use the pre-designed symbols from the stencil libraries from the solution to make your drawings look smart and professional. Also, the pre-made examples from this solution can be used as drafts so your own drawings can be based on them. Using the samples, you can always change their structures, colors and data.
