- Electric and Telecom Plans Free
- Fire and Emergency Plans Free
- Floor Plans Free
- Plant Layout Plans Free
- School and Training Plans Free
- Seating Plans Free
- Security and Access Plans Free
- Site Plans Free
- Sport Field Plans Free
- Business Process Diagrams Free
- Business Process Mapping Free
- Classic Business Process Modeling Free
- Cross-Functional Flowcharts Free
- Event-driven Process Chain Diagrams Free
- IDEF Business Process Diagrams Free
- Logistics Flow Charts Free
- Workflow Diagrams Free
- ConceptDraw Dashboard for Facebook Free
- Mind Map Exchange Free
- MindTweet Free
- Note Exchange Free
- Project Exchange Free
- Social Media Response Free
- Active Directory Diagrams Free
- AWS Architecture Diagrams Free
- Azure Architecture Free
- Cisco Network Diagrams Free
- Cisco Networking Free
- Cloud Computing Diagrams Free
- Computer Network Diagrams Free
- Google Cloud Platform Free
- Interactive Voice Response Diagrams Free
- Network Layout Floor Plans Free
- Network Security Diagrams Free
- Rack Diagrams Free
- Telecommunication Network Diagrams Free
- Vehicular Networking Free
- Wireless Networks Free
- Comparison Dashboard Free
- Composition Dashboard Free
- Correlation Dashboard Free
- Frequency Distribution Dashboard Free
- Meter Dashboard Free
- Spatial Dashboard Free
- Status Dashboard Free
- Time Series Dashboard Free
- Basic Circle-Spoke Diagrams Free
- Basic Circular Arrows Diagrams Free
- Basic Venn Diagrams Free
- Block Diagrams Free
- Concept Maps Free
- Family Tree Free
- Flowcharts Free
- Basic Area Charts Free
- Basic Bar Graphs Free
- Basic Divided Bar Diagrams Free
- Basic Histograms Free
- Basic Line Graphs Free
- Basic Picture Graphs Free
- Basic Pie Charts Free
- Basic Scatter Diagrams Free
- Aerospace and Transport Free
- Artwork Free
- Audio, Video, Media Free
- Business and Finance Free
- Computers and Communications Free
- Holiday Free
- Manufacturing and Maintenance Free
- Nature Free
- People Free
- Presentation Clipart Free
- Safety and Security Free
- Analog Electronics Free
- Audio and Video Connectors Free
- Basic Circuit Diagrams Free
- Chemical and Process Engineering Free
- Digital Electronics Free
- Electrical Engineering Free
- Electron Tube Circuits Free
- Electronic Block Diagrams Free
- Fault Tree Analysis Diagrams Free
- GHS Hazard Pictograms Free
- Home Automation and Wiring Free
- Mechanical Engineering Free
- One-line Diagrams Free
- Power Сircuits Free
- Specification and Description Language (SDL) Free
- Telecom and AV Circuits Free
- Transport Hazard Pictograms Free
- Data-driven Infographics Free
- Pictorial Infographics Free
- Spatial Infographics Free
- Typography Infographics Free
- Calendars Free
- Decision Making Free
- Enterprise Architecture Diagrams Free
- Fishbone Diagrams Free
- Organizational Charts Free
- Plan-Do-Check-Act (PDCA) Free
- Seven Management and Planning Tools Free
- SWOT and TOWS Matrix Diagrams Free
- Timeline Diagrams Free
- Australia Map Free
- Continent Maps Free
- Directional Maps Free
- Germany Map Free
- Metro Map Free
- UK Map Free
- USA Maps Free
- Customer Journey Mapping Free
- Marketing Diagrams Free
- Matrices Free
- Pyramid Diagrams Free
- Sales Dashboard Free
- Sales Flowcharts Free
- Target and Circular Diagrams Free
- Cash Flow Reports Free
- Current Activities Reports Free
- Custom Excel Report Free
- Knowledge Reports Free
- MINDMAP Reports Free
- Overview Reports Free
- PM Agile Free
- PM Dashboards Free
- PM Docs Free
- PM Easy Free
- PM Meetings Free
- PM Planning Free
- PM Presentations Free
- PM Response Free
- Resource Usage Reports Free
- Visual Reports Free
- House of Quality Free
- Quality Mind Map Free
- Total Quality Management TQM Diagrams Free
- Value Stream Mapping Free
- Astronomy Free
- Biology Free
- Chemistry Free
- Language Learning Free
- Mathematics Free
- Physics Free
- Piano Sheet Music Free
- Android User Interface Free
- Class Hierarchy Tree Free
- Data Flow Diagrams (DFD) Free
- DOM Tree Free
- Entity-Relationship Diagram (ERD) Free
- EXPRESS-G data Modeling Diagram Free
- IDEF0 Diagrams Free
- iPhone User Interface Free
- Jackson Structured Programming (JSP) Diagrams Free
- macOS User Interface Free
- Object-Role Modeling (ORM) Diagrams Free
- Rapid UML Free
- SYSML Free
- Website Wireframe Free
- Windows 10 User Interface Free
Business Process Mapping
Business process mapping is the process that can be referred to the activities involved in defining what exactly some business entity does. It can also help to answer the questions who is responsible for the business entities to do their job, to what standard some particular business process should be completed and in what way the success of a business process can be eventually determined.
The main reason for using the business process mapping is to assist those organizations that need the support in order to become more effective. A detailed and clear business process diagram, is what can allow the outside firms to see whether or not the needed improvements can be made to the current process.
Business process mapping may take some particular objective, help measure and compare it alongside the entire organization's objectives. It can be done in order to make sure that all of the processes are aligned with the company's both capabilities and values.
Many graphical descriptions of processes are stated to be useful by most of the quality improvement practitioners as they include the detailed flowcharts, work flow diagrams and value stream maps that can be created in the ConceptDraw DIAGRAM diagramming and drawing software.
Each of the maps can be very useful for achieving the necessary goals. But how useful this may be depends on the issues of the process, and also on theories that should also be considered. In such situations, a process map may involve the use of a process flow and a current understanding of the entire causal structure.
Business process maps can help evaluate and manage the required quality in the workflow chain, focusing on both corporate optimization and performance.
Using the Business Process Mapping solution, which can be applied while working in ConceptDraw DIAGRAM business mapping software, its users can create an effective Business process map, SIPOC diagram, Swim lanes flowchart and, thus, clearly define the necessary business processes due to their inputs and outputs.
The Business Process Mapping solution has a collection of vector graphic libraries, pre-made templates, and examples of the business process maps. They are useful for by many business specialists including economists, politicians, analysts, and other economic experts, officials and state managers for making the unique and professionally looking drawings.
-
Install this solution Free -
What I need to get started -
Solution Requirements - This solution requires the following products to be installed:
ConceptDraw DIAGRAM v18 - This solution requires the following products to be installed:
-
Compatibility - Sonoma (14), Sonoma (15)
MS Windows 10, 11 - Sonoma (14), Sonoma (15)
-
Support for this Solution -
Helpdesk
There are 3 libraries containing 53 objects in the Business Process Mapping solution.
Design Elements — Business Process Flowcharts

Design Elements — SIPOC Diagrams

Design Elements — Swim Lanes

Business Process Mapping Examples
There are a few samples that you see on this page which were created in the ConceptDraw DIAGRAM application by using the Business Process Mapping solution. Some of the solution's capabilities as well as the professional results which you can achieve are all demonstrated here on this page.
All source documents are vector graphic documents which are always available for modifying, reviewing and/or converting to many different formats, such as MS PowerPoint, PDF file, MS Visio, and many other graphic ones from the ConceptDraw Solution Park or ConceptDraw STORE. The Business Process Mapping solution is available to all ConceptDraw DIAGRAM users to get installed and used while working in the ConceptDraw DIAGRAM diagramming and drawing software.
SIPOC Diagram Template
This SIPOC diagram template is a perfect base for business process mapping with ConceptDraw DIAGRAM diagramming and business graphics software, for drawing professional-looking SIPOC diagrams or SIPOC matrices that summarize the inputs and outputs of one or more processes in a visual table form. Select this ready-made template from the Business Process Mapping solution and simply fill it with your data and information. Select the first field and list all suppliers of the process, list the inputs at the second field, then write out the high-level process, at this to draw the process flow using the elements from the Business process flowcharts library. Finally, list all outputs to the process and all customers of the defined process. You can drag the control handles to change the width and title height of the items. Each column is colored by its own color that is a visual way to additionally differentiate the information.

Example 1: Alternative Dispute Resolution Process SIPOC Diagram
This diagram was created in ConceptDraw DIAGRAM using the SIPOC Diagrams library from the Business Process Mapping solution. An experienced user spent 15 minutes creating this sample.
This example represents the SIPOC diagram created on the base of the Alternative Dispute Resolution Process SIPOC Diagram published on the Minnesota.gov portal. The abbreviation SIPOC is composed of the first letters of Supplier, Input, Process, Output, Customer that are represented by separate columns in the diagram. The SIPOC diagrams represent a high-level overview of a process and highlight the importance of each factor in a process, no matter it is internal or external. This diagram shows a comprehensive list of the suppliers, inputs, requirements, outputs, processes, and customers involved in a described business process. The main steps you need to complete when making a SIPOC diagram are the following: identify the customer, describe the products or services it requires, make a brief description of the process and identify beginning and ending steps of the process, specify the main inputs of the process, and provide a list of key suppliers. It's convenient to make this diagram having the ready vector stencils at the solution's SIPOC Diagrams library.

Example 2: Business Process Swim Lane Flowchart — Approvals
This diagram was created in ConceptDraw DIAGRAM using the Swim Lanes library from the Business Process Mapping solution. An experienced user spent 15 minutes creating this sample.
This sample is a swimlane flowchart redesigned from the "Approvals.svg" Wikimedia Commons file using the powerful tools and vector shapes from the libraries of ConceptDraw's Business Process Mapping solution. The swimlane diagram represents a specific method for grouping a business process into particular divisions. The parallel vertical lines divide the chart into the lanes, each of them corresponds to the specific subprocess, person, or group. You can see the lanes' names at the top of the diagram. In this diagram, these are the Customers, Sales, Contracts, Legal, and Fulfilment. Moreover, they are highlighted with different colors. You can see that all processes and decisions are visually grouped and placed into these lanes, thus the flowchart designed according to the common rules is placed at these flowchart's swim lanes. This specificity distinguishes swimlane flowcharts from other kinds of flowcharts. By fitting a flowchart into this system, you are able to clearly define all possible process decisions and outcomes.

Example 3: Contracting Process Line
This diagram was created in ConceptDraw DIAGRAM using the Business Process Flowcharts library from the Business Process Mapping solution. An experienced user spent 10 minutes creating this sample.
This business process flowchart example is based on the Wikimedia Commons file "Contracting Process Line.jpg". The contracting process line is a good example of a linear process map. A diagram like the offered one can be used for a simple and repeatable process. The business process mapping is an activity related to the definition in what processes the business entity is involved, who is responsible, to what standard the business process refers, when it should be completed, and how the business process success can be determined. It assists in measuring and analyzing the processes realized within a company to make sure that they all are coordinated with values and capabilities of the specific company and correspond to the main organization's objectives. The business process maps are created with a goal to help organizations to become more efficient and successful. The ways to improve the current process can be easily found when having ready the business process diagram, flowchart or map created in a business mapping software.

Example 4: Distribution Flowchart Example
This diagram was created in ConceptDraw DIAGRAM using the Business Process Flowcharts library from the Business Process Mapping solution. An experienced user spent 10 minutes creating this sample.
This business process flowchart example illustrates the distribution process within Indian Shri Mahila Griha Udyog Lijjat Papad. It was redesigned from the "SMGULP-distribution-flowchart.png" Wikimedia Commons file by means of Business Process Mapping solution from the ConceptDraw Solution Park. The Shri Mahila Griha Udyog Lijjat Papad (abbr. SMGULP) is an Indian women's cooperative occupied by the manufacturing of various fast moving consumer goods. A business process map can define not only the internal processes of an organization. This flowchart shows an example of external inputs that are necessary to start a process and at the same time depicts how the business delivers its outputs worldwide. At the top of the flowchart the Head Office is placed that procures the raw materials, two flows outgoing from it are Vashi and Nashik, and Cotton Green. Then step-by-step you can observe the whole process of distributing goods to retail outlets within India and to other countries.

Example 5: Flowchart Example — Making Breakfast
This diagram was created in ConceptDraw DIAGRAM using the Business Process Flowcharts library from the Business Process Mapping solution. An experienced user spent 10 minutes creating this sample.
This process flowchart example is dedicated to the process of making breakfast and is based on the Wikimedia Commons file "Makebreakfast.gif". The making a great-cooked breakfast takes time and care. The use of ConceptDraw DIAGRAM lets you deconstruct any process into a series of inputs and outputs making it understandable for everyone. The needed ingredients are the inputs and the output is the final breakfast composing of several dishes ready to be served. The process is broken vertically and horizontally on the different tasks that need to be done. You can see that was planned to cook bacon, cook eggs, toast bread, and fry potatoes. These tasks can be then additionally broken down, thus to cook eggs one must first heat the pan, then pour the mixture, stir it, add pepper, and finally remove eggs from the pan. In this way, each process can be broken into smaller ones that makes them clear to be done with a perfect result. Just try not to get hungry while creating your diagram!

Example 6: Proposed Patient Appointment Procedure
This diagram was created in ConceptDraw DIAGRAM using the Business Process Flowcharts library from the Business Process Mapping solution. An experienced user spent 10 minutes creating this sample.
This business process flowchart example demonstrates the proposed patient appointment procedure. It was constructed on the base of the Wikimedia Commons file “Proposed Patient Appointment Procedure.png”. You can see that this procedure starts with the preparation of an appointment book, at the top of the flowchart the corresponding item is placed in the Start shape. First, the appointment book needs to be opened and you should decide it is shore or fleet. In the second case, you need to inform the patient that he can call 1500 to make own appointments for next working day, and vice versa if the appointment is shore, the patient is reminded to confirm 24 hours prior to appointment. Next, verify that the patient confirmed and give him a confirmation number, or otherwise, if the patient didn't call, you need to cancel an appointment. Obligatory confirm that the patient showed for the appointment and put “patient showed” in an appointment book. If not, mark “failure” and submit the failure report from the front desk to fleet liaison.

Example 7: SIPOC Diagram — Hiring Process
This diagram was created in ConceptDraw DIAGRAM using the Business Process Flowcharts library from the Business Process Mapping solution. An experienced user spent 10 minutes creating this sample.
This SIPOC Diagram example demonstrates the hiring process or the process of personnel recruitment that is the process of attracting, selecting and appointing the candidates for the vacant positions at a company or an organization. It was designed on the base of the SIPOC diagram "Hiring process" from the County of Milwaukee website. You can observe five hiring process steps. First, the hiring manager identifies the need in a completed requisition, then the HR makes posts about a job, tests the applicants, counts scores, and provides the list to the sources and hiring manager, who then interviews candidates and provides feedback. On the fourth step, the applicant is selected and the letter is offered, then it will be the employees' first day of employment. The offered SIPOC diagram represents five columns: Supplier (Who), Inputs (What), Process (Actions), Output/Results (Results/Desirables), and Customers (Receiver/User). The diagram items are accurately and visually allocated between these columns.

Example 8: Trade Study Process Flowchart
This diagram was created in ConceptDraw DIAGRAM using the Business Process Flowcharts library from the Business Process Mapping solution. An experienced user spent 10 minutes creating this sample.
This business process flowchart sample demonstrates the steps of the trade study process. It is based on the Wikimedia Commons file “Trade Study Process.jpg”. The flowchart is the most common type of diagrams, which lets schematically represent any process, algorithm, or the step-by-step solution of a problem. The proposed process of the trade study includes the following steps: establishing the study problem, reviewing inputs, then selecting and setting up the methodology, also identifying and selecting alternatives, measuring performance, analyzing results, and finally documenting process and results. Each step contains several items that need to be realized for the overall goal and is represented by its own rectangle, and all rectangles are consistently connected to each other by arrows. Choose a desirable color style when constructing your own flowchart in ConceptDraw DIAGRAM software. One of the most interesting, non-standard and attractive styles is white letters on the dark or bright background.

Example 9: Verification Tasks
This diagram was created in ConceptDraw DIAGRAM using the Business Process Flowcharts library from the Business Process Mapping solution. An experienced user spent 10 minutes creating this sample.
This business process flowchart example demonstrates the process of verification tasks that was redesigned from the “Verification Tasks.jpg” Wikimedia Commons file by means of ConceptDraw's Business Process Mapping solution tools. It is convenient to use the business process mapping to represent the steps of the business process, to clarify the execution of the processes, to improve the business processes, to detect the problems, bottlenecks, and the differences in execution a process by various people or groups. The business process flowchart is one of the components of Six Sigma process management. You can see that the process of verification begins with the synthesis and ends by the control. It supposes the physical verification, selecting the verification approach, defining, inspection, analysis, demo and testing requirements, defining verification procedures, establishing verification environment, conducting verification evaluation, verifying architectural completeness, functional and performance measures, the satisfaction of constraints, and many other steps visually depicted on this diagram.

Example 10: Wikimedia Development and Deployment Flowchart
This diagram was created in ConceptDraw DIAGRAM using the Business Process Flowcharts library from the Business Process Mapping solution. An experienced user spent 10 minutes creating this sample.
This example represents the business process flowchart dedicated to the development and deployment process in use by the Wikimedia Foundation in March 2014. It is based on the same-named file from the Wikimedia Commons “Wikimedia development and deployment flowchart.png”. A deployment flowchart is a kind of the business process mapping tool that is used to define the steps, stakeholders required to implement a specific process and relationships between them. The deployment flowcharts are also used to highlight areas of inefficiency, duplication or unnecessary processing. The Wikimedia development and deployment flowchart refers to the software and IT infrastructure deployment. Having the powerful ConceptDraw DIAGRAM software and specially developed tools of Business Process Mapping solution, you don't need to make huge efforts to design a deployment flowchart of any degree of detail. At this, the diagrams designed in ConceptDraw DIAGRAM have a great advantage — they are precise and easy understandable due to the use of common shapes and terminology.

Inside


What I Need to Get Started
Both ConceptDraw DIAGRAM diagramming and drawing software and the Business Process Mapping solution can help creating the business processes diagrams you need. The Business Process Mapping solution can be found in the Business Processes area of ConceptDraw STORE application that can be downloaded from this site. Make sure that both ConceptDraw DIAGRAM and ConceptDraw STORE applications are installed on your computer before you get started.
How to install
After ConceptDraw STORE and ConceptDraw DIAGRAM are downloaded and installed, you can install the Business Process Mapping solution from the ConceptDraw STORE.

Start using
To make sure that you are doing it all right, use the pre-designed symbols from the stencil libraries from the solution to make your drawings look smart and professional. Also, the pre-made examples from this solution can be used as drafts so your own drawings can be based on them. Using the samples, you can always change their structures, colors and data.

Business Process Mapping
We use the phrase business process to define a particular set of tasks or actions undertaken by an organization, that lead to the production of goods or services for the customer base. It's a flexible term — one that can be used to describe the most menial or idiosyncratic of assignments, or as a way of describing a company in its entirety.
Critical study of each facet of a process is imperative for maintaining high standards within a company, and to allow management to spot any flaws or inefficiencies in its day-to-day business. The most common way of condensing a process down into an organized format is to use a visual solution — one that allows each point to be represented clearly and succinctly, giving those that are unfamiliar with the process an unambiguous interpretation of events.
To support this visual style of quality management, a number of transferable methodologies have been developed — generic diagramming solutions that act as a framework around which unique and disparate processes can be formed. The collective term for this practice is business process mapping, and here follows a brief description of some of the more popular approaches to it.
- SIPOC Diagrams — SIPOC stands for suppliers, inputs, process, outputs, and customers, and it is a style of diagram that has a clear focus on the quality of what is going in, and what is being produced from a business process. It has a simple visual form, a segmented table that produces comprehensive lists for each category. With a SIPOC diagram, the start and end of a process is clearly defined, and the relationship between a company and its external suppliers is easily identified. SIPOC diagrams form a key part of the Six Sigma methodology, which are a set of techniques and tools to help improve quality output and minimize variability within repeated tasks.
A SIPOC diagram created with ConceptDraw DIAGRAM, showing all elements involved in hiring a candidate
- Business process flowcharts — A flowchart is the go-to tool for representing any basic process that involves a series of steps or decisions, particularly processes that are repeatable. Also known as a process flow diagram, these charts act as a solution model to a given problem, telling the user exactly which steps can be taken at what time, and the impact of choices made within the workflow. As with SIPOC diagrams, a flowchart can show the input and output of materials and services in terms of the customer, as well as being used to define processes from other areas of a company, such as management or human resources.
Flowcharts show repeated processes, like this sequence of doctor appointment procedure
- Swimlane diagrams — If a business process crosses over multiple departments, in can be easier to define using a flowchart that has been divided into distinct sections, or 'swimlanes'. These lanes distinguish which persons, groups, or location influence a particular step of the business process. They are useful for explicitly stating each stakeholders responsibility, and the actions each employee is expected to complete, before the process can continue to the next department. Other terms for these type of diagrams include 'deployment flowchart' and 'cross-functional flowchart'.
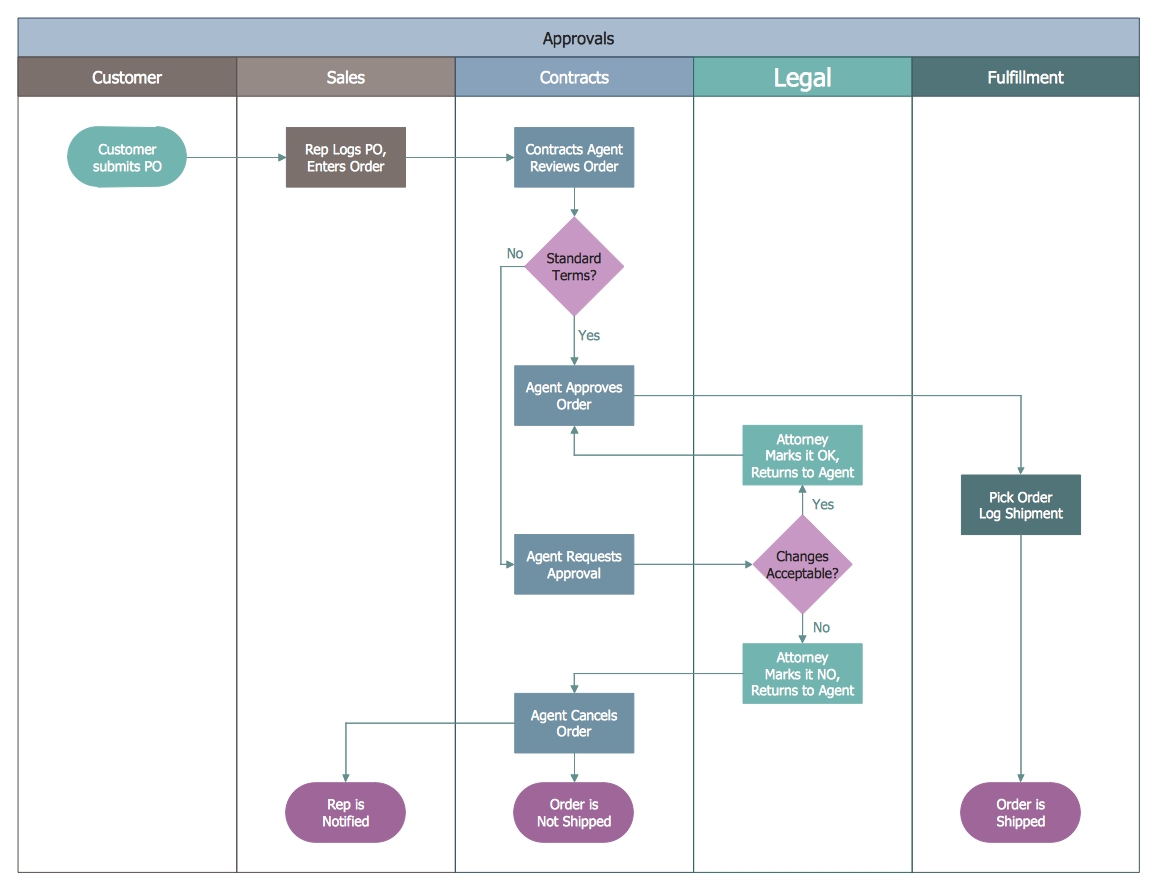
This swimlane diagram was created using ConceptDraw DIAGRAM, and shows the steps that each division is responsible for in a customer order
- IDEF3 — The IDEF business process modelling language is used in slightly more specific scenarios than the previous examples. IDEF3 in particular is a scenario-driven description capture method, that has the ability to define the state of the same system or process under a variety of conditions. While flowcharts can allow a certain amount of artistic license in their design, IDEF3 uses standardized process schematic symbols — a more complex and comprehensive set of icons than found in flowcharts, and more precise in their definition.
- Value stream mapping — A value stream map takes a wide look at the relationships between manufacturing, production control and shipping processes. They follow the value chain through an organization, from supply until it reaches the market. Like IDEF3, standardized notation is used to facilitate understanding between workers and workforces.
To achieve the professional standards required for these diagramming styles, it's best to use specialized drawing software, and a supply of the correct graphical notations. There are a number of software capable of this, but the only one that contains solutions for all the techniques listed above, extending and enhancing an already powerful diagramming platform, is ConceptDraw DIAGRAM. With the new Business Process Mapping solution, joining previous solutions such as IDEF Business Process Diagrams and Value Stream Mapping, ConceptDraw DIAGRAM offers a comprehensive selection of process mapping tools to aid quality management within an organization and help refine workflows.
To install this solution follow steps:
- Run ConceptDraw STORE app
- Open Solutions tab to display all the solutions
- Free solutions are indicated with Install button
- Select solution and Click Install