- Electric and Telecom Plans Free
- Fire and Emergency Plans Free
- Floor Plans Free
- Plant Layout Plans Free
- School and Training Plans Free
- Seating Plans Free
- Security and Access Plans Free
- Site Plans Free
- Sport Field Plans Free
- Business Process Diagrams Free
- Business Process Mapping Free
- Classic Business Process Modeling Free
- Cross-Functional Flowcharts Free
- Event-driven Process Chain Diagrams Free
- IDEF Business Process Diagrams Free
- Logistics Flow Charts Free
- Workflow Diagrams Free
- ConceptDraw Dashboard for Facebook Free
- Mind Map Exchange Free
- MindTweet Free
- Note Exchange Free
- Project Exchange Free
- Social Media Response Free
- Active Directory Diagrams Free
- AWS Architecture Diagrams Free
- Azure Architecture Free
- Cisco Network Diagrams Free
- Cisco Networking Free
- Cloud Computing Diagrams Free
- Computer Network Diagrams Free
- Google Cloud Platform Free
- Interactive Voice Response Diagrams Free
- Network Layout Floor Plans Free
- Network Security Diagrams Free
- Rack Diagrams Free
- Telecommunication Network Diagrams Free
- Vehicular Networking Free
- Wireless Networks Free
- Comparison Dashboard Free
- Composition Dashboard Free
- Correlation Dashboard Free
- Frequency Distribution Dashboard Free
- Meter Dashboard Free
- Spatial Dashboard Free
- Status Dashboard Free
- Time Series Dashboard Free
- Basic Circle-Spoke Diagrams Free
- Basic Circular Arrows Diagrams Free
- Basic Venn Diagrams Free
- Block Diagrams Free
- Concept Maps Free
- Family Tree Free
- Flowcharts Free
- Basic Area Charts Free
- Basic Bar Graphs Free
- Basic Divided Bar Diagrams Free
- Basic Histograms Free
- Basic Line Graphs Free
- Basic Picture Graphs Free
- Basic Pie Charts Free
- Basic Scatter Diagrams Free
- Aerospace and Transport Free
- Artwork Free
- Audio, Video, Media Free
- Business and Finance Free
- Computers and Communications Free
- Holiday Free
- Manufacturing and Maintenance Free
- Nature Free
- People Free
- Presentation Clipart Free
- Safety and Security Free
- Analog Electronics Free
- Audio and Video Connectors Free
- Basic Circuit Diagrams Free
- Chemical and Process Engineering Free
- Digital Electronics Free
- Electrical Engineering Free
- Electron Tube Circuits Free
- Electronic Block Diagrams Free
- Fault Tree Analysis Diagrams Free
- GHS Hazard Pictograms Free
- Home Automation and Wiring Free
- Mechanical Engineering Free
- One-line Diagrams Free
- Power Сircuits Free
- Specification and Description Language (SDL) Free
- Telecom and AV Circuits Free
- Transport Hazard Pictograms Free
- Data-driven Infographics Free
- Pictorial Infographics Free
- Spatial Infographics Free
- Typography Infographics Free
- Calendars Free
- Decision Making Free
- Enterprise Architecture Diagrams Free
- Fishbone Diagrams Free
- Organizational Charts Free
- Plan-Do-Check-Act (PDCA) Free
- Seven Management and Planning Tools Free
- SWOT and TOWS Matrix Diagrams Free
- Timeline Diagrams Free
- Australia Map Free
- Continent Maps Free
- Directional Maps Free
- Germany Map Free
- Metro Map Free
- UK Map Free
- USA Maps Free
- Customer Journey Mapping Free
- Marketing Diagrams Free
- Matrices Free
- Pyramid Diagrams Free
- Sales Dashboard Free
- Sales Flowcharts Free
- Target and Circular Diagrams Free
- Cash Flow Reports Free
- Current Activities Reports Free
- Custom Excel Report Free
- Knowledge Reports Free
- MINDMAP Reports Free
- Overview Reports Free
- PM Agile Free
- PM Dashboards Free
- PM Docs Free
- PM Easy Free
- PM Meetings Free
- PM Planning Free
- PM Presentations Free
- PM Response Free
- Resource Usage Reports Free
- Visual Reports Free
- House of Quality Free
- Quality Mind Map Free
- Total Quality Management TQM Diagrams Free
- Value Stream Mapping Free
- Astronomy Free
- Biology Free
- Chemistry Free
- Language Learning Free
- Mathematics Free
- Physics Free
- Piano Sheet Music Free
- Android User Interface Free
- Class Hierarchy Tree Free
- Data Flow Diagrams (DFD) Free
- DOM Tree Free
- Entity-Relationship Diagram (ERD) Free
- EXPRESS-G data Modeling Diagram Free
- IDEF0 Diagrams Free
- iPhone User Interface Free
- Jackson Structured Programming (JSP) Diagrams Free
- macOS User Interface Free
- Object-Role Modeling (ORM) Diagrams Free
- Rapid UML Free
- SYSML Free
- Website Wireframe Free
- Windows 10 User Interface Free
Concept Maps
Concept maps are a graphical tool used to visualize relationships that occur between different concepts and ideas. They have a philosophical basis and are often used to organize and present knowledge. Typically concept maps have a hierarchical structure, with a main concept or idea, and subordinate concepts or sub-topics connected to it by labelled arrows with linking phrases, such as "depends on", "due to", "gives rise to", "involves", "results in", "contributes to", "includes", "is required by", and others.
The technique of concept mapping was developed as a constructive way of representing knowledge in science and increasing the meaningfulness of learning. Now, the creation of a concept map is extremely helpful when used in education as learning and teaching techniques that assist memorization. Concept maps are also used for idea generation in brainstorming sessions, and for detailing the structure of complex ideas.
How does one make a concept map easily and quickly? The Concept Maps Solution represents a large collection of concept map samples, examples, and templates. Also included is a library of pre-drawn vector stencils that convert ConceptDraw DIAGRAM into a professional concept map maker. This capability makes it exceptionally effective for concept mapping.
-
Install this solution Free -
What I need to get started -
Solution Requirements - This solution requires the following products to be installed:
ConceptDraw DIAGRAM v18 - This solution requires the following products to be installed:
-
Compatibility - Sonoma (14), Sonoma (15)
MS Windows 10, 11 - Sonoma (14), Sonoma (15)
-
Support for this Solution -
Helpdesk
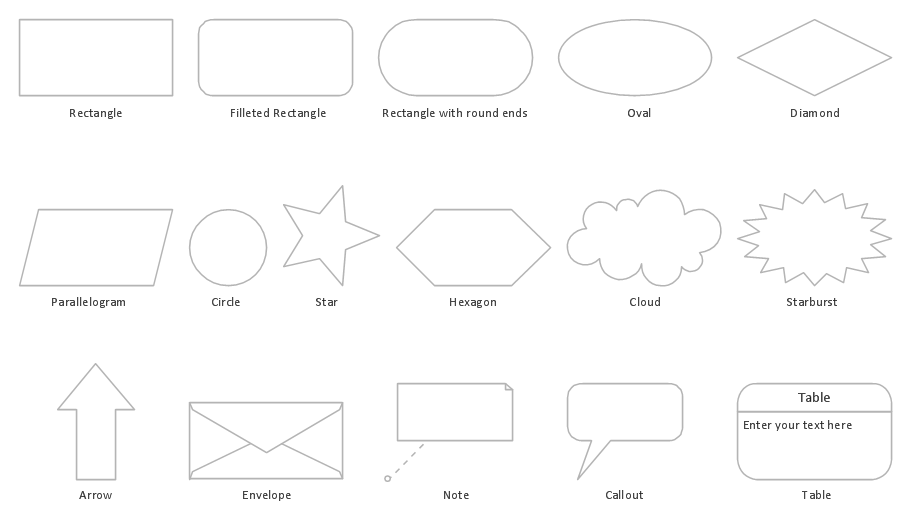
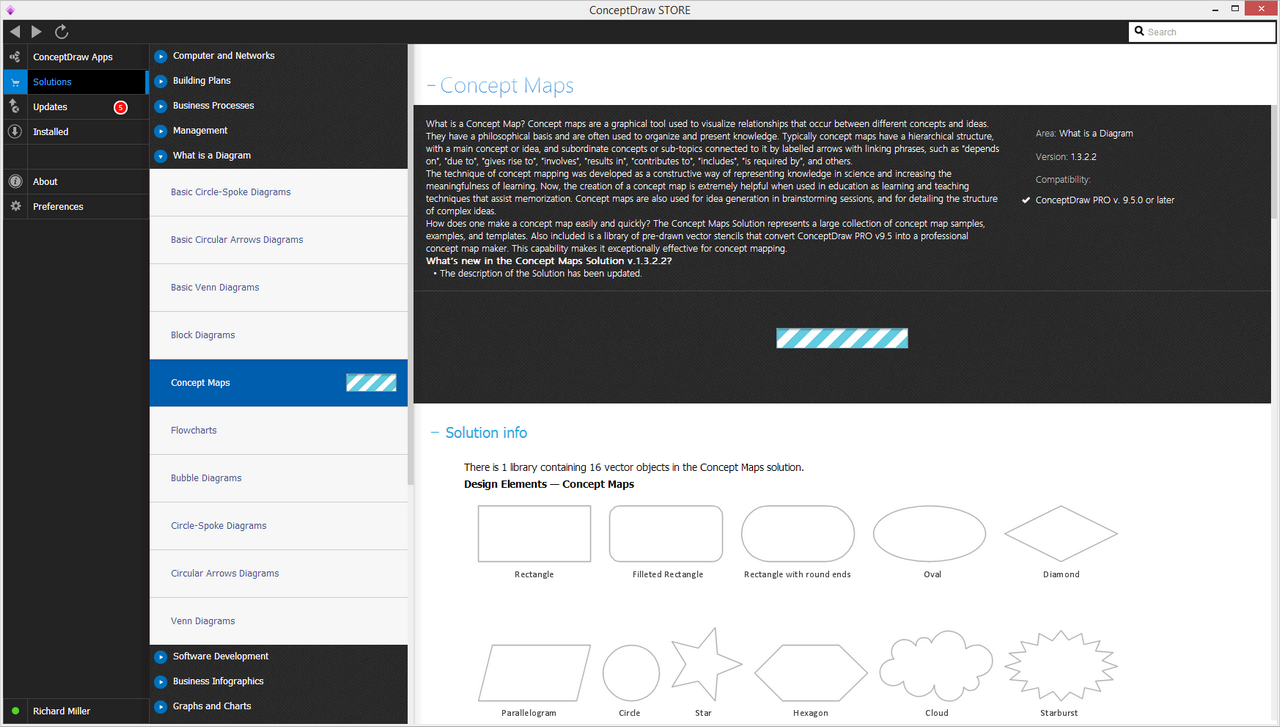
Design Elements — Concept Maps
Examples
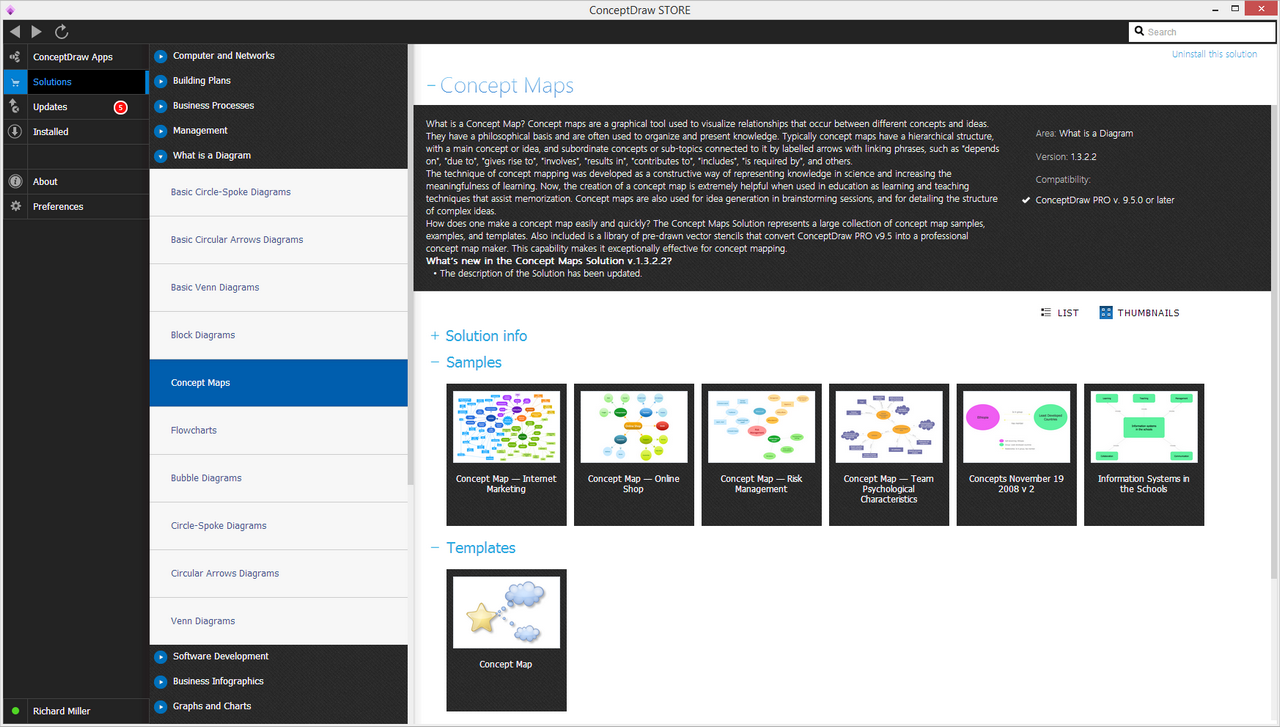
There are a few samples that you see on this page which were created in the ConceptDraw DIAGRAM application by using the Concept Maps solution. Some of the solution's capabilities as well as the professional results which you can achieve are all demonstrated here on this page.
All source documents are vector graphic documents which are always available for modifying, reviewing and/or converting to many different formats, such as MS PowerPoint, PDF file, MS Visio, and many other graphic ones from the ConceptDraw Solution Park or ConceptDraw STORE. The Concept Maps solution is available to all ConceptDraw DIAGRAM users to get installed and used while working in the ConceptDraw DIAGRAM diagramming and drawing software.
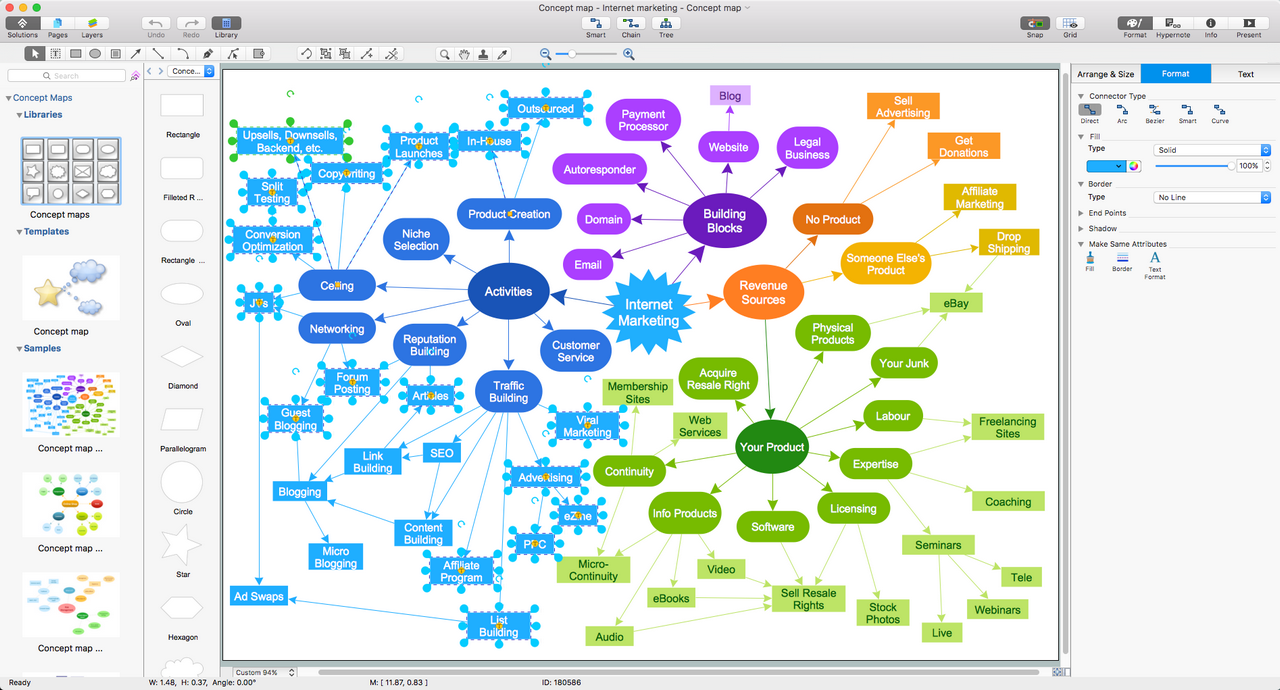
Example 1: Concept Map — Internet Marketing
This diagram was created in ConceptDraw DIAGRAM using the Concept Map Library from the Concept Map Solution. An experienced user spent 15 minutes creating this sample.
This Concept map shows the main principles and components of internet marketing, which along with internet advertising is directed to the promotion of different kinds of services and goods to the market, expanding the auditorium of consumers, increasing sales and profit. The internet marketing is a complex structure that contains the abundance of components: the product and all components connected with its development, creation, and sale, the revenue resources, the set of building blocks, as well as the different activities, including the customer service, traffic and reputation building, networking, selling, and many others. The diagram includes them all and is large and complex, but its construction isn't a problem with the ConceptDraw DIAGRAM software and Concept Maps solution. The use of different shapes, colors and gradations lets you make your diagram easy for understanding, perception, and remembering. The Concept map diagrams can be successfully used in presentations, conferences, and reviews, are able to easily decorate them and make clear.

Example 2: Concept Map — Online Shop
This diagram was created in ConceptDraw DIAGRAM using the Concept Maps Library from the Concept Maps Solution. An experienced user spent 10 minutes creating this sample.
This Concept map shows the components of an online shop, which is a useful service allowing consumers to buy goods and services directly from a seller, without leaving the house or office, only using the Internet and a web browser or mobile application. The online shop operates by goods, customer’s data – name and address, proposes different kinds of payment – by invoice, on delivery or by credit card, the transportation in various ways – freight, mail or courier, and offers support represented by guarantee, service, and/or help desk. With the development of internet marketing and the growth of online shopping popularity, the question of a clear understanding of the principles of working e-shops is the most actual. This map represents their working concept in a visual and bright form. Each color applied to a specified group lowers its intensity with increasing the distance from the main idea. Besides, each new level of elements uses its own shape, this better highlights differentiation in the map.

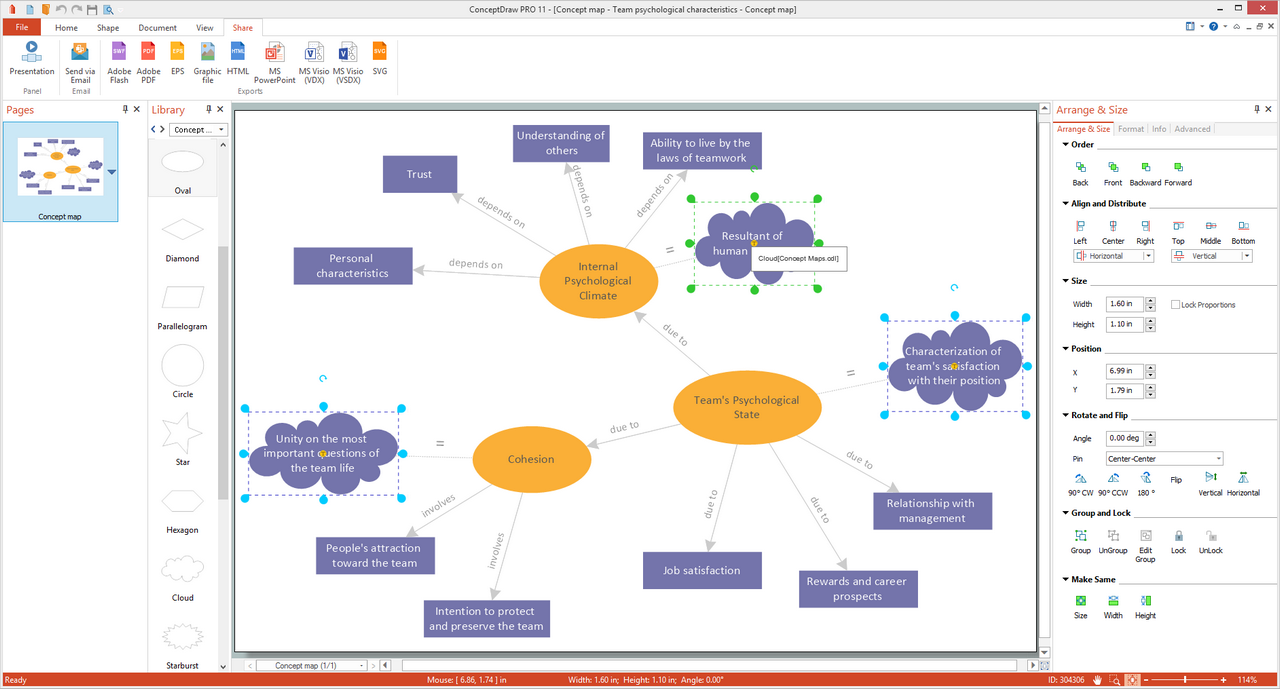
Example 3: Concept Map — Team Psychological Characteristics
This diagram was created in ConceptDraw DIAGRAM using the Concept Maps Library from the Concept Maps Solution. An experienced user spent 20 minutes creating this sample.
This Concept map sample depicts a team’s psychological characteristics. Teamwork is a work in a common project that is done by several people, each of them does their part and all they communicate with each other. A positive spirit and good relations in a team are the keys to the success of projects and the company as a whole. As the main team’s psychological characteristics are considered the team’s psychological state, internal psychological climate, and cohesion, which depend on the numerous factors. Ones of the most valuable are personal characteristics, trust, job satisfaction, understanding of others, unity on the most important questions of the team life, intention to protect and preserve the team, and some other factors listed in this diagram. What is a Concept map? It is a very convenient tool for such diagrams, it allows one to visually represent all important details. For greater clarity, the key ideas are brightly highlighted with color. You can easily highlight them at your discretion.

Example 4: Concepts v2, November, 19 2008
This diagram was created in ConceptDraw DIAGRAM using the Concept Map Library from the Concept Map Solution. An experienced user spent 5 minutes creating this sample.
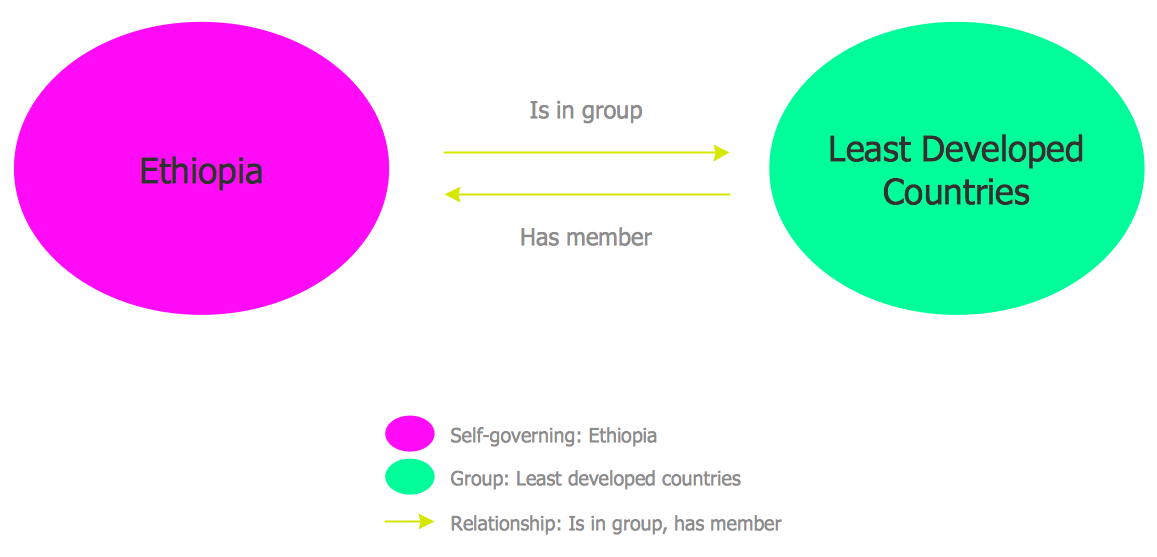
This Concept Diagram demonstrates the relationships between one country Ethiopia and a group of the Least Developed Countries (LDCs). One can observe the two-directional relationships: the country is in a group of LDCs and LDCs includes this country as a member. The diagram also contains the legend uncovering the sense of used designations. The single country is represented in a purple oval, the group of least developed countries in a green one. The arrows of yellow color depict the relationships. The concept mapping perfectly suits for representing the geopolitical ontology facts, concepts, and relationships between the entities, as well as for managing and exchanging data between them. The design solution of making the diagrams bright and colorful is useful from the point of data separation, highlighting the key moments and facts. It's very easy, convenient, and quick to create professional-looking diagrams in ConceptDraw DIAGRAM concept map maker using the predefined vector objects.
Example 5: Concept Map – Information Systems in the School
This diagram was created in ConceptDraw DIAGRAM using the Concept Map Library from the Concept Map Solution. An experienced user spent 5 minutes creating this sample.
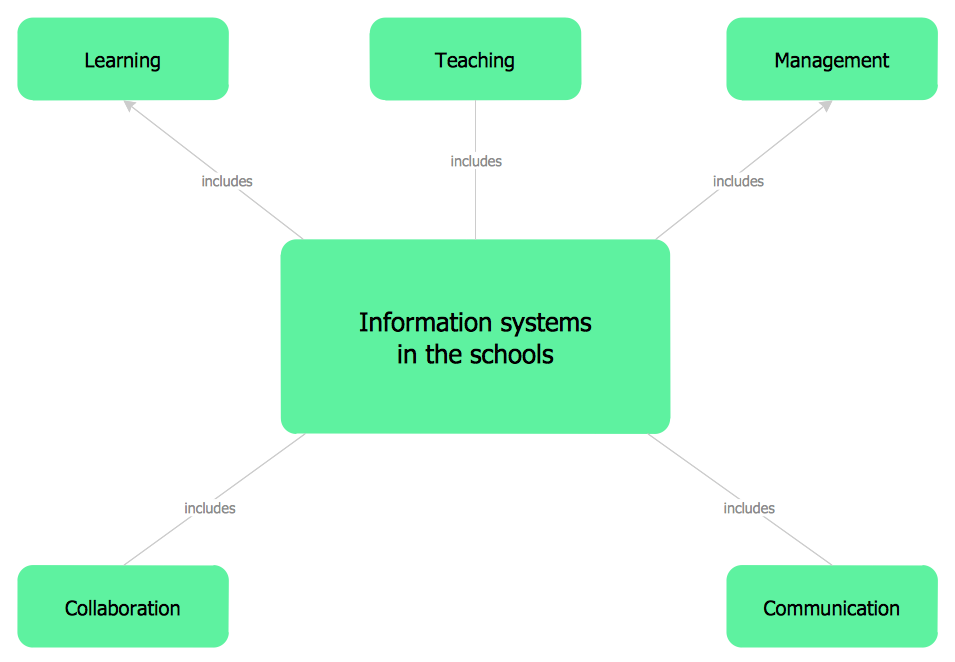
This Concept Diagram shows the main directions of application of the information systems in the schools. These are learning, teaching, management, communication, and collaboration. The information systems are a modern approach in education that has a great success and helps in explaining the new material, contributes to its comprehension, and easy perception. All concepts are depicted in rectangular boxes on the Concept map and are connected to the main theme by the "includes" relationships. The boxes representing concepts are accurately arranged around the main box on the equal distance, but at your desire, the diagram can be constructed in a form of a tree, of Venn diagram or Context diagram, or may have any other structure or form. The ConceptDraw DIAGRAM allows also varying the color design according to your taste and individual preferences, in accordance with the style of the document where it will be used, and with the considered area./p>
Example 6: Concept Map – Risk Management
This diagram was created in ConceptDraw DIAGRAM using the Concept Map Library from the Concept Map Solution. An experienced user spent 5 minutes creating this sample.
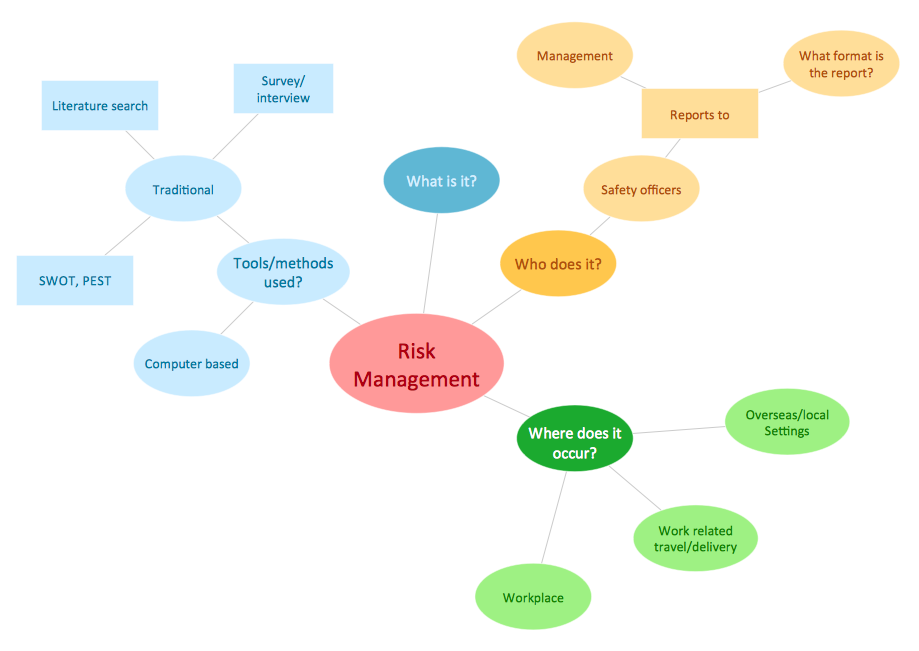
This Concept Diagram is dedicated to risk management that is the process of making and implementing management decisions aimed at reducing the likelihood of an unfavorable result and minimizing possible project losses caused by its implementation. It supposes the identification, assessment, and prioritization of risks. In ISO 31000, the risk management is defined as the effect of uncertainty on objectives. The reasons of appearing risks can be incredibly different, the risks can occur in result of uncertainties in financial markets, legal liabilities, accidents, credits, threats from project failures, deliberate attacks of rivals, as well as natural causes, disasters, or other occasions with uncertain or unpredictable causes. It should be noted that not only the risks significantly vary, the places of their occurring, but correspondingly the tools and methods of their management, as well as the definitions and goals, can vary according to the considered field, such as the project management, engineering, industry, security, business, finance, safety, or some other.
Inside
What I Need to Get Started
Both ConceptDraw DIAGRAM diagramming and drawing software and the Concept Maps solution can help creating the diagrams you need. The Concept Maps solution can be found in the Diagrams area of ConceptDraw STORE application that can be downloaded from this site. Make sure that both ConceptDraw DIAGRAM and ConceptDraw STORE applications are installed on your computer before you get started.
How to install
After ConceptDraw STORE and ConceptDraw DIAGRAM are downloaded and installed, you can install the Concept Maps solution from the ConceptDraw STORE.
Start using
To make sure that you are doing it all right, use the pre-designed symbols from the stencil libraries from the solution to make your drawings look smart and professional. Also, the pre-made examples from this solution can be used as drafts so your own drawings can be based on them. Using the samples, you can always change their structures, colors and data.
Concept maps
Concept mapping has a history that begins with the sciences, and a researcher named Joseph D. Novak, who developed concept maps as a teaching tool to help define student's scientific knowledge. Starting with an original thought or question, a concept map expands on this by offering all known knowledge or influencing factors surrounding this subject, while also describing the internal relationships between concepts.
Soon concept maps were being employed as a diagramming technique by knowledge workers from a wide variety fields — their hierarchical structure is suitable to tackle almost any idea, question or system that relies on logical dependencies and factors of causation. Ideas branch down or outwards from the original concept, roughly positioned in order of influence or specificity. Links between ideas can cross in any direction over the map, and are labelled to show the form of relationship — propositions such as 'is due to', 'caused by' or 'is required to', for example.

A concept map focusing on team unity created using ConceptDraw DIAGRAM, giving an example of the different types of relationships between concepts, as noted on the connecting arrows.
In an educational setting, the benefit to the student is being able to visualize and conceive relationships between concepts, to view how parts of an idea make up the whole. From a teacher's point of view, they can be used to spot gaps in a student's knowledge; psychologists can take this idea further by asking a patient to design a concept map, that helps profile that individual's personality.
Outside of being used as learning materials, concept maps can also be used to describe pre-existing systems that follow a similar hierarchy, such as websites or computer systems. In the case of the latter, a standardized language such as Unified Modeling Language (UML) can be used in conjunction with the diagramming style to define computer ontology for software engineers. For website design, a concept map is flexible enough to allow extra pages or data sources to be added at a later date, with hyperlink structure and other relationships updated accordingly.
Here are a few of the fields in which concept maps can be put to effective use:
- Business
- Education
- Software design
- Science
- Knowledge management
- Training
- Psychology
While visually similar to mind maps, concept maps are distinguished by being more appropriate for knowledge sharing, given the level of concept relationship detail they are able to provide. Mind maps on the other hand are more suitable for brainstorming a single topic, commonly showing only one or two levels of sub topics from the main idea.

This map design using ConceptDraw DIAGRAM uses color and concept node shape to indicate hierarchical structure.
Concept maps differ again by generally using labelled arrows to link the concept nodes on the page. Each arrow is assigned a 'linking phrase'; one advantage of this is being able to show a single concept or idea within multiple contexts in regards to other ideas.
CS Odessa have long supported visual solutions for product workers, and for those who like to work with concept maps, ConceptDraw DIAGRAM offers a superior package of drawing tools, image samples, templates and learning materials to help create distinct and effective diagrams.
Rapid object clone technology and intelligent connectors allow users to create their map in an intuitive and efficient manner, expanding from the central concept as quickly as the ideas come to mind. By extending the capabilities of PRO with the Concept Map solution, as well as ConceptDraw's other mind mapping add-ons, users are given access to comprehensive vector stencil libraries that compliment any illustrative style.
Concept maps are a valuable way of sharing knowledge. ConceptDraw DIAGRAM, and other products in the ConceptDraw Office suite, offer unparalleled choice in how you share that knowledge. Set up group brainstorming sessions, display maps as presentations, import and export to PowerPoint and other popular software, and link to external sources. Help and training materials are available for each step of the process, from templates that help you get started, through to presentation guides and video tips and tricks. For building concept maps, or any diagramming task, find the solution at ConceptDraw.