- Electric and Telecom Plans Free
- Fire and Emergency Plans Free
- Floor Plans Free
- Plant Layout Plans Free
- School and Training Plans Free
- Seating Plans Free
- Security and Access Plans Free
- Site Plans Free
- Sport Field Plans Free
- Business Process Diagrams Free
- Business Process Mapping Free
- Classic Business Process Modeling Free
- Cross-Functional Flowcharts Free
- Event-driven Process Chain Diagrams Free
- IDEF Business Process Diagrams Free
- Logistics Flow Charts Free
- Workflow Diagrams Free
- ConceptDraw Dashboard for Facebook Free
- Mind Map Exchange Free
- MindTweet Free
- Note Exchange Free
- Project Exchange Free
- Social Media Response Free
- Active Directory Diagrams Free
- AWS Architecture Diagrams Free
- Azure Architecture Free
- Cisco Network Diagrams Free
- Cisco Networking Free
- Cloud Computing Diagrams Free
- Computer Network Diagrams Free
- Google Cloud Platform Free
- Interactive Voice Response Diagrams Free
- Network Layout Floor Plans Free
- Network Security Diagrams Free
- Rack Diagrams Free
- Telecommunication Network Diagrams Free
- Vehicular Networking Free
- Wireless Networks Free
- Comparison Dashboard Free
- Composition Dashboard Free
- Correlation Dashboard Free
- Frequency Distribution Dashboard Free
- Meter Dashboard Free
- Spatial Dashboard Free
- Status Dashboard Free
- Time Series Dashboard Free
- Basic Circle-Spoke Diagrams Free
- Basic Circular Arrows Diagrams Free
- Basic Venn Diagrams Free
- Block Diagrams Free
- Concept Maps Free
- Family Tree Free
- Flowcharts Free
- Basic Area Charts Free
- Basic Bar Graphs Free
- Basic Divided Bar Diagrams Free
- Basic Histograms Free
- Basic Line Graphs Free
- Basic Picture Graphs Free
- Basic Pie Charts Free
- Basic Scatter Diagrams Free
- Aerospace and Transport Free
- Artwork Free
- Audio, Video, Media Free
- Business and Finance Free
- Computers and Communications Free
- Holiday Free
- Manufacturing and Maintenance Free
- Nature Free
- People Free
- Presentation Clipart Free
- Safety and Security Free
- Analog Electronics Free
- Audio and Video Connectors Free
- Basic Circuit Diagrams Free
- Chemical and Process Engineering Free
- Digital Electronics Free
- Electrical Engineering Free
- Electron Tube Circuits Free
- Electronic Block Diagrams Free
- Fault Tree Analysis Diagrams Free
- GHS Hazard Pictograms Free
- Home Automation and Wiring Free
- Mechanical Engineering Free
- One-line Diagrams Free
- Power Сircuits Free
- Specification and Description Language (SDL) Free
- Telecom and AV Circuits Free
- Transport Hazard Pictograms Free
- Data-driven Infographics Free
- Pictorial Infographics Free
- Spatial Infographics Free
- Typography Infographics Free
- Calendars Free
- Decision Making Free
- Enterprise Architecture Diagrams Free
- Fishbone Diagrams Free
- Organizational Charts Free
- Plan-Do-Check-Act (PDCA) Free
- Seven Management and Planning Tools Free
- SWOT and TOWS Matrix Diagrams Free
- Timeline Diagrams Free
- Sustainable Development $25
- Australia Map Free
- Continent Maps Free
- Directional Maps Free
- Germany Map Free
- Metro Map Free
- UK Map Free
- USA Maps Free
- Customer Journey Mapping Free
- Marketing Diagrams Free
- Matrices Free
- Pyramid Diagrams Free
- Sales Dashboard Free
- Sales Flowcharts Free
- Target and Circular Diagrams Free
- Cash Flow Reports Free
- Current Activities Reports Free
- Custom Excel Report Free
- Knowledge Reports Free
- MINDMAP Reports Free
- Overview Reports Free
- PM Agile Free
- PM Dashboards Free
- PM Docs Free
- PM Easy Free
- PM Meetings Free
- PM Planning Free
- PM Presentations Free
- PM Response Free
- Resource Usage Reports Free
- Visual Reports Free
- House of Quality Free
- Quality Mind Map Free
- Total Quality Management TQM Diagrams Free
- Value Stream Mapping Free
- Astronomy Free
- Biology Free
- Chemistry Free
- Language Learning Free
- Mathematics Free
- Physics Free
- Piano Sheet Music Free
- Android User Interface Free
- Class Hierarchy Tree Free
- Data Flow Diagrams (DFD) Free
- DOM Tree Free
- Entity-Relationship Diagram (ERD) Free
- EXPRESS-G data Modeling Diagram Free
- IDEF0 Diagrams Free
- iPhone User Interface Free
- Jackson Structured Programming (JSP) Diagrams Free
- macOS User Interface Free
- Object-Role Modeling (ORM) Diagrams Free
- Rapid UML Free
- SYSML Free
- Website Wireframe Free
- Windows 10 User Interface Free
Sustainable Development
Sustainable development is a development that meets its own needs of today's people without damaging the natural system. In this way, it simultaneously provides the ability for future generations to meet their needs. Sustainable development contributes to improving the quality of life and meeting human needs, while ensuring the stability and integrity of the natural system. This ensures a healthy environment and clean air for future generations, quality resources, food and clean drinking water. Sustainable development also has an impact on culture, social development and the economy. It includes many processes, aspects and ways to achieve these goals.
Each country independently develops its own strategy, plans, and programs for sustainable development. Sustainable transport and smart cities are also among them. Sustainable transport allows reducing the level of negative impact on the environment. Smart cities are planned in such a way as to reduce air and water pollution, minimize the consumption of energy and non-renewable resources.
The UN has a great impact in the field of sustainable development and appeals to development without destruction. It strives to ensure a better and sustainable future for our planet, improve the quality of life, enhance future potential, and meet human needs. The UN aims to solve global problems of poverty, inequality, justice and peace, climate change, global warming, air and water pollution, depletion of freshwater reserves, deforestation, and overfishing. It strives to protect the planet, its natural resources, ecosystems, and atmosphere, reduce inequality, eradicate severe poverty, and solve the problem of feeding billions of people. In total, the UN includes 17 global sustainable development goals, including the formation of relations in society based on common ethical principles, culture, mutual understanding, justice, democracy, respect for human rights, concern for living organisms and the environment.
Sustainable development and, in particular, sustainable transport contribute to the improvement of the ecological state of the planet. This is a big positive contribution, because the proportion of emissions from conventional transport into the atmosphere is huge. Besides, sustainable development also affects the social and economic sustainability of the society they serve. The use of renewable energy sources, such as solar panels, wind turbines, biogas, etc., also helps to improve the environmental situation and reduce the negative impact on the environment.
The Sustainable Development solution extends ConceptDraw DIAGRAM with a set of pre-made samples and a large collection of predesigned objects, symbols, and pictograms for designing professionally looking diagrams related to sustainable development, its processes, goals, methods, and ways for their achievement. This solution is really helpful to create schematics and designs illustrating the main points of sustainable development, social sustainability, narrating about sustainable energy and sources of green energy. It is useful to develop sustainable development plans that need to be implemented to ensure the safety of nature, list the UN sustainable development goals, draw up a plan for building a smart city and implementing the principles of sustainable agriculture, and other important information.
-
Buy this solution $25 -
Solution Requirements - This solution requires the following products to be installed:
ConceptDraw DIAGRAM v18 - This solution requires the following products to be installed:
-
Support for this Solution -
Helpdesk
There are 12 libraries containing 340 vector graphics icons and 13 examples in the Sustainable Development solution.
Design Elements — Cultural Sustainability

Design Elements — Ecological Sustainability

Design Elements — Economic Sustainability

Design Elements — Political Sustainability

Design Elements — Social Sustainability

Design Elements — Sustainable Agriculture

Design Elements — Sustainable City

Design Elements — Sustainable Development

Design Elements — Sustainable Energy

Design Elements — Sustainable Healthcare

Design Elements — Sustainable Technologies

Design Elements — Sustainable Transport

Related News:
Sustainable Development Examples
There are a few samples that you see on this page which were created in the ConceptDraw DIAGRAM application by using the Sustainable Development solution. Some of the solution's capabilities as well as the professional results which you can achieve are all demonstrated here on this page.
All source documents are vector graphic documents which are always available for modifying, reviewing and/or converting to many different formats, such as MS PowerPoint, PDF file, MS Visio, and many other graphic ones from the ConceptDraw Solution Park or ConceptDraw STORE. The Sustainable Development solutions are available to all ConceptDraw DIAGRAM users to install and use it for working in diagramming and drawing.
Example 1: Capacities for Sustainable Development
This diagram was created in ConceptDraw DIAGRAM using the combination of libraries from the Sustainable Development Solution. An experienced user spent 15 minutes creating this sample.
This sample shows the main capacities for sustainable development, which brings many benefits to our planet and people. Sustainable development helps to solve environmental, economic and social issues in order to create a healthier, safer and more productive environment, and improve the quality of life. It includes six interconnected capacities required to achieve the sustainable development. Key among these are the ability to measure progress towards sustainable development, link knowledge to action to support resilience, transform the system's sustainable development paths, and adapt to various shocks and surprises. Besides, you can find here another capacities, which are not less important for sustainable development. These include the ability to ensure intergenerational and intragenerational equity, the ability to develop and implement governance and collaboration mechanisms, and other functions.

Example 2: Carbon Emissions per Passenger
This diagram was created in ConceptDraw DIAGRAM using the combination of libraries from the Sustainable Development Solution. An experienced user spent 15 minutes creating this sample.
This infographic example shows carbon dioxide emissions per passenger for various modes of transport such as airplanes, large and small cars, two-wheelers, buses, and passenger trains. Emissions are measured in g/pkm and accounting for them is important because the transport sector is the main source of greenhouse gas (GHG) emissions to the environment, which cause a serious global problem of air pollution and global warming. In the U.S., the emissions from the transportation sector comprise around 47% of all GHGs. This infographics allows easy studying and comparing emissions, and developing effective ways to decrease these rates. You can observe that aircraft and cars have the highest rates of emissions and it is recommended to move in direction of using sustainable transport including rail, human-powered and electrical transport. Infographics are more convenient and visual than tabular form for displaying relevant emission data.

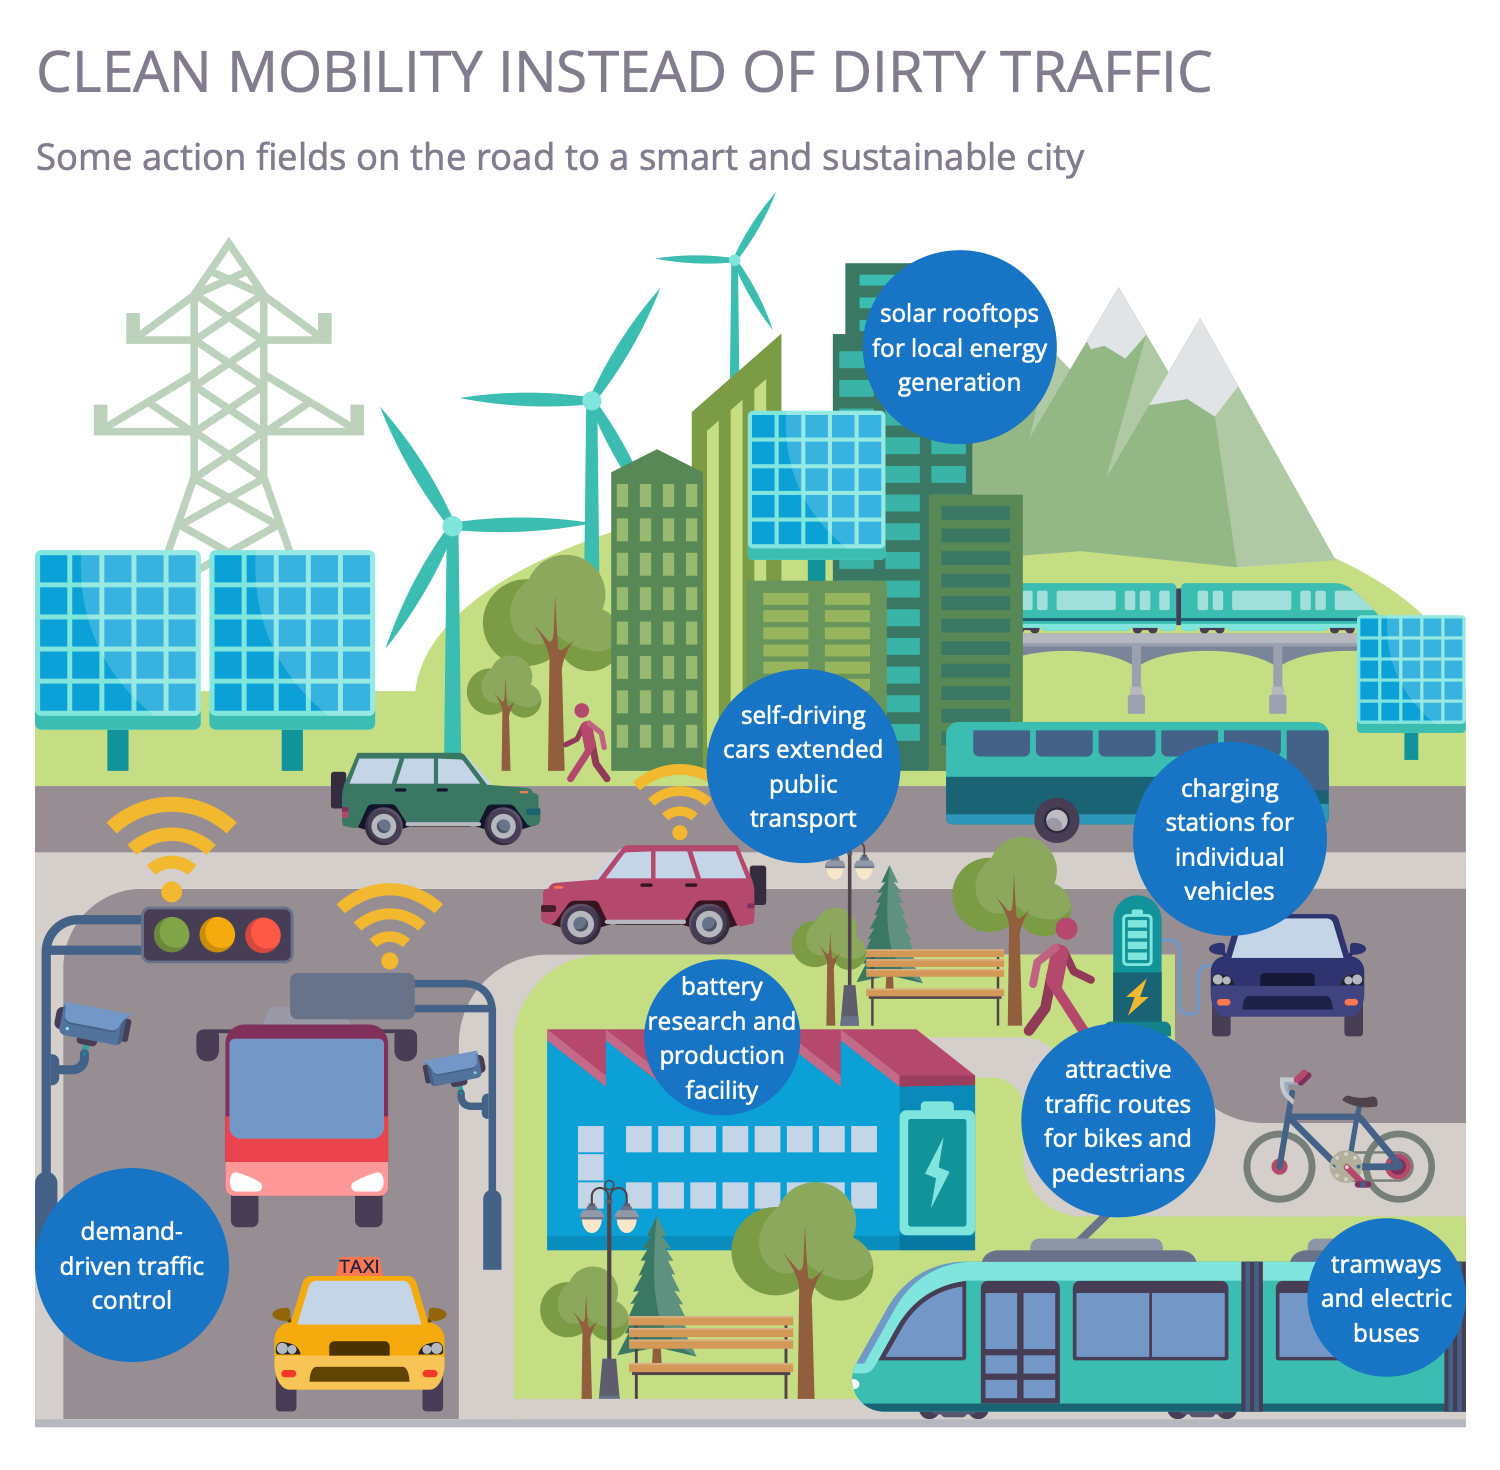
Example 3: Clean Mobility
This diagram was created in ConceptDraw DIAGRAM using the combination of libraries from the Sustainable Development Solution. An experienced user spent 15 minutes creating this sample.
Soft or clean mobility is a concept that supports the use of environmentally friendly, ecological, sustainable, and socially acceptable modes of transportation. We are talking about walking, cycling, electric transport, and public transport. Clean mobility supposes the development of transport infrastructure and the control and managing of traffic to handle the necessary volume of traffic and avoid unnecessary traffic. A smart city requires the implementation of sustainable and environmentally friendly mobility, on-demand traffic control, research and development and battery production capacity. The installation of solar roofs for local energy production, charging stations for individual vehicles, the use of self-driving cars, the expansion of public transport and the development of attractive routes for cyclists and pedestrians, trams and electric buses are encouraged.
Example 4: Developing a Sustainable Community and Green Infrastructure Plan
This diagram was created in ConceptDraw DIAGRAM using the combination of libraries from the Sustainable Development Solution. An experienced user spent 15 minutes creating this sample.
Green infrastructure helps to keep the environment clean, solve climate and natural problems, clean water, soil and air, improve the quality of food and life, and develop sustainable energy production. Developing effective ways to achieve these goals is the main challenge of green infrastructure. Moreover, green infrastructure creates the basis for social and economic development and ensures equal access to natural services. This sample infographic shows ten steps to develop a sustainable community and green infrastructure plan. It includes setting goals, evaluating assets and capabilities, organizing stakeholders and developing a community vision, monitoring and measuring progress, identifying federal government resources, and effective approaches to adding green infrastructure. Developing local financing strategies, including abandoned mines and hazardous waste sites in planning, and planning for long-term operation and maintenance are also important points in the green infrastructure plan.

Example 5: Energy Efficiency of Transport
This diagram was created in ConceptDraw DIAGRAM using the combination of libraries from the Sustainable Development Solution. An experienced user spent 15 minutes creating this sample.
This sample diagram shows the energy efficiency range of different transport models, such as cars, articulated and bi-articulated buses and scooters, compared to cycling and walking. It is measured in passenger-kilometers per liter of fuel (km/h). This information is incredibly important for the implementation of the concept of sustainable transport and the construction of sustainable cities. Transportation has a large impact on the city's energy consumption. According to the statistics, transportation comprises around a quarter of the world's energy consumption and is one of the main sources of harmful carbon dioxide emissions in the environment. This amount is increasing every year, and therefore the idea of sustainable transport is now more important than ever. Sustainable transportation strives to solve the problem of traffic jams and air pollution. It is used to reduce greenhouse gas emissions and provide healthier and more productive urban centers through the use of more efficient vehicles with low environmental impact.

Example 6: Low Impact Development
This diagram was created in ConceptDraw DIAGRAM using the combination of libraries from the Sustainable Development Solution. An experienced user spent 15 minutes creating this sample.
This infographic is dedicated to low impact development (LID), which is one of the main terms in the green infrastructure sector. It defines the principles of land planning and engineering design to protect water quality, conserve on-site natural features, and manage the use of stormwater runoff to build resilient cities. The sample shows five key elements of low-impact development (LID). They include the conservation of natural areas, implementation of proper maintenance, pollution prevention, and public education programs. LID includes adapting site design to protect the entire watershed, minimizing impact and implementing small-scale hydrological measures, and maintaining direct flow to natural areas such as streams, wetlands, aquifers. As a result, LID improves the management of runoff and flooding, reduces impervious surfaces and provides benefits to support both flora and fauna. The final list of LID practices to be implemented at the area is selected based on its individual characteristics such as soil type, climate, hydrology, rainfall patterns, and land use.

Example 7: Overall GHG from Transport
This diagram was created in ConceptDraw DIAGRAM using the combination of libraries from the Sustainable Development Solution. An experienced user spent 15 minutes creating this sample.
This infographics example shows the overall greenhouse gas (GHG) emissions from different transport such as cars, motorcycles, railways, cargo transport, aviation, navigation, and other vehicles. Transport is a major source of air pollution with carbon dioxide, carbon monoxide, nitrous oxides, particulates, and the largest contributor to global warming. That is a result of burning the greatest amount of petroleum in the world. Being compared, these data show that emissions vary significantly between different modes of transport. You can see that cars and heavy vehicles are the biggest emitters of greenhouse gases and the main contributors to global warming. Today, global world organizations are working hard to develop and implement effective programs aimed at reducing vehicle emissions caused by an increase in the number of vehicles. They call for an increase in the use of rail, electric and mechanized transport, which will have a positive impact on the ecosystem, air quality, human health, climate change, global warming, acid rain, smog and other negative effects.

Example 8: Planning Approach of Blue Green Infrastructure
This diagram was created in ConceptDraw DIAGRAM using the combination of libraries from the Sustainable Development Solution. An experienced user spent 15 minutes creating this sample.
This diagram shows how the blue and green infrastructure approaches are combined into one integrated ecological strategy that ensures to build blue-green cities. Blue infrastructure refers to urban infrastructure relating to water resources such as rivers, lakes, streams, ponds. Green infrastructure includes actions and approaches to solve urban, ecological and climatic challenges by saving nature and increasing health of the surroundings. It manages stormwater runoff, ensures conditions for cleaning and improving air, water, and soil. Stormwater management allows you to reduce the load on the drainage infrastructure, stormwater and general sewerage. This reduces the impact of urban flooding and improves overall water quality. One of the most innovative green infrastructure practices is green roofs, which absorb rain and carbon pollution, reduce urban runoff, improve air and water quality, and reduce energy costs by providing excellent roof insulation.

Example 9: Sustainable Competitiveness Model
This diagram was created in ConceptDraw DIAGRAM using the combination of libraries from the Sustainable Development Solution. An experienced user spent 15 minutes creating this sample.
This infographic shows the 5 pillars of a sustainable competitiveness model: resource efficiency, governance, intellectual capital, social capital, and natural capital. The agricultural sector is a prime example of sustainable competitiveness. This is a territory that significantly affects the environment, climate, soil and water quality and, accordingly, the health and quality of life of people. Sustainable agriculture is agriculture that meets society's needs for food and textiles without polluting the environment and preserves nature for future generations. It respects natural resources and maintains an ecological balance, striving to keep natural resources clean. The development of sustainable agriculture contributes to solving the problems of degradation, deforestation and other negative processes. In addition, it has global benefits, promotes social and economic sustainability within countries, and promotes fair trade by meeting the global demand for agro-food production.

Example 10: Sustainable Development Goals
This diagram was created in ConceptDraw DIAGRAM using the combination of libraries from the Sustainable Development Solution. An experienced user spent 15 minutes creating this sample.
This infographics shows a set of sustainable development goals (SDGs) also called global goals. These 17 goals were set up in 2015 by the United Nations General Assembly (UNGA) and accepted by all its members to be achieved by 2030. All SDGs are interlinked and were developed as a global development way to achieve a sustainable future, peace and prosperity for people in the whole world now and in the future. The list of UN sustainable development goals includes eradication of poverty and hunger, ensuring conditions for good health, well-being, qualitative education, gender equality, clean water and sanitation, affordable and clean energy, decent work and economic growth, implementation of innovations and infrastructure, development of the industry. There are also included reducing inequality, building sustainable cities and communities, climate action, ensuring life, peace, justice, and strong institutions, life on land and below water, providing responsible consumption and production, and partnerships for the goals.

Example 11: Sustainable Development Parts
This diagram was created in ConceptDraw DIAGRAM using the combination of libraries from the Sustainable Development Solution. An experienced user spent 15 minutes creating this sample.
These are the dimensions where the main goals of sustainability are set and solved. Besides, these three directions are closely interrelated and the decisions are taken at all levels from the individual consumers to national and global level. The key issues in the environmental area are ones related to human impacts including environmental pollution, climate change, deforestation, degradation of land and ecosystem, decrease of biodiversity, etc. Economic sustainability is primarily connected to economic development and growth. Social sustainability is not less important for people than previous global parts. It includes security and protection in such areas as health, nutrition, sport, education, competence, influence, meaning-making, and others. The diagram is created as a 3-set Venn diagram, the intersections of the sets also have value and make accent the interconnection of the sustainable development parts.

Example 12: The Sustainability Flower
This diagram was created in ConceptDraw DIAGRAM using the combination of libraries from the Sustainable Development Solution. An experienced user spent 15 minutes creating this sample.
This infographics example shows the Sustainability Flower. It is a model developed by an international group of companies involved in organic agriculture and NGO's in 2009 for ecological and social sustainability. The Eosta (Netherlands), Soil & More Impacts (Germany) and SEKEM (Egypt) are the companies that took part in the development and now actively use this model. The Sustainability Flower includes the United Nation's Social Development Goals (SDGs) and shows them in the visual form of 7 petals of the flower. Each petal reflects a unique aspect of sustainability: society, economy, individual, climate, water, soil, and biodiversity. The 17 sustainable development goals (SDGs) are arranged between these groups. In order to evaluate quantitatively the sustainable development goals and performance, the Key Point Indicators are used. Develop all kinds of infographics and diagrams fast and easily in ConceptDraw DIAGRAM and illustrate effectively the ways of sustainable development, production of sustainable green energy, and saving clear environment.

Example 13: Transport Infrastructure Comparison
This diagram was created in ConceptDraw DIAGRAM using the combination of libraries from the Sustainable Development Solution. An experienced user spent 15 minutes creating this sample.
This diagram is a comparison of the sustainable transport infrastructure that was created in a visual infographics form. Sustainable urban infrastructure provides methods for multiple areas of society including transportation. It extends the concept of urban infrastructure and ensures resilient urban development and improvement. At the same time, all actions and methods of sustainable urban infrastructure must meet the needs of the present generation without compromising future ones. This is the most important principle of sustainable infrastructure. In terms of transport, railway, dual carriageway and motorway are compared in terms of width and maximum passenger traffic per hour in each direction. Meanwhile, despite the railway is the narrowest by width, its passenger flow rate per hour is maximal among all offered ways. Use the ready-made vector objects from the Sustainable Development solution libraries to create your thematic diagrams really fast.

Inside

What I Need to Get Started
After ConceptDraw DIAGRAM is installed, the Sustainable Development solution can be purchased either from the Management area of ConceptDraw STORE itself or from our online store. Thus, you will be able to use the Sustainable Development solution straight after.

How to install
First of all, make sure that both ConceptDraw STORE and ConceptDraw DIAGRAM applications are downloaded and installed on your computer. Next, install the Sustainable Development solution from the ConceptDraw STORE to use it in the ConceptDraw DIAGRAM application.

Start using
Start using the Sustainable Development solution to make the professionally looking business planning diagrams by adding the design elements taken from the stencil libraries and editing the pre-made examples that can be found there.
