- Electric and Telecom Plans Free
- Fire and Emergency Plans Free
- Floor Plans Free
- Plant Layout Plans Free
- School and Training Plans Free
- Seating Plans Free
- Security and Access Plans Free
- Site Plans Free
- Sport Field Plans Free
- Business Process Diagrams Free
- Business Process Mapping Free
- Classic Business Process Modeling Free
- Cross-Functional Flowcharts Free
- Event-driven Process Chain Diagrams Free
- IDEF Business Process Diagrams Free
- Logistics Flow Charts Free
- Workflow Diagrams Free
- ConceptDraw Dashboard for Facebook Free
- Mind Map Exchange Free
- MindTweet Free
- Note Exchange Free
- Project Exchange Free
- Social Media Response Free
- Active Directory Diagrams Free
- AWS Architecture Diagrams Free
- Azure Architecture Free
- Cisco Network Diagrams Free
- Cisco Networking Free
- Cloud Computing Diagrams Free
- Computer Network Diagrams Free
- Google Cloud Platform Free
- Interactive Voice Response Diagrams Free
- Network Layout Floor Plans Free
- Network Security Diagrams Free
- Rack Diagrams Free
- Telecommunication Network Diagrams Free
- Vehicular Networking Free
- Wireless Networks Free
- Comparison Dashboard Free
- Composition Dashboard Free
- Correlation Dashboard Free
- Frequency Distribution Dashboard Free
- Meter Dashboard Free
- Spatial Dashboard Free
- Status Dashboard Free
- Time Series Dashboard Free
- Basic Circle-Spoke Diagrams Free
- Basic Circular Arrows Diagrams Free
- Basic Venn Diagrams Free
- Block Diagrams Free
- Concept Maps Free
- Family Tree Free
- Flowcharts Free
- Basic Area Charts Free
- Basic Bar Graphs Free
- Basic Divided Bar Diagrams Free
- Basic Histograms Free
- Basic Line Graphs Free
- Basic Picture Graphs Free
- Basic Pie Charts Free
- Basic Scatter Diagrams Free
- Aerospace and Transport Free
- Artwork Free
- Audio, Video, Media Free
- Business and Finance Free
- Computers and Communications Free
- Holiday Free
- Manufacturing and Maintenance Free
- Nature Free
- People Free
- Presentation Clipart Free
- Safety and Security Free
- Analog Electronics Free
- Audio and Video Connectors Free
- Basic Circuit Diagrams Free
- Chemical and Process Engineering Free
- Digital Electronics Free
- Electrical Engineering Free
- Electron Tube Circuits Free
- Electronic Block Diagrams Free
- Fault Tree Analysis Diagrams Free
- GHS Hazard Pictograms Free
- Home Automation and Wiring Free
- Mechanical Engineering Free
- One-line Diagrams Free
- Power Сircuits Free
- Specification and Description Language (SDL) Free
- Telecom and AV Circuits Free
- Transport Hazard Pictograms Free
- Data-driven Infographics Free
- Pictorial Infographics Free
- Spatial Infographics Free
- Typography Infographics Free
- Calendars Free
- Decision Making Free
- Enterprise Architecture Diagrams Free
- Fishbone Diagrams Free
- Organizational Charts Free
- Plan-Do-Check-Act (PDCA) Free
- Seven Management and Planning Tools Free
- SWOT and TOWS Matrix Diagrams Free
- Timeline Diagrams Free
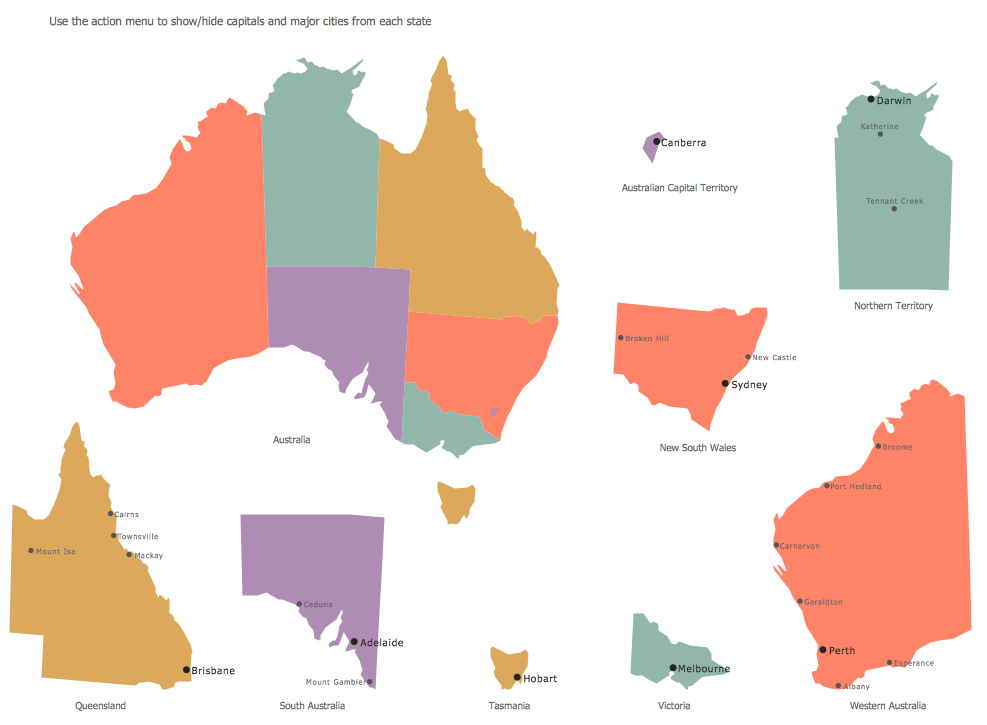
- Australia Map Free
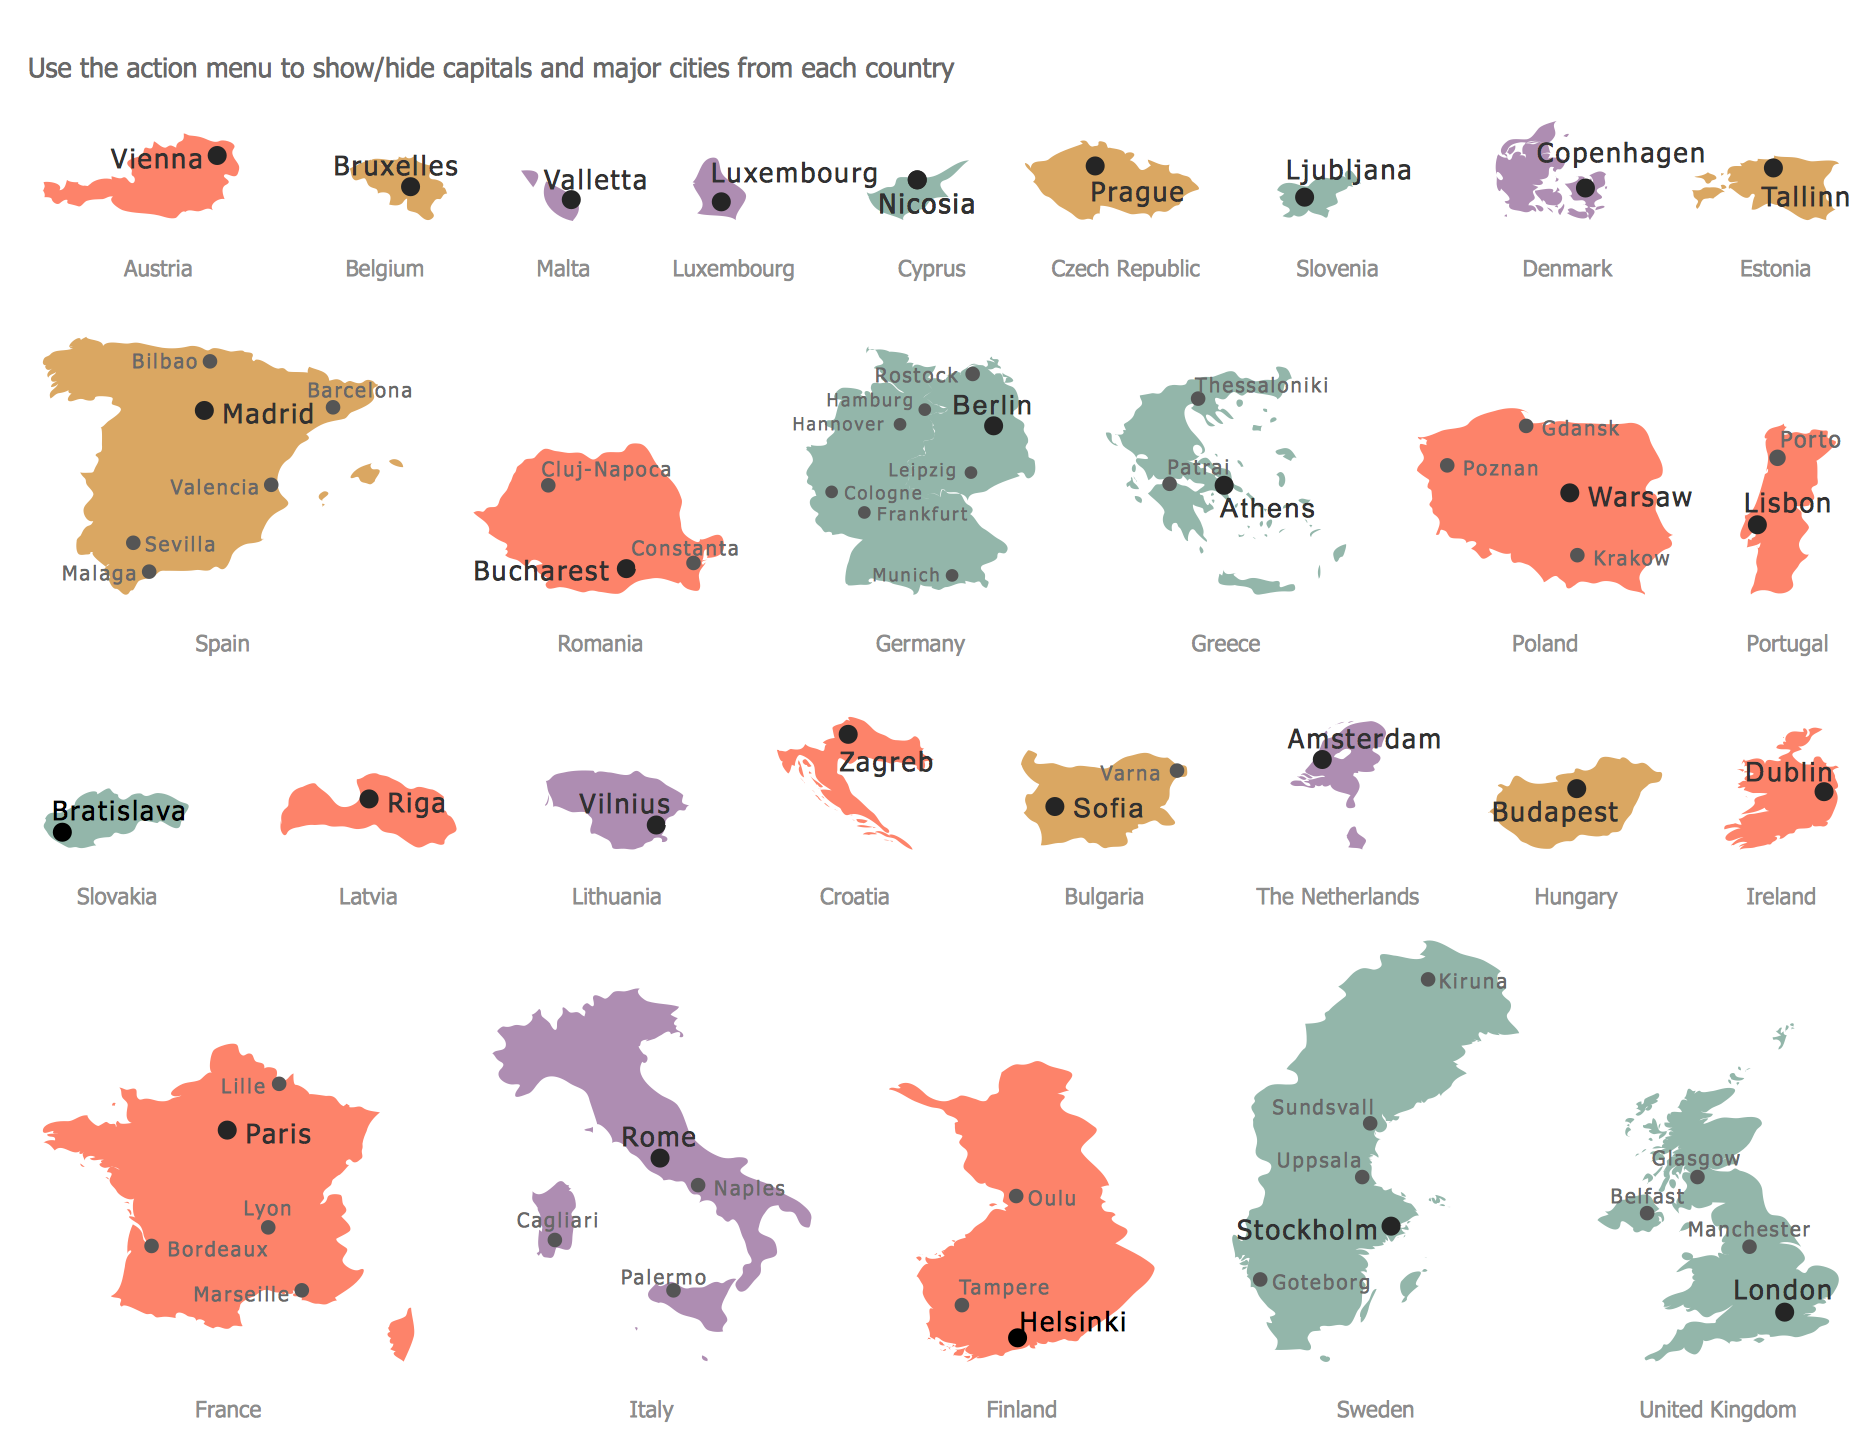
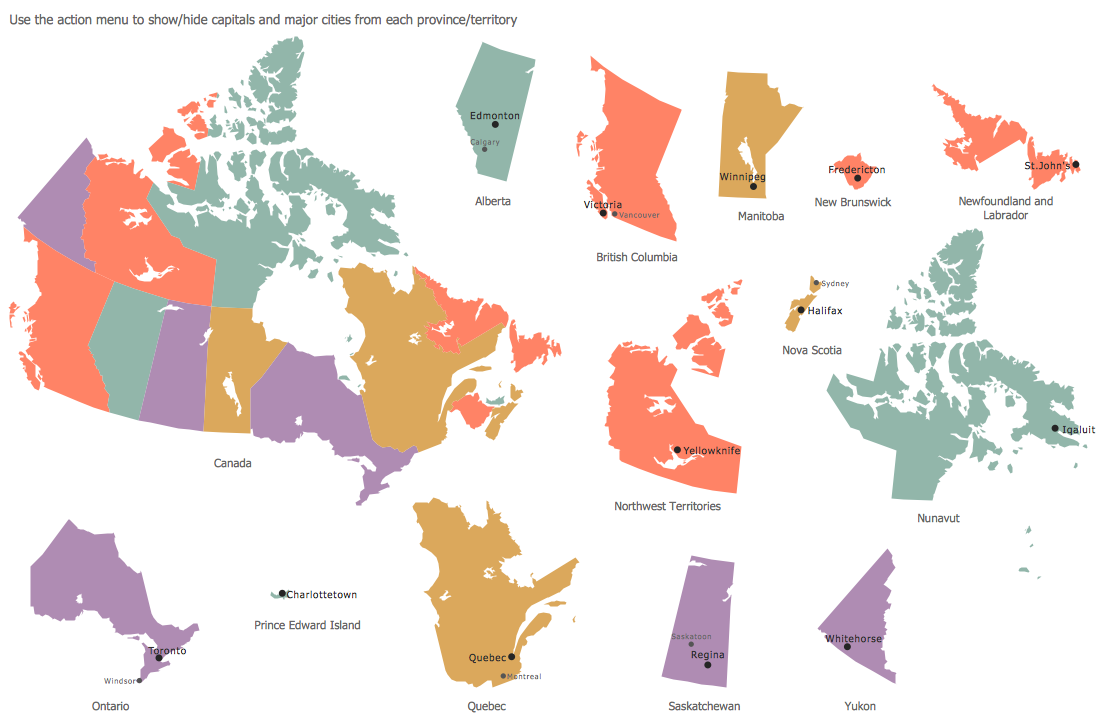
- Continent Maps Free
- Directional Maps Free
- Germany Map Free
- Metro Map Free
- UK Map Free
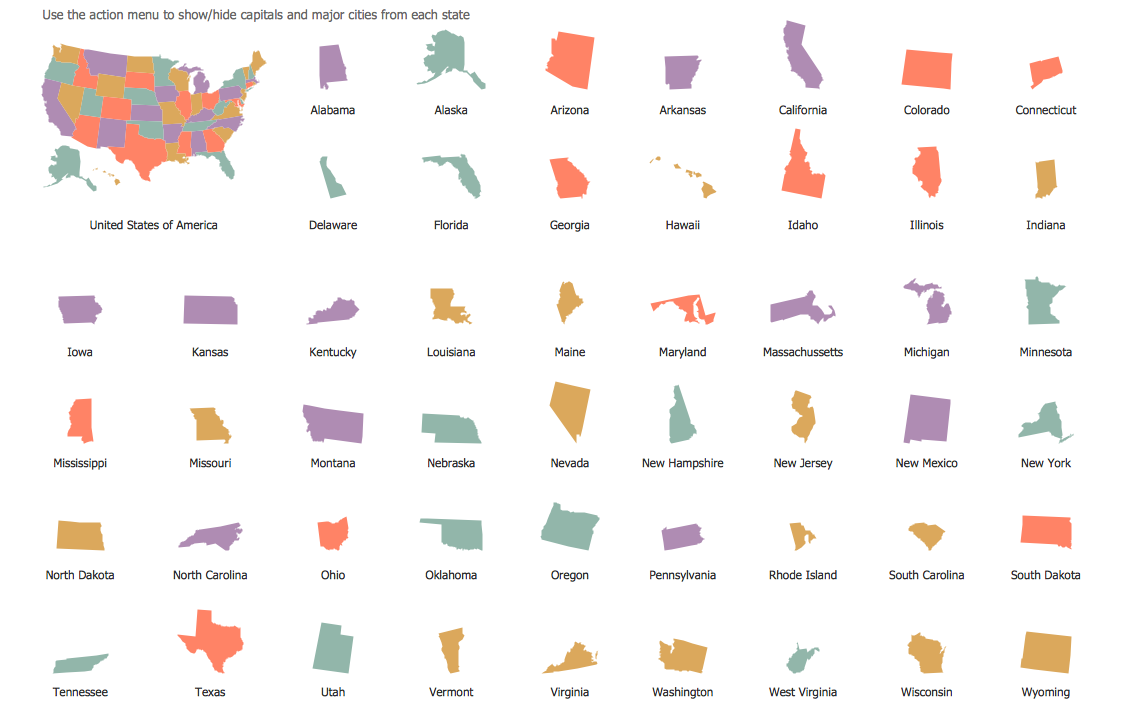
- USA Maps Free
- Customer Journey Mapping Free
- Marketing Diagrams Free
- Matrices Free
- Pyramid Diagrams Free
- Sales Dashboard Free
- Sales Flowcharts Free
- Target and Circular Diagrams Free
- Cash Flow Reports Free
- Current Activities Reports Free
- Custom Excel Report Free
- Knowledge Reports Free
- MINDMAP Reports Free
- Overview Reports Free
- PM Agile Free
- PM Dashboards Free
- PM Docs Free
- PM Easy Free
- PM Meetings Free
- PM Planning Free
- PM Presentations Free
- PM Response Free
- Resource Usage Reports Free
- Visual Reports Free
- House of Quality Free
- Quality Mind Map Free
- Total Quality Management TQM Diagrams Free
- Value Stream Mapping Free
- Astronomy Free
- Biology Free
- Chemistry Free
- Language Learning Free
- Mathematics Free
- Physics Free
- Piano Sheet Music Free
- Android User Interface Free
- Class Hierarchy Tree Free
- Data Flow Diagrams (DFD) Free
- DOM Tree Free
- Entity-Relationship Diagram (ERD) Free
- EXPRESS-G data Modeling Diagram Free
- IDEF0 Diagrams Free
- iPhone User Interface Free
- Jackson Structured Programming (JSP) Diagrams Free
- macOS User Interface Free
- Object-Role Modeling (ORM) Diagrams Free
- Rapid UML Free
- SYSML Free
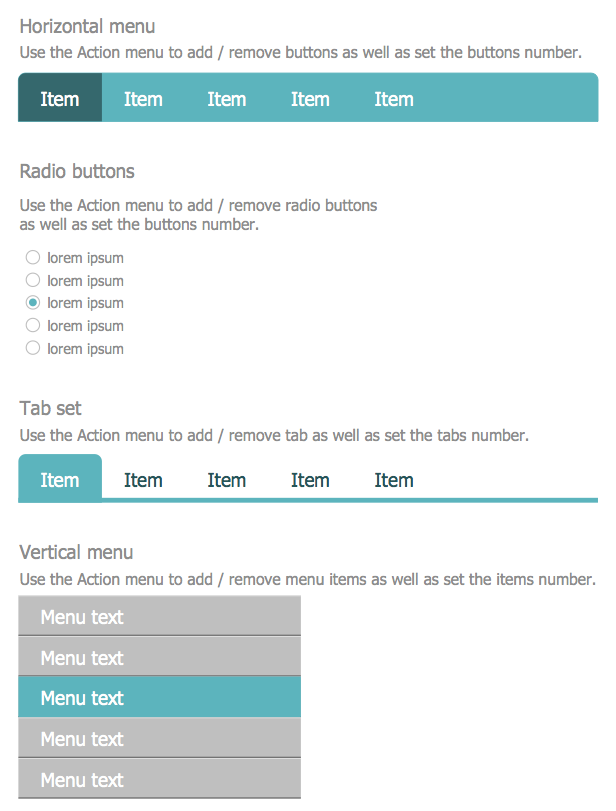
- Website Wireframe Free
- Windows 10 User Interface Free
Business Management Package
26 solutions, 182 libraries, 4 781 vector objects and pictograms, 353 examples and templates.
Graphics Package includes solutions:
Business Intelligence Dashboard, Management Infographics, Logistic Dashboard, Education Infographics, Landscape and Garden, Financial Infographics, Business Process Workflow Diagrams, Cooking Recipes, Health Food, Marketing Infographics, 25 Typical Orgcharts, HR Flowcharts, Stakeholder Onion Diagrams, CRM Center Dashboard, Funnel Diagrams, Scrum Workflow, Seven Basic Tools of Quality, HR Dashboard, Area Charts, Bar Graphs, Pie Charts, Line Graphs, Divided Bar Diagrams, Histograms, Picture Graphs, Scatter Diagrams.
$917 value for only $367
-
Buy this package $367 -
Package Requirements - This solution requires the following products to be installed:
ConceptDraw DIAGRAM v18 ConceptDraw MINDMAP v16 - This solution requires the following products to be installed:
-
Compatibility - Sonoma (14), Sonoma (15)
MS Windows 10, 11 - Sonoma (14), Sonoma (15)
-
Support for this Package -
Helpdesk
Graphics Package intended for:
Management specialists, marketing experts, business specialists, business analysts, business advisers, business coaches, economists, international business experts, officials and state managers, IT managers, specialists in managing the business processes, politicians, economic experts, PR managers, sales managers, financial specialists, IT specialists, technical experts and software developers, computer engineers, network and telecommunication engineers, software engineers, system administrators, webmasters, system architects, system engineers, quality assurance engineers, quality managers, HR managers, scientists, lecturers, knowledge workers.
Graphics Package major topics:
Business intelligence dashboard, Management infographics, Management maps, Management infograms, Logistic dashboards, Logistic maps, Logistic KPI dashboards, Education infographics, Education infograms, Landscape and garden plans, Financial infographics, Financial maps, Business process workflow diagrams, Cooking recipes illustrations, Cooking infographics, Health food images, Healthy diet illustrations, Marketing infographics, Marketing infograms, Marketing maps, Marketing charts, Market research diagrams, Organizational charts, HR flowcharts, HR development charts, Human resource management diagrams, Stakeholder onion diagrams, CRM center dashboards, Facebook CRM dashboards, Instagram CRM dashboards, Twitter CRM dashboards, Funnel diagrams, Horizontal funnel diagrams, Vertical funnel diagrams, AIDA models, Scrum workflow, Scrum charts, Scrum infographics, HR dashboards, HR charts, HR maps, HR metric dashboards, HR performance dashboards, Revenue and employment dashboards, Training and development dashboards, Area charts, Bar graphs, 3D bar graphs, Double bar graphs, Pie charts, Donut charts, Arrow circle charts, Doughnut charts, Ring charts, Line graphs, Divided bar diagrams, Divided bar graphs, Stacked graphs, Bar diagrams math, Picture graphs, Quality charts, Cause-and-effect diagrams, Pareto charts, Process flowcharts, Stratification charts, Check sheets, Control charts, Run charts, Histograms, Scatter plots, Scatter diagrams, Scatter graphs.
Graphics Package support standards or methods:
BPMN1.2, BPMN 2.0, IDEF0, IDEF3, EPC (Event-driven Process Chain), Agile methodology, Scrum method, Six Sigma methodology, Live Objects technology.
What is ConceptDraw Graphics Package?
ConceptDraw Graphics Package is kit of solutions selected for specific industry or profession. There are number of solutions selected from ConceptDraw Solution Park which are important for efficiently creating major diagrams of the industry. It extends capability of ConceptDraw software with vector graphic stensils, samples and tools. It requires ConceptDraw DIAGRAM software to be installed on your computer.
ConceptDraw Graphics Package let you get started in one click with number of valuable solutions and graphics details for specific industry or profession. Also the package price usually provides significant savings comparing to separated one by one purchases of solutions from ConceptDraw Solution Park.
List of Solutions:
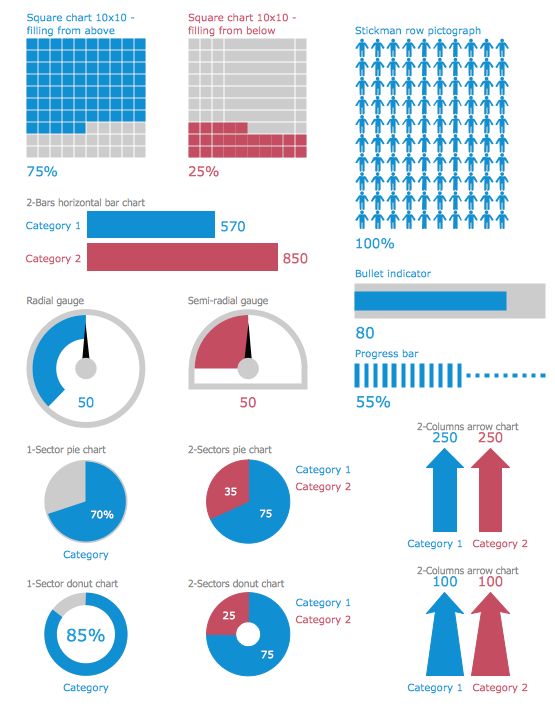
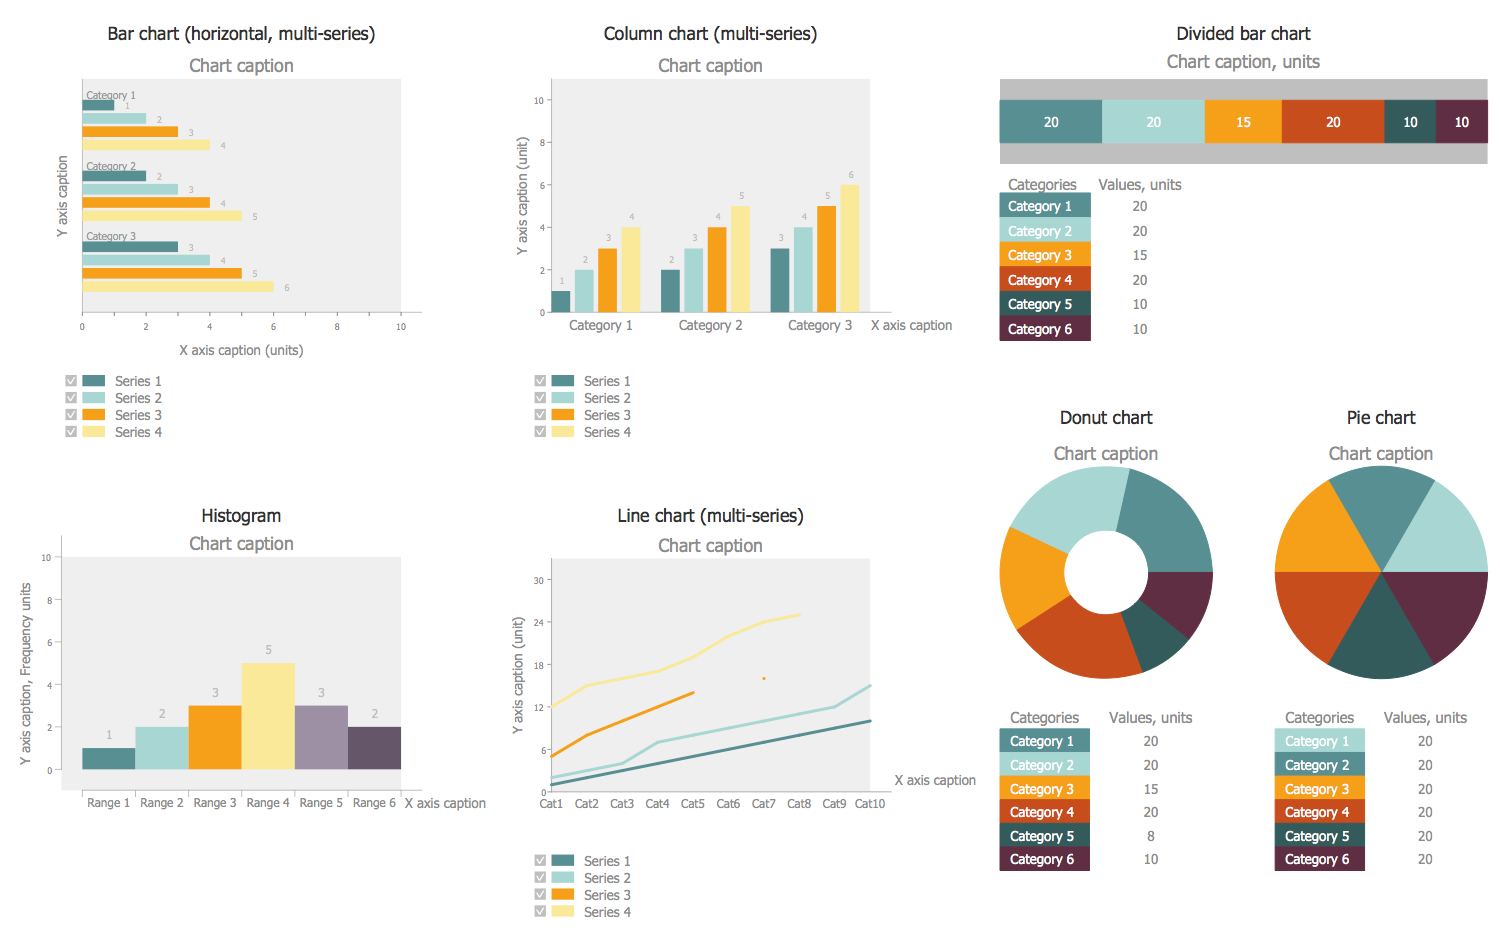
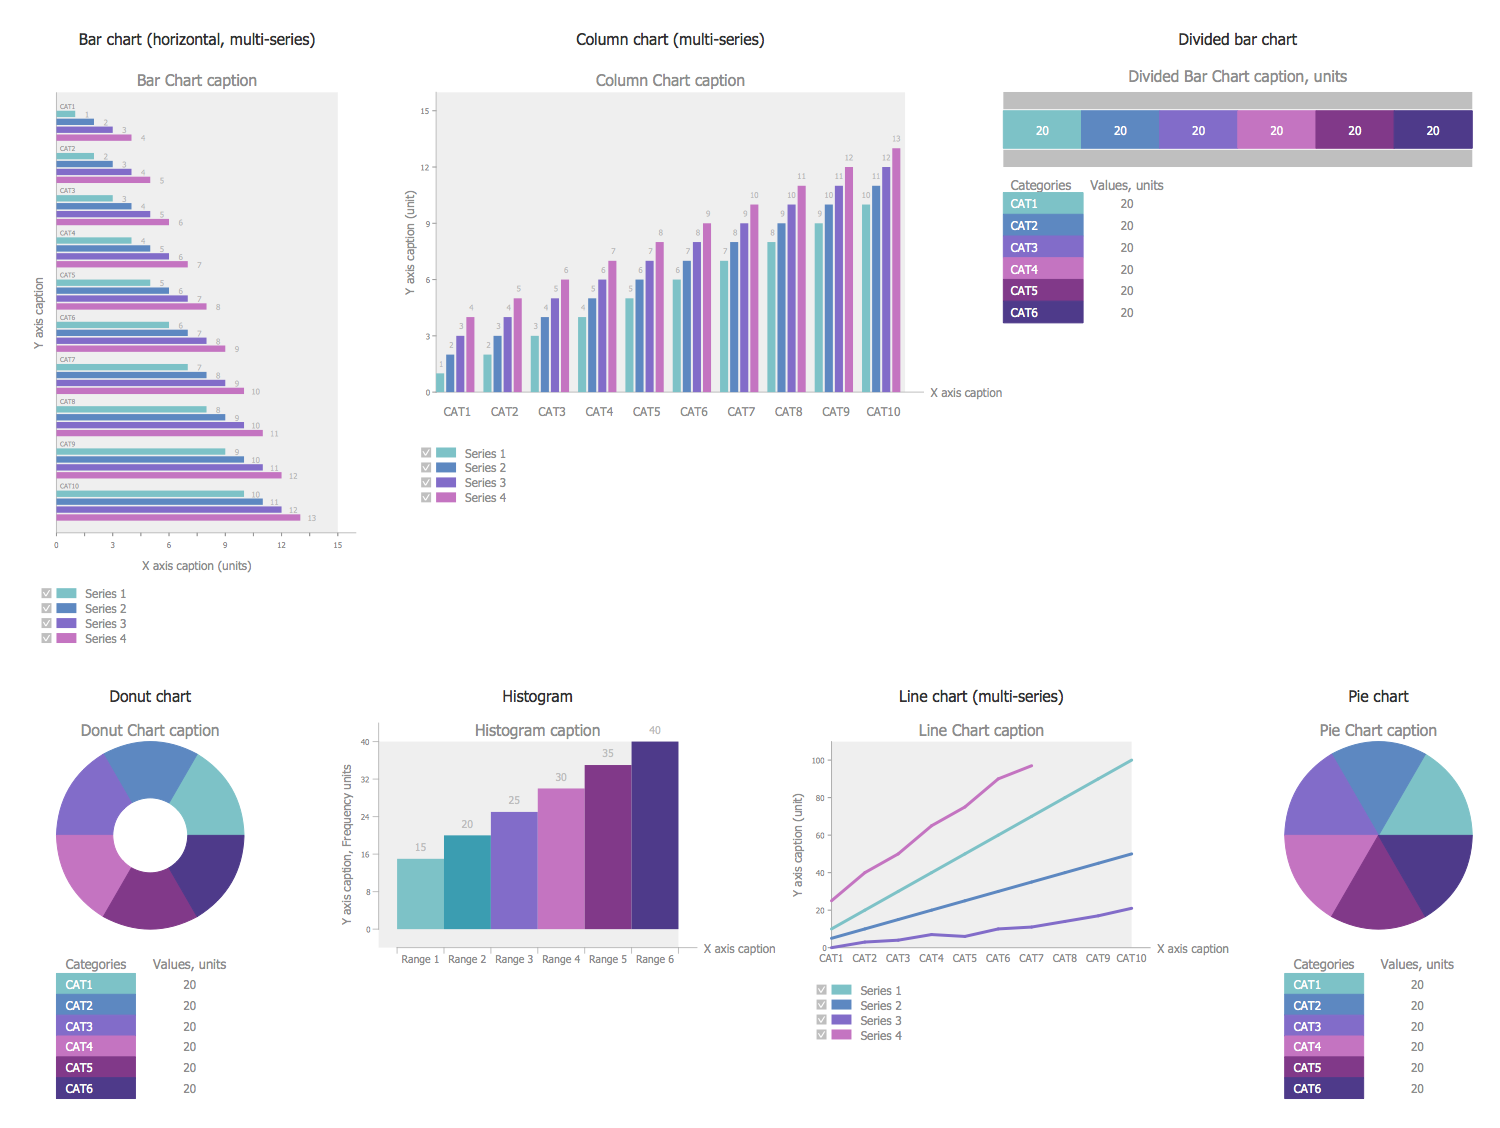
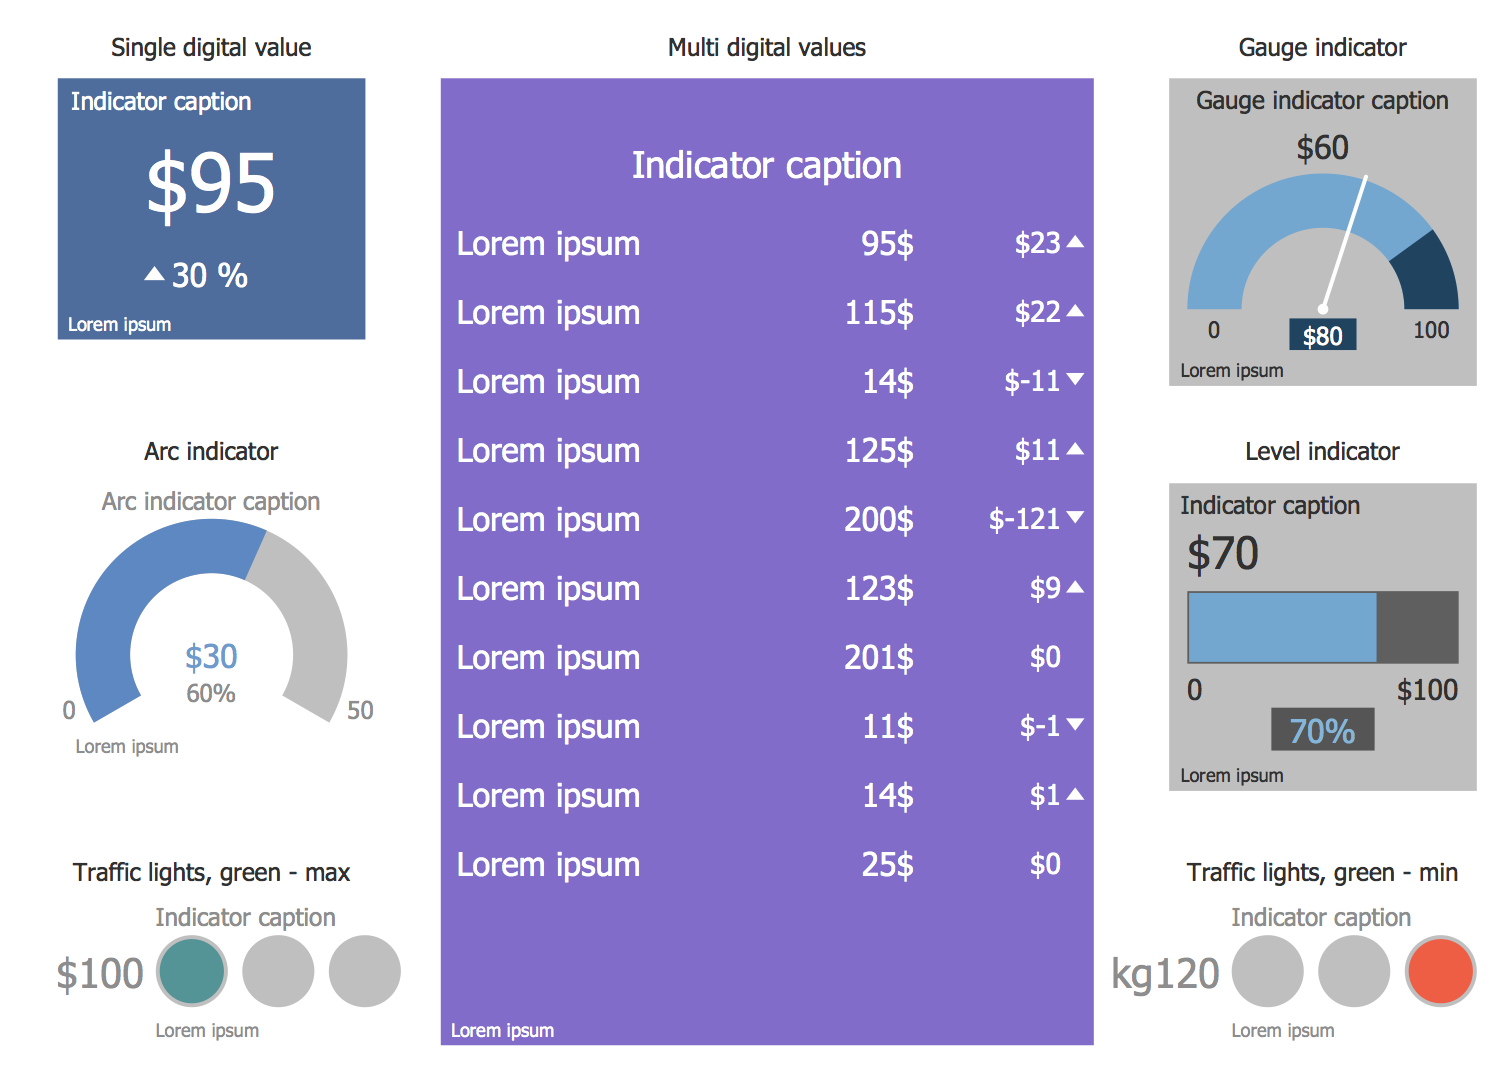
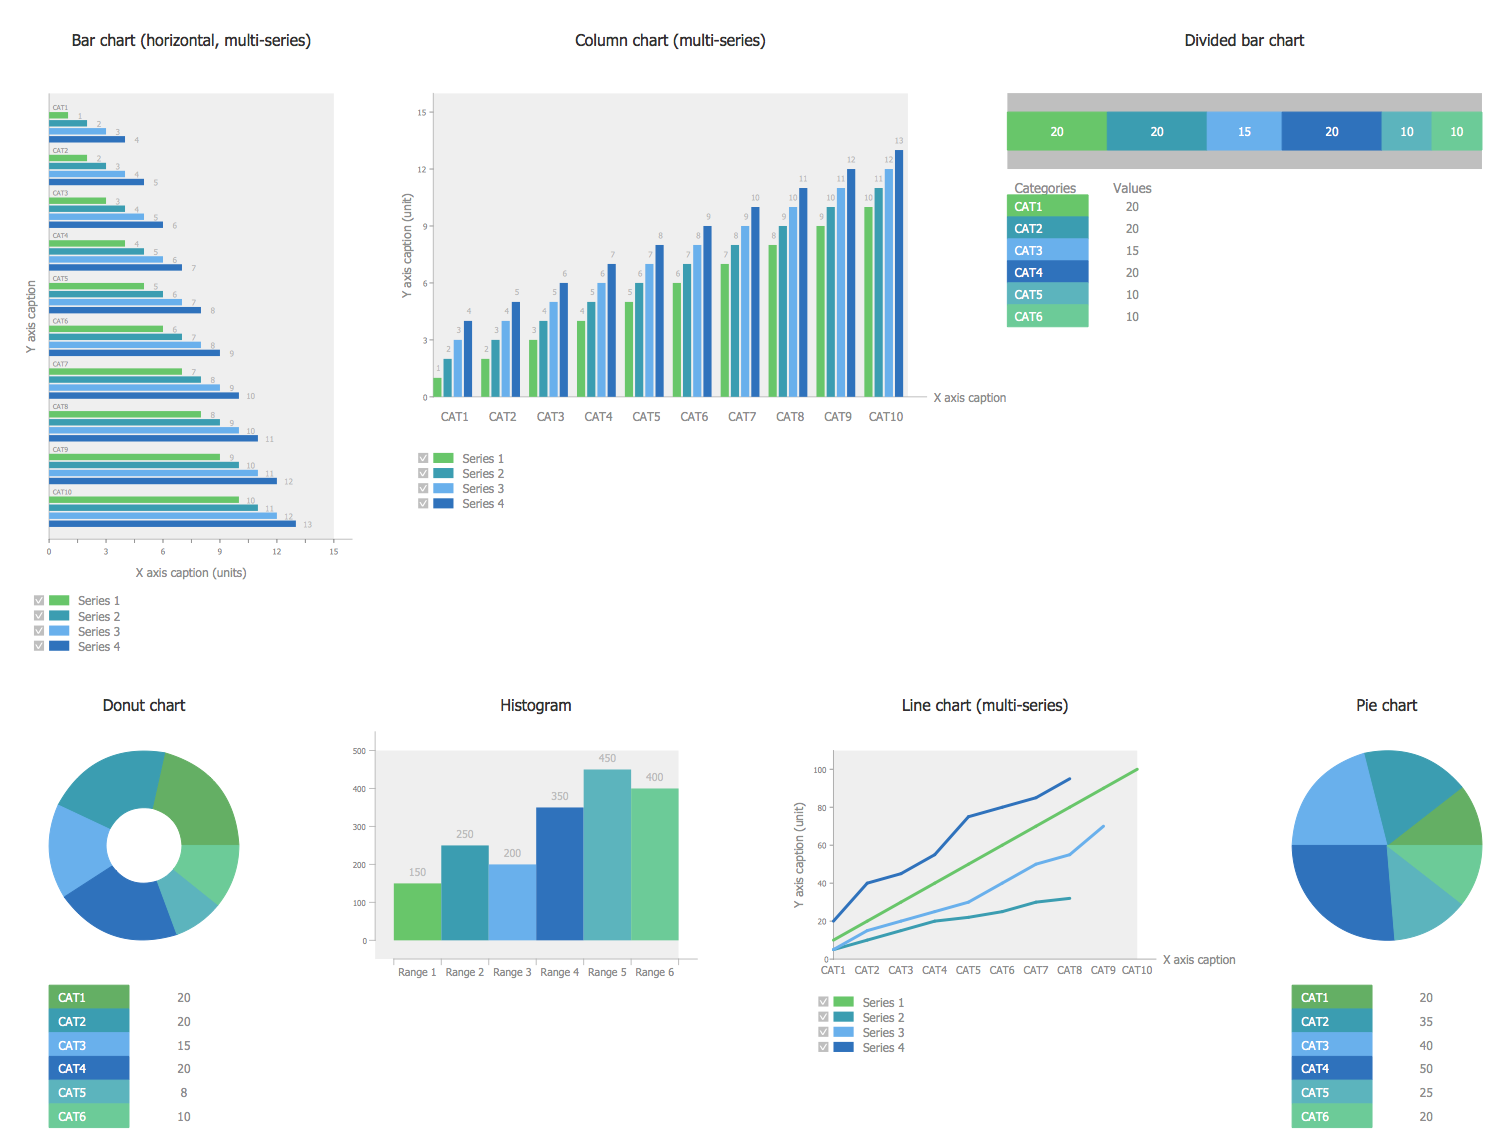
Business Intelligence Dashboard Solution
This solution groups various types of diagrams and maps useful for creation informative and professional-looking Business Intelligence Dashboards.
There are 3 stencil libraries containing 20 vector objects and 12 examples in the Business Intelligence Dashboard solution.


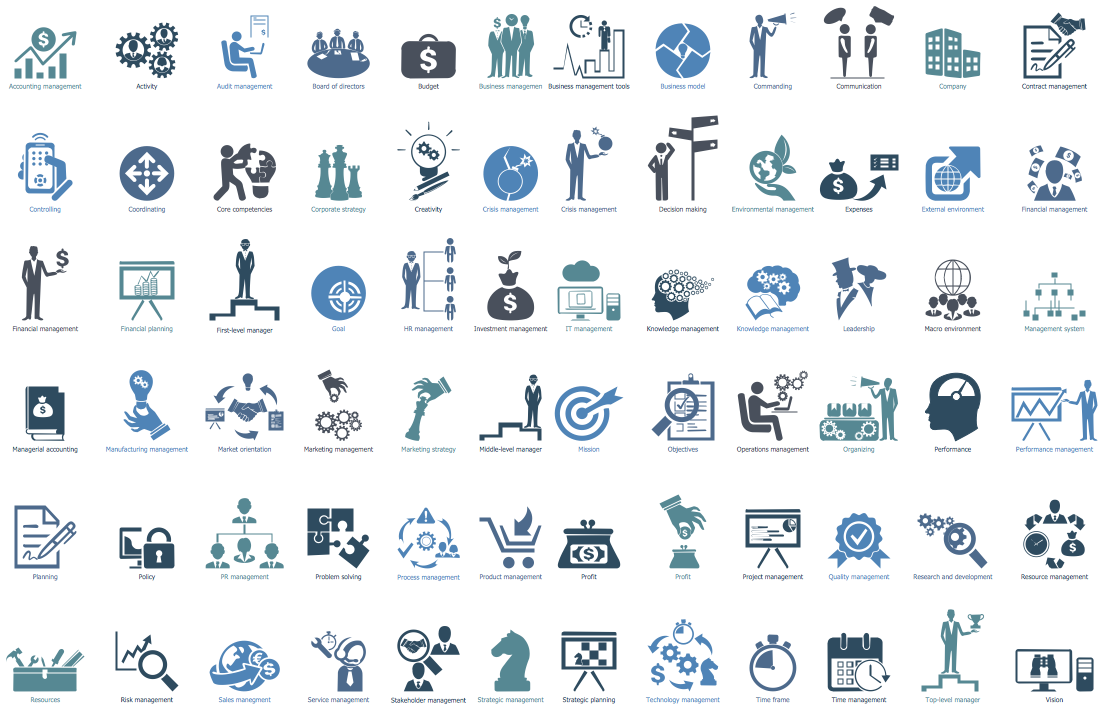
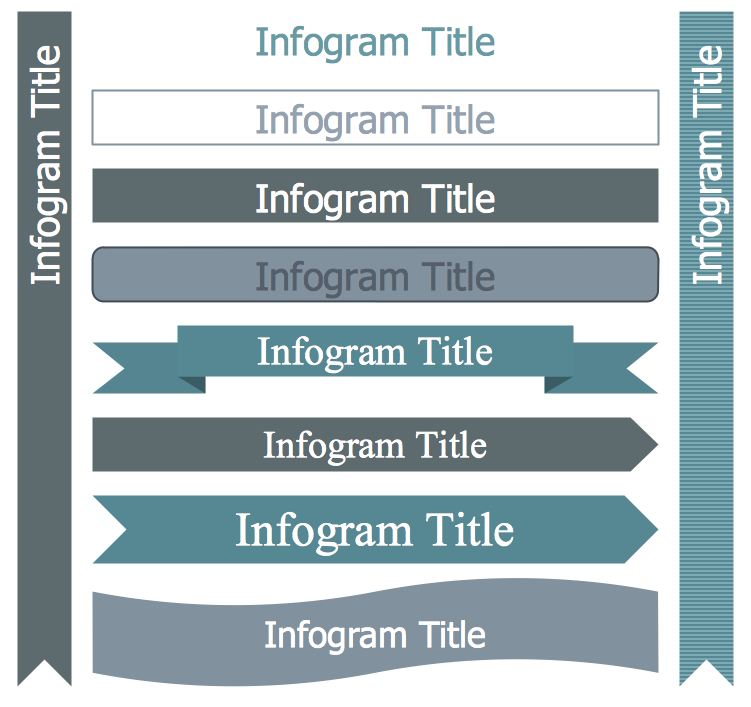
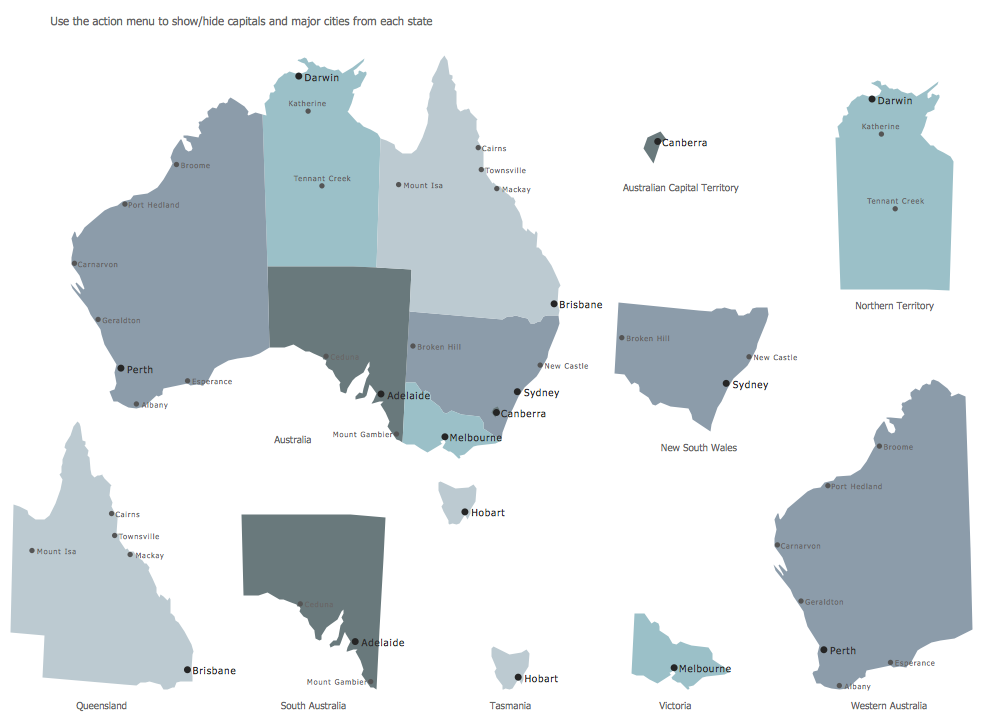
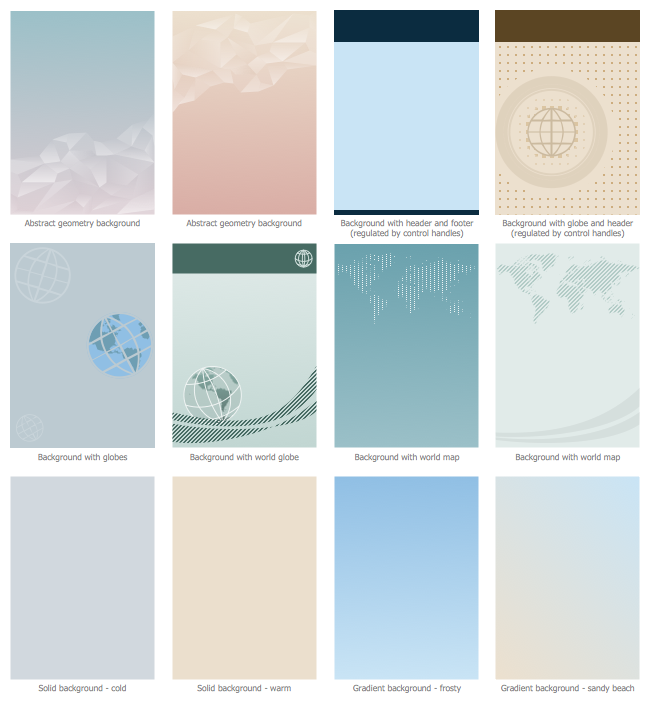
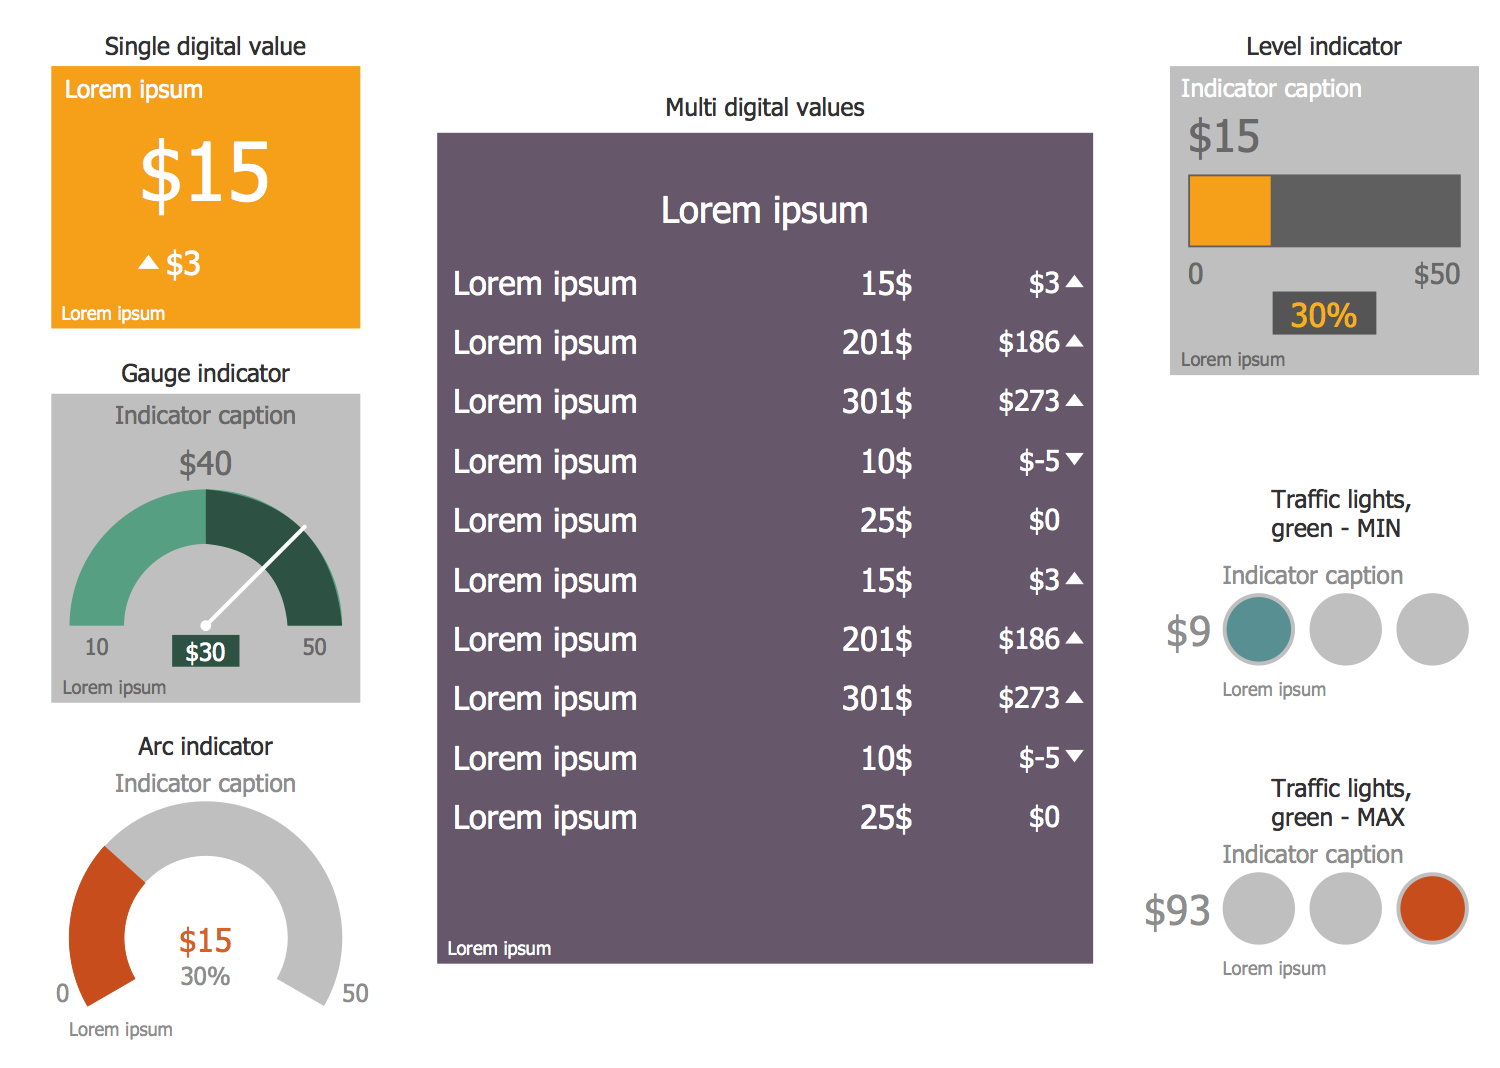
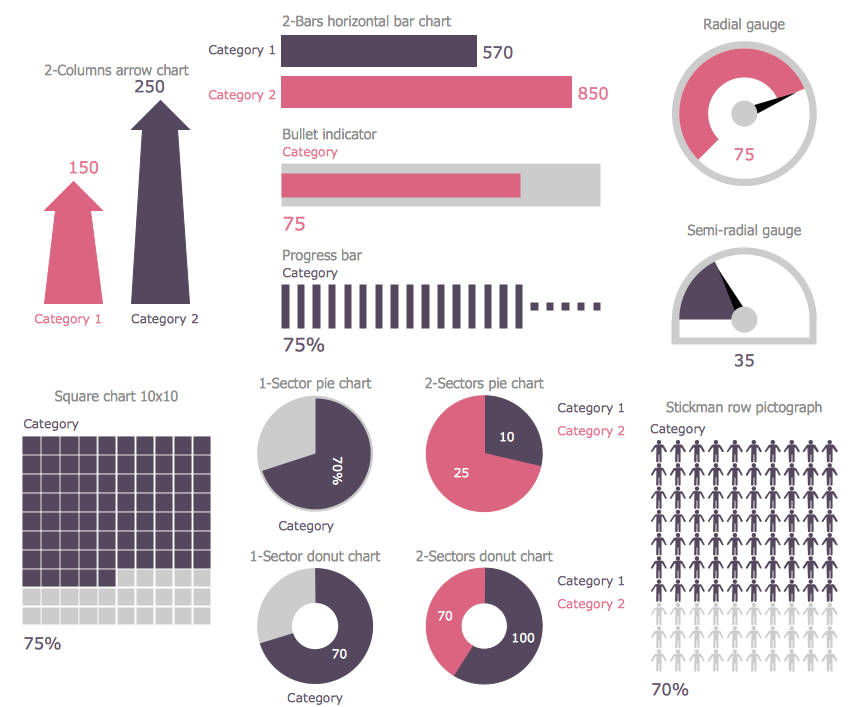
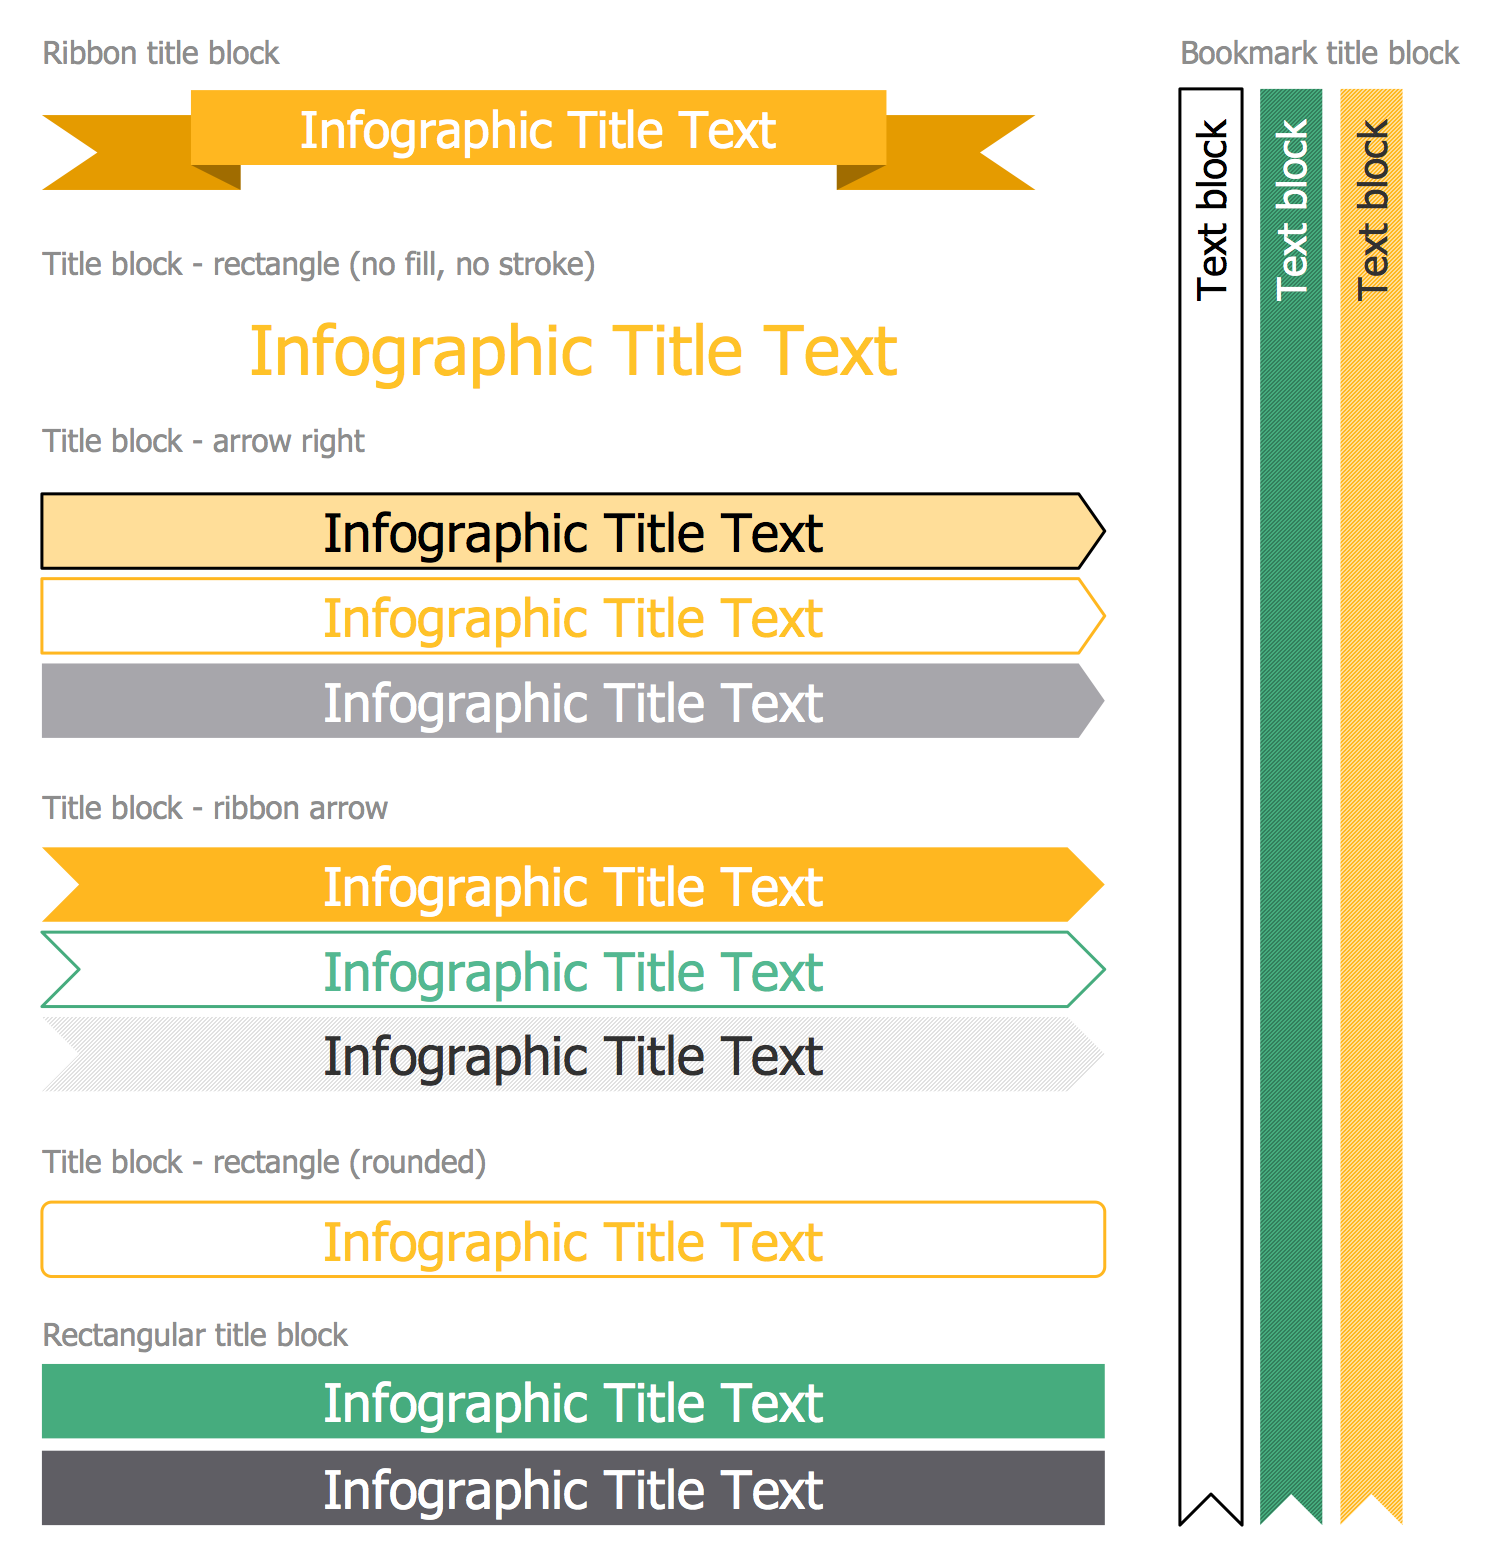
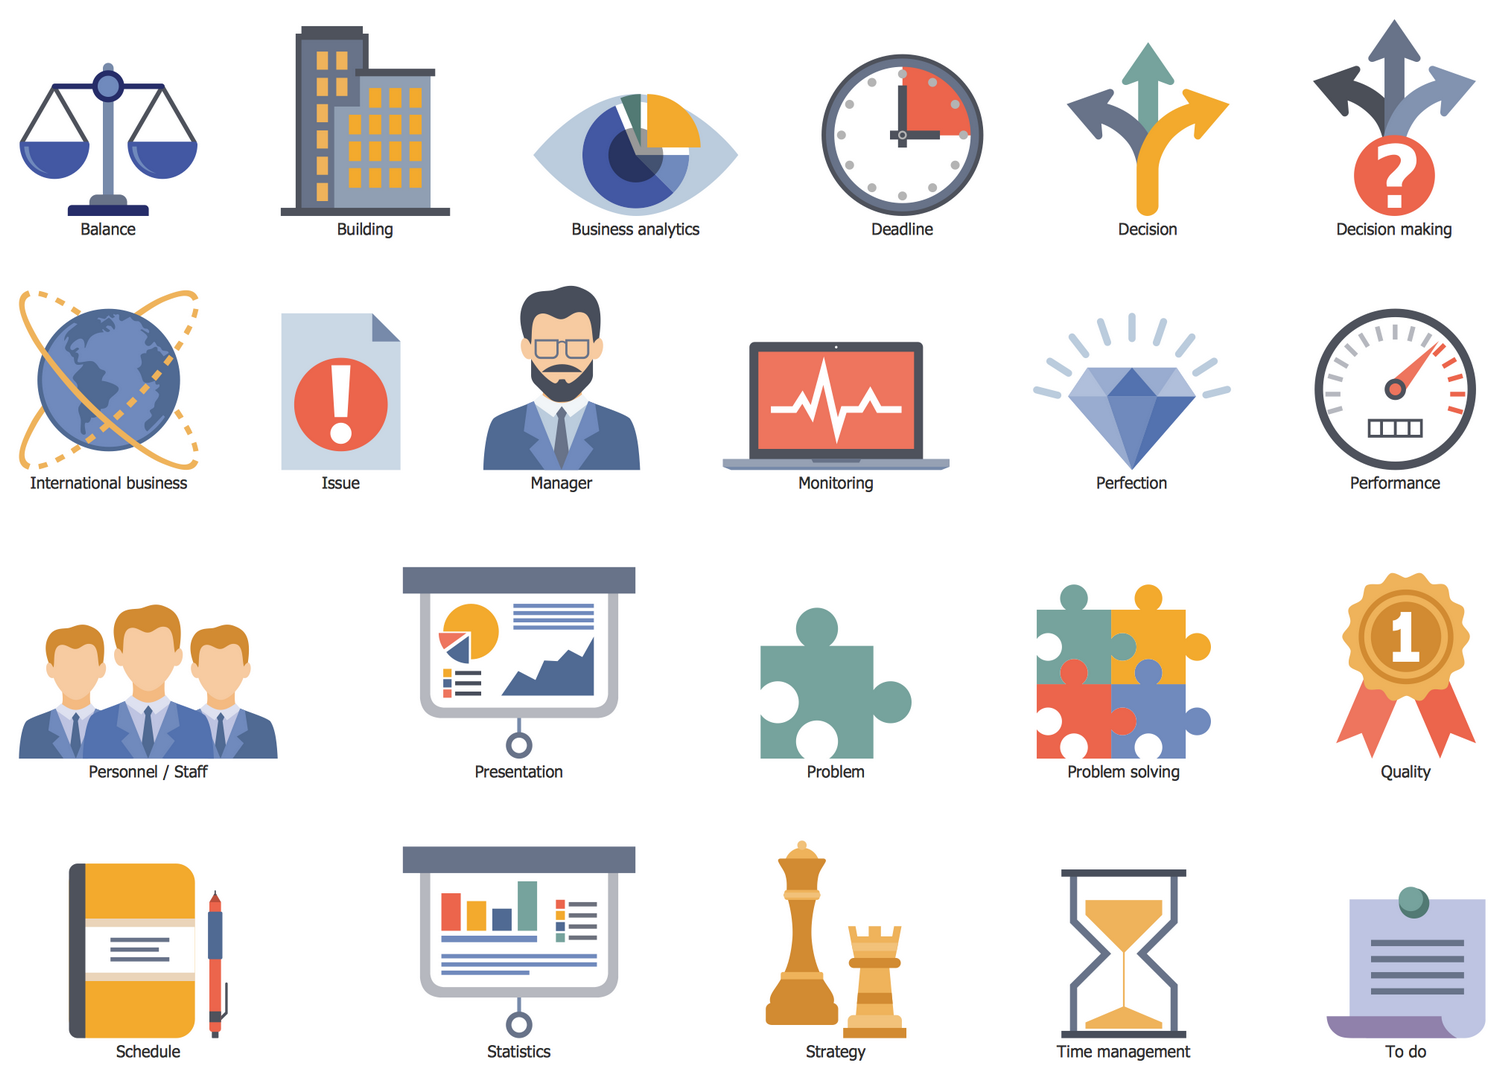
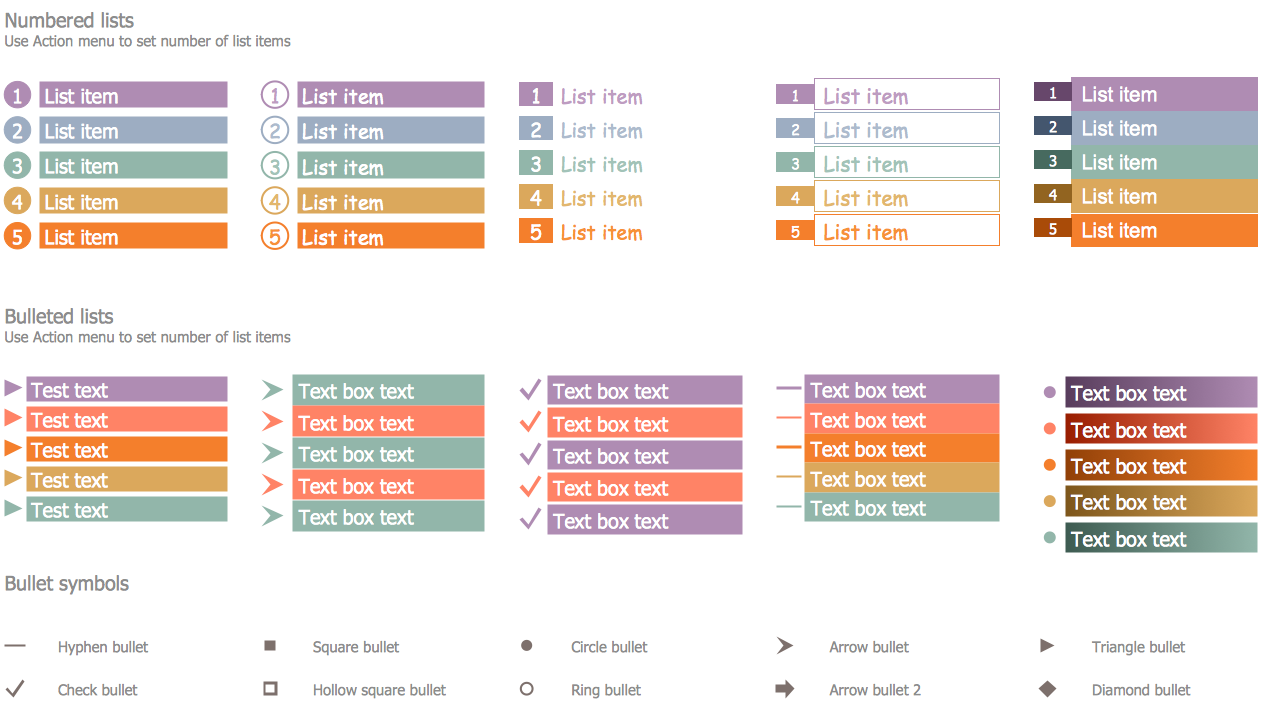
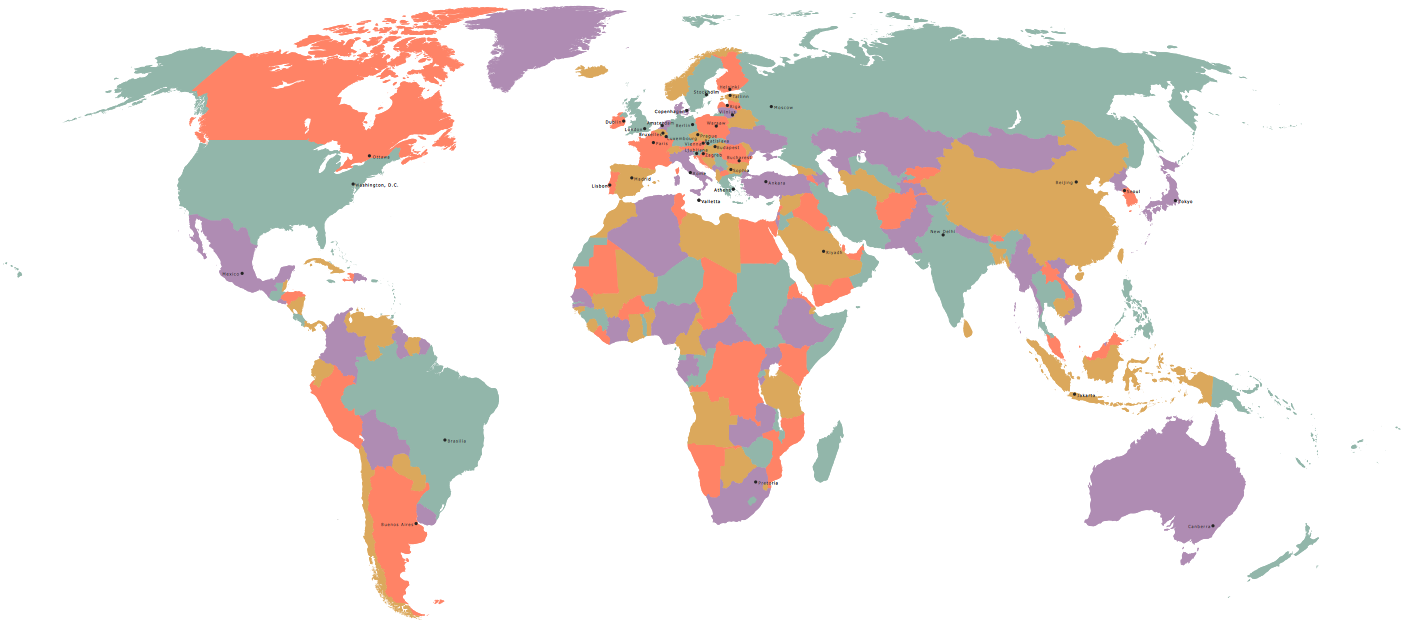
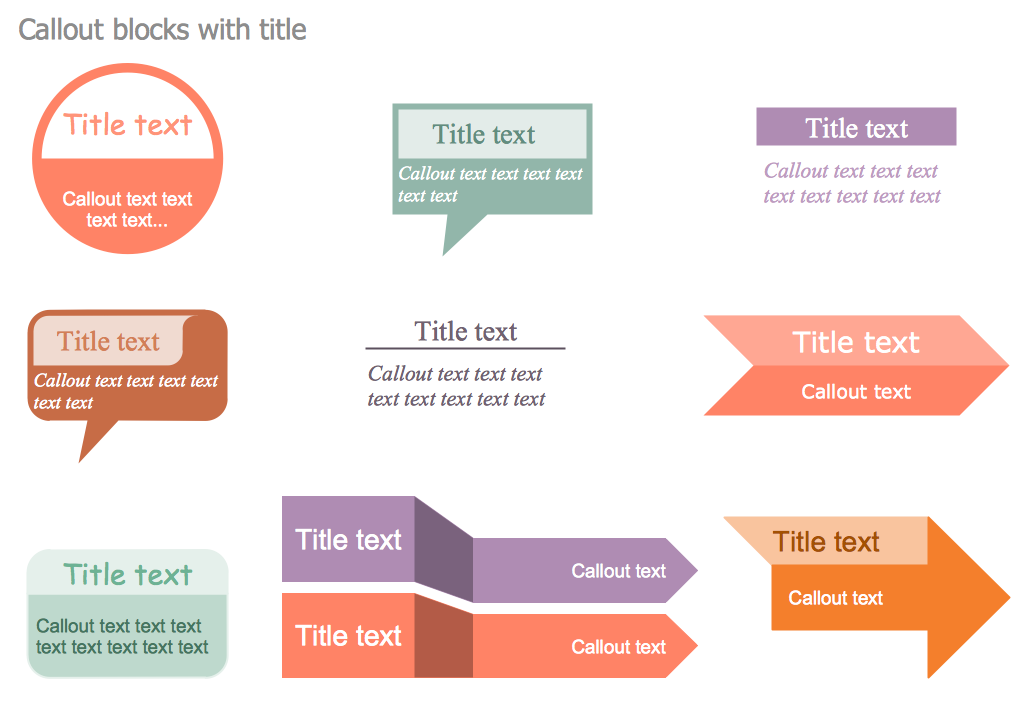
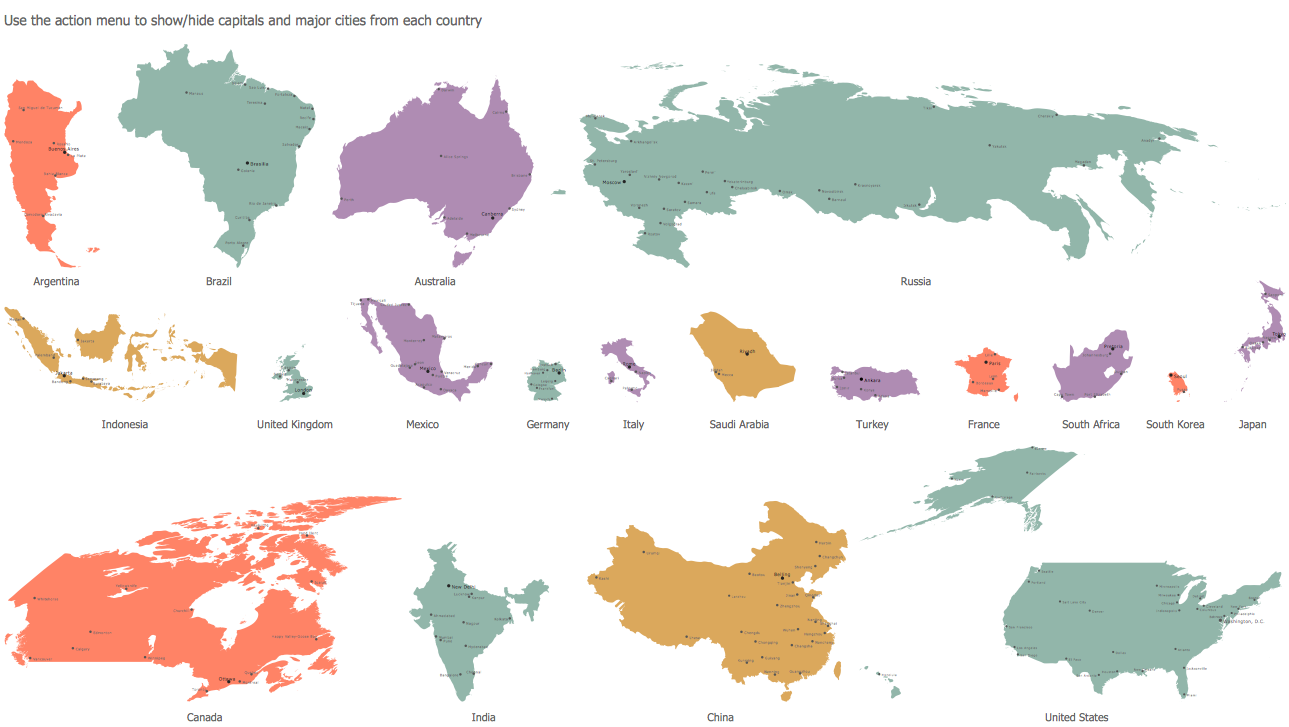
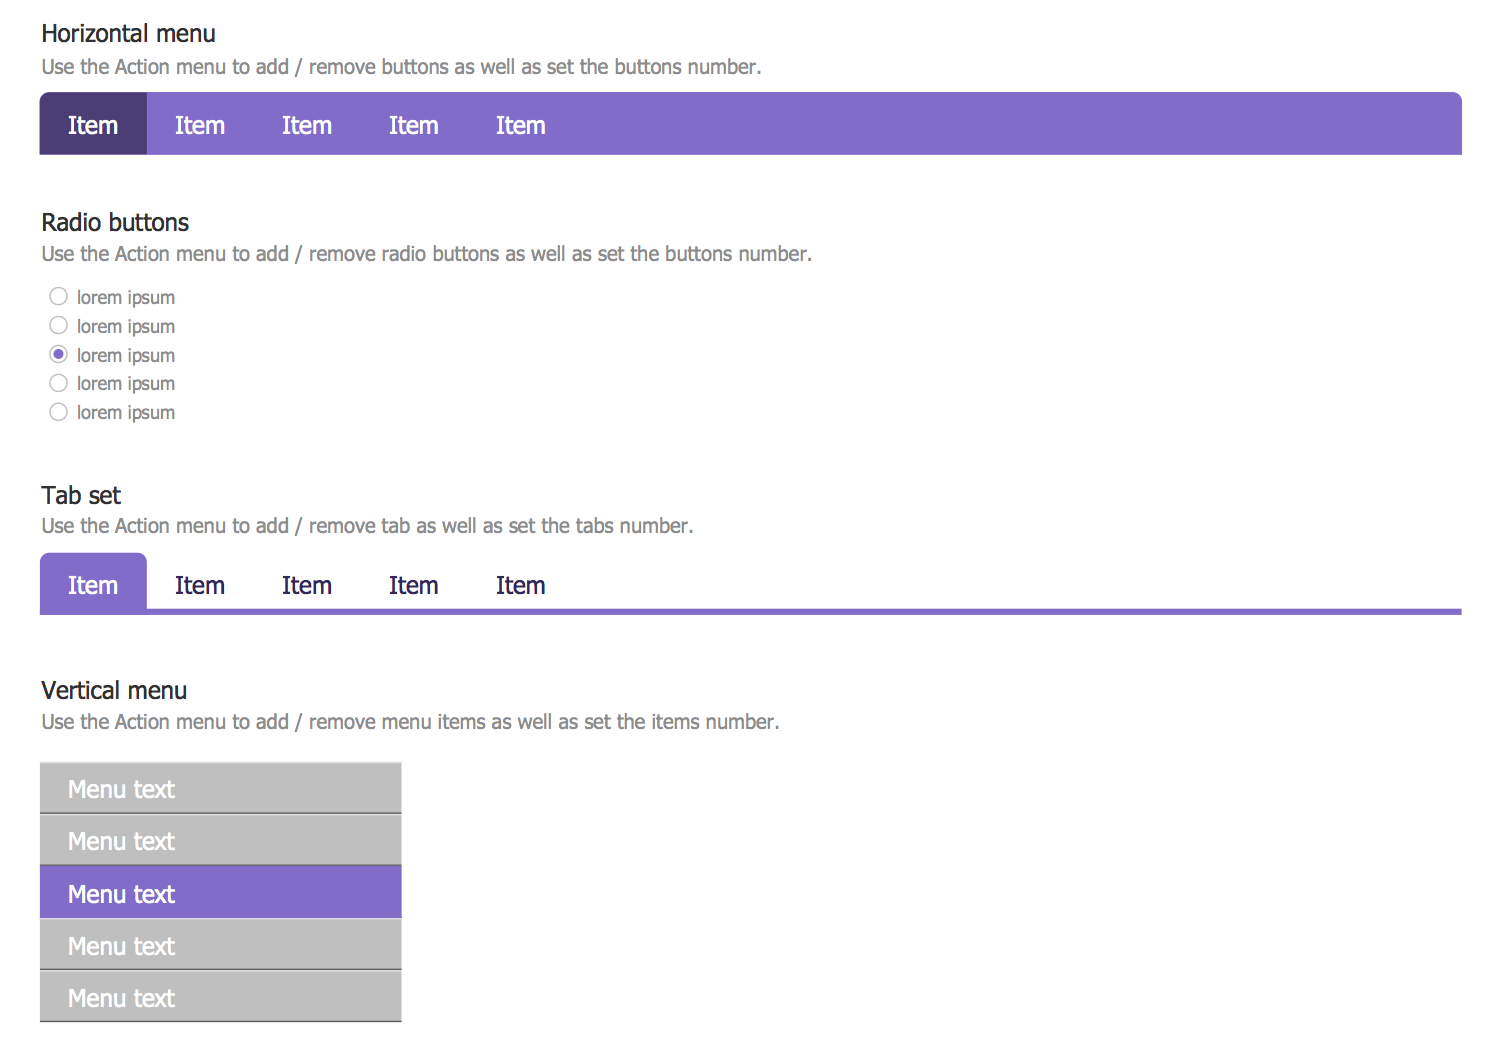
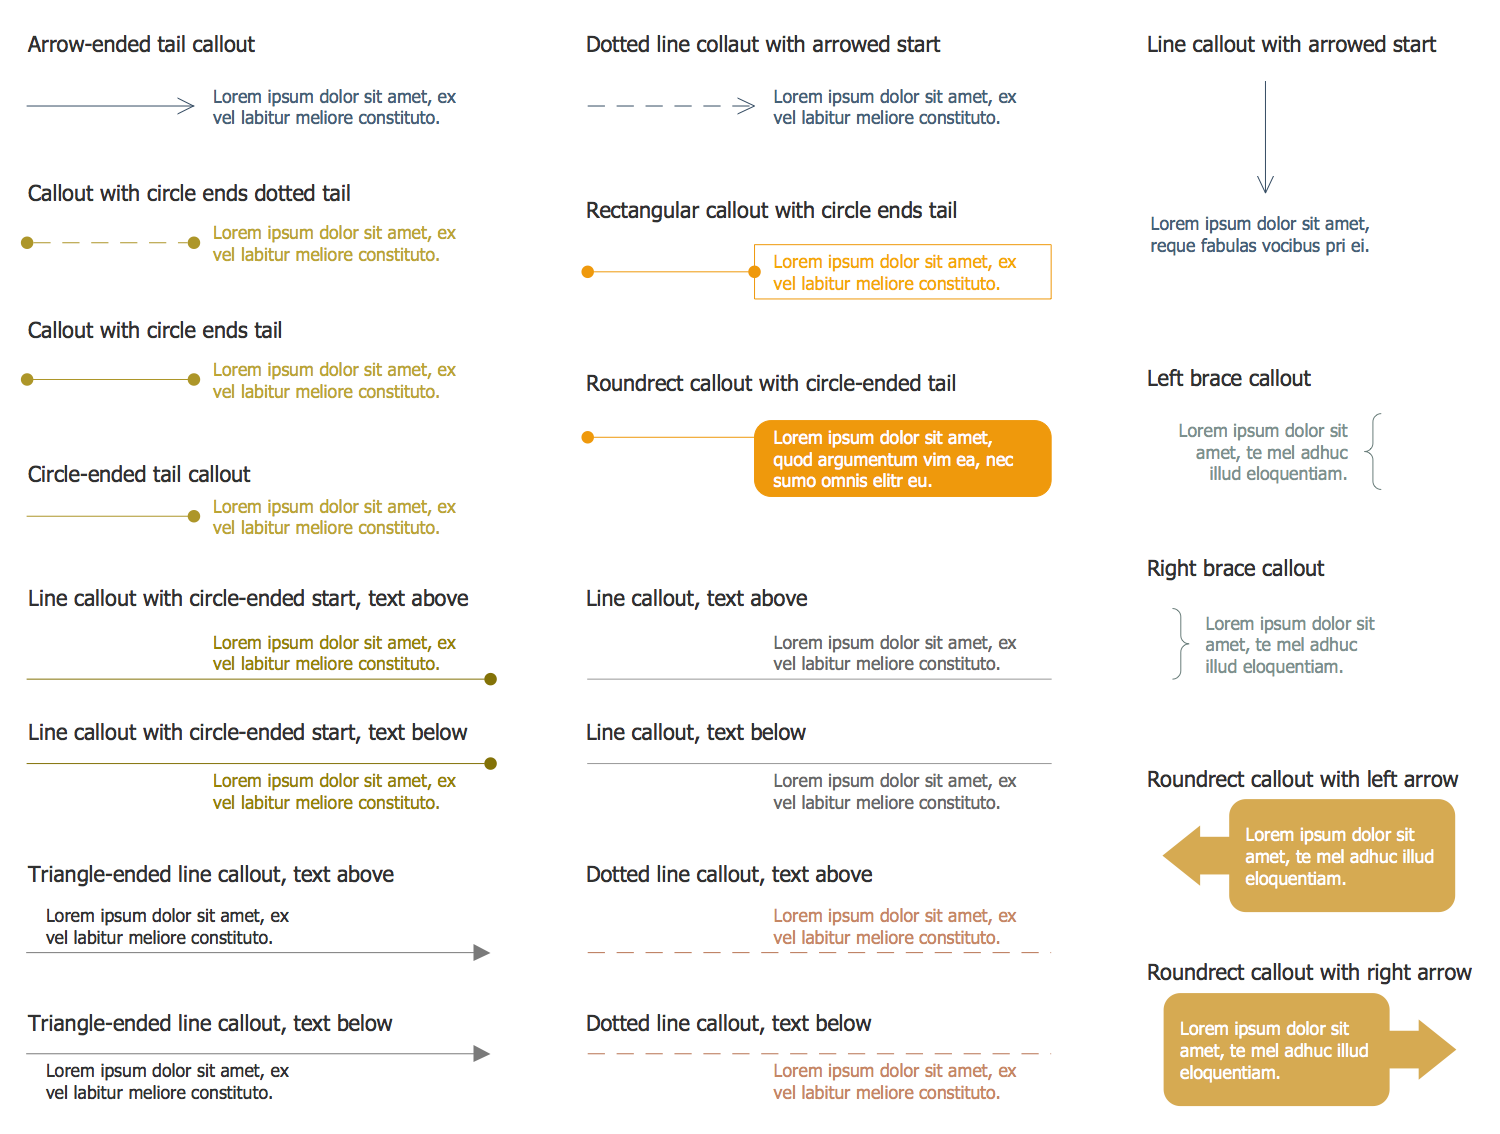
Management Infographics Solution
For those who need to convey an important business idea or management process in a concise, attractive visual manner.
There are 14 stencil libraries containing 364 vector objects and 10 examples in the Management Infographics solution.
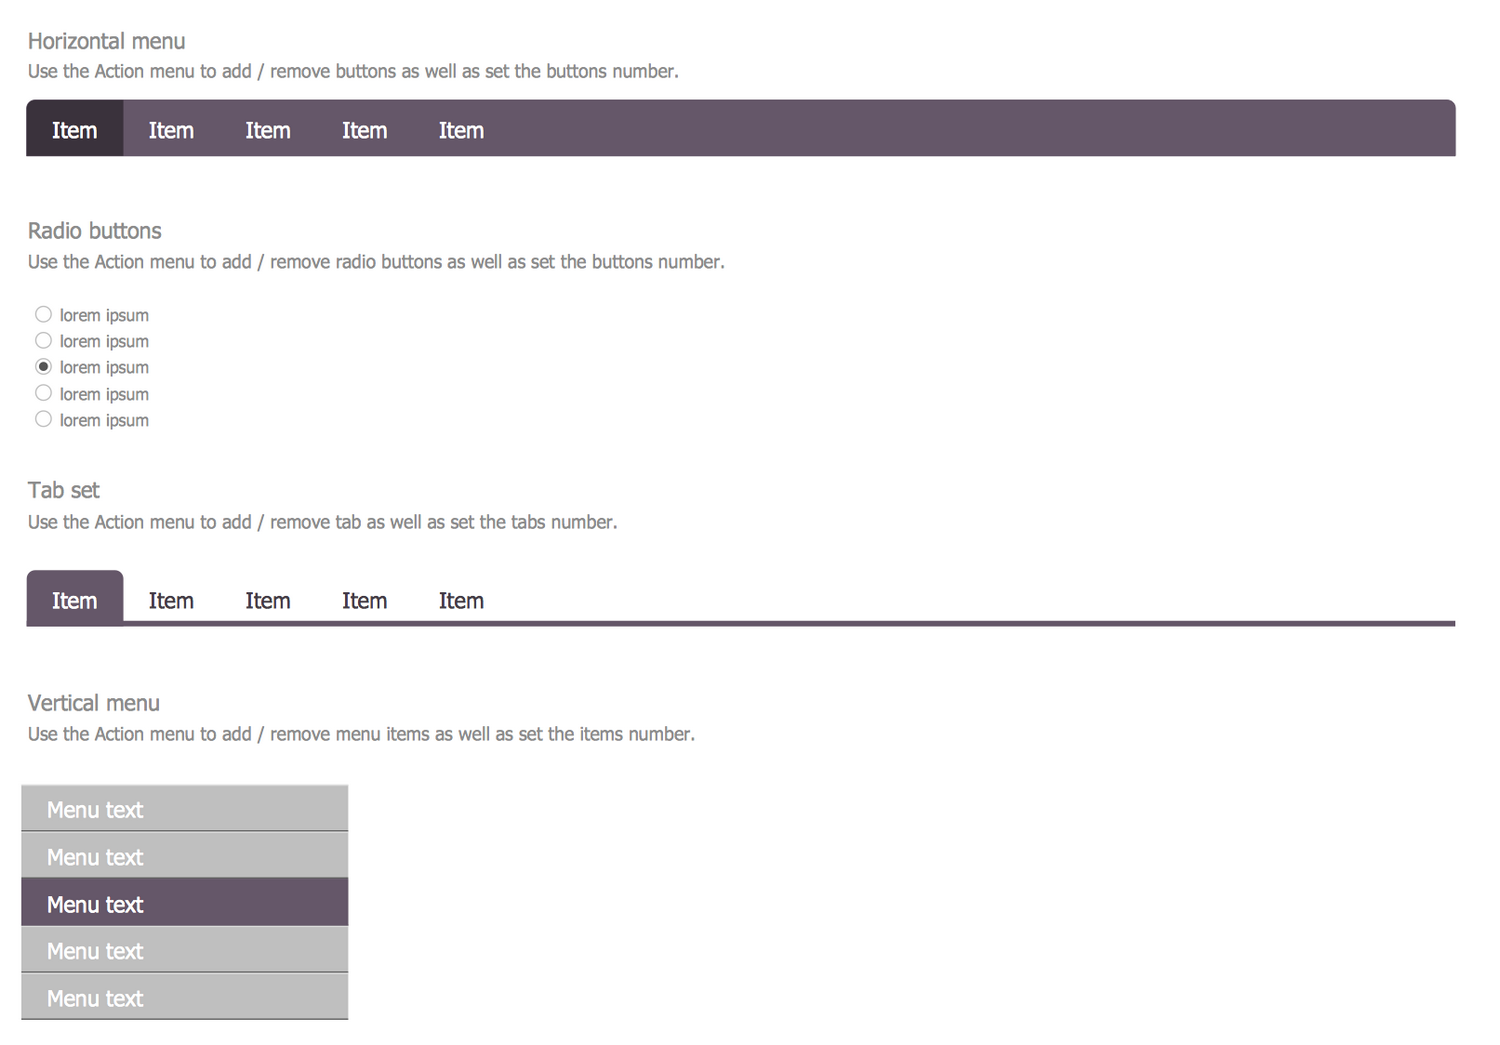
Design Elements — Management Pictograms
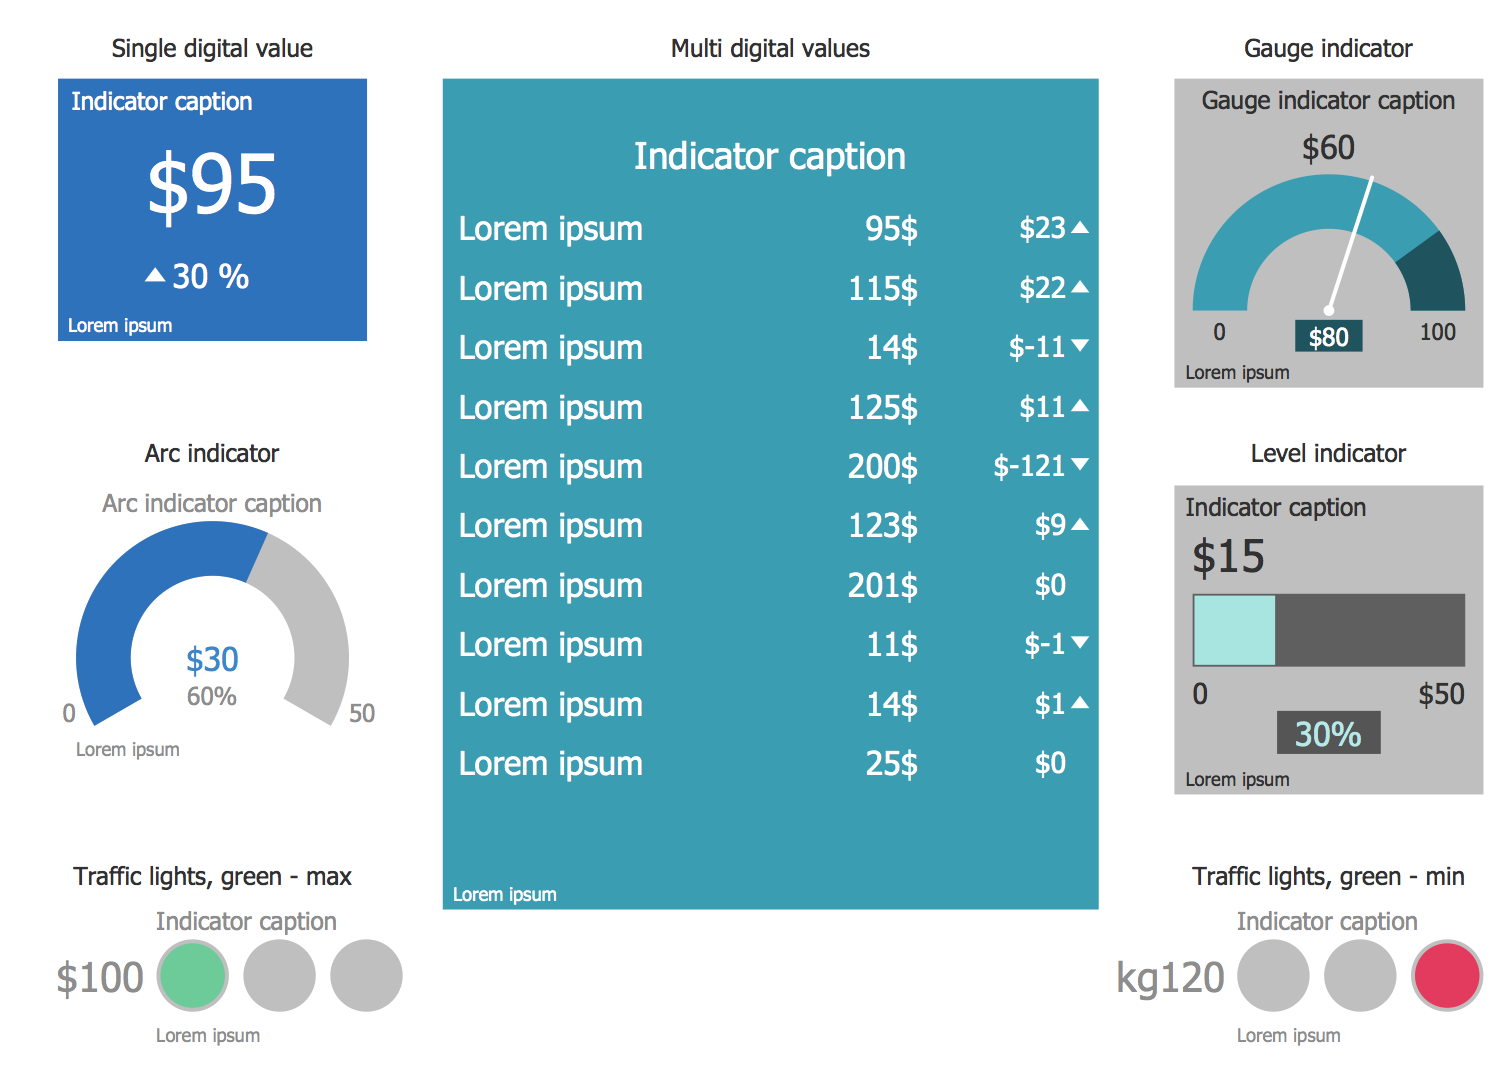
Design Elements — Management Indicators
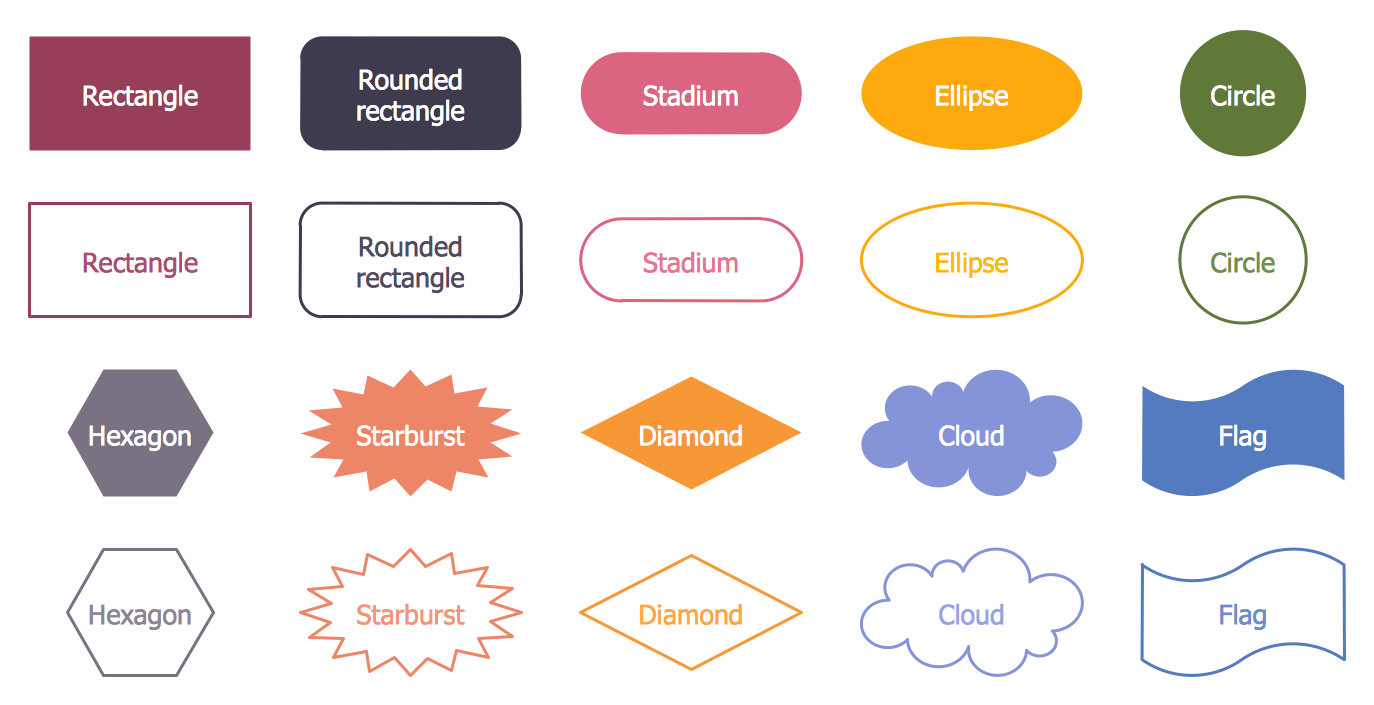
Design Elements — Management Diagram
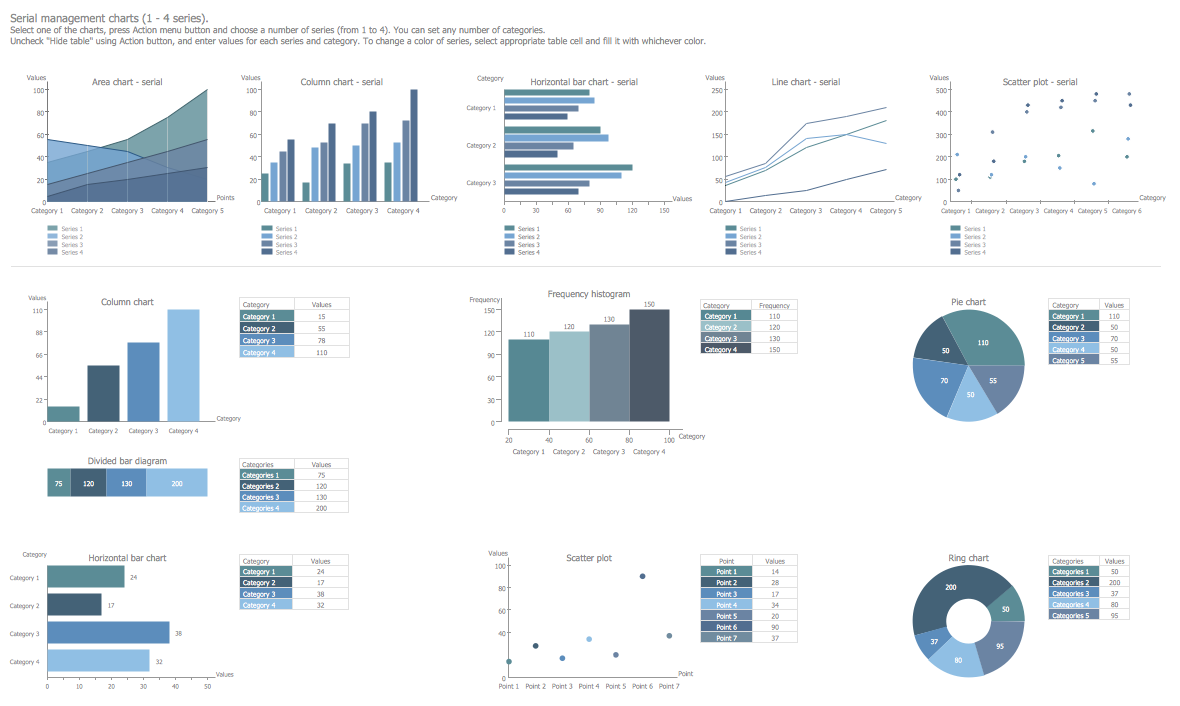
Design Elements — Management Charts
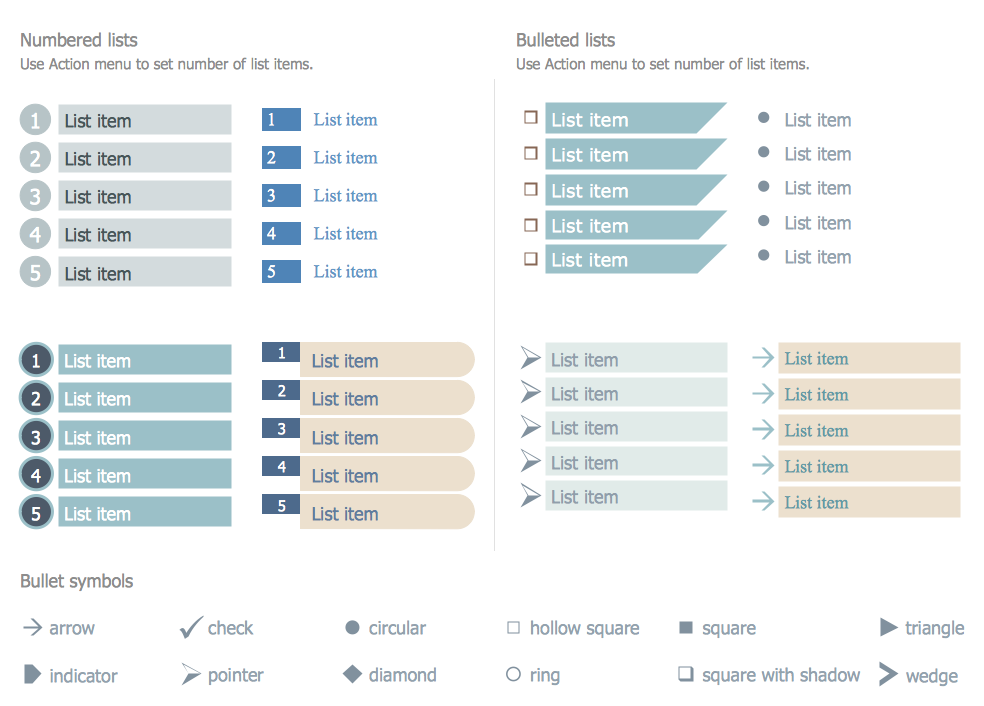
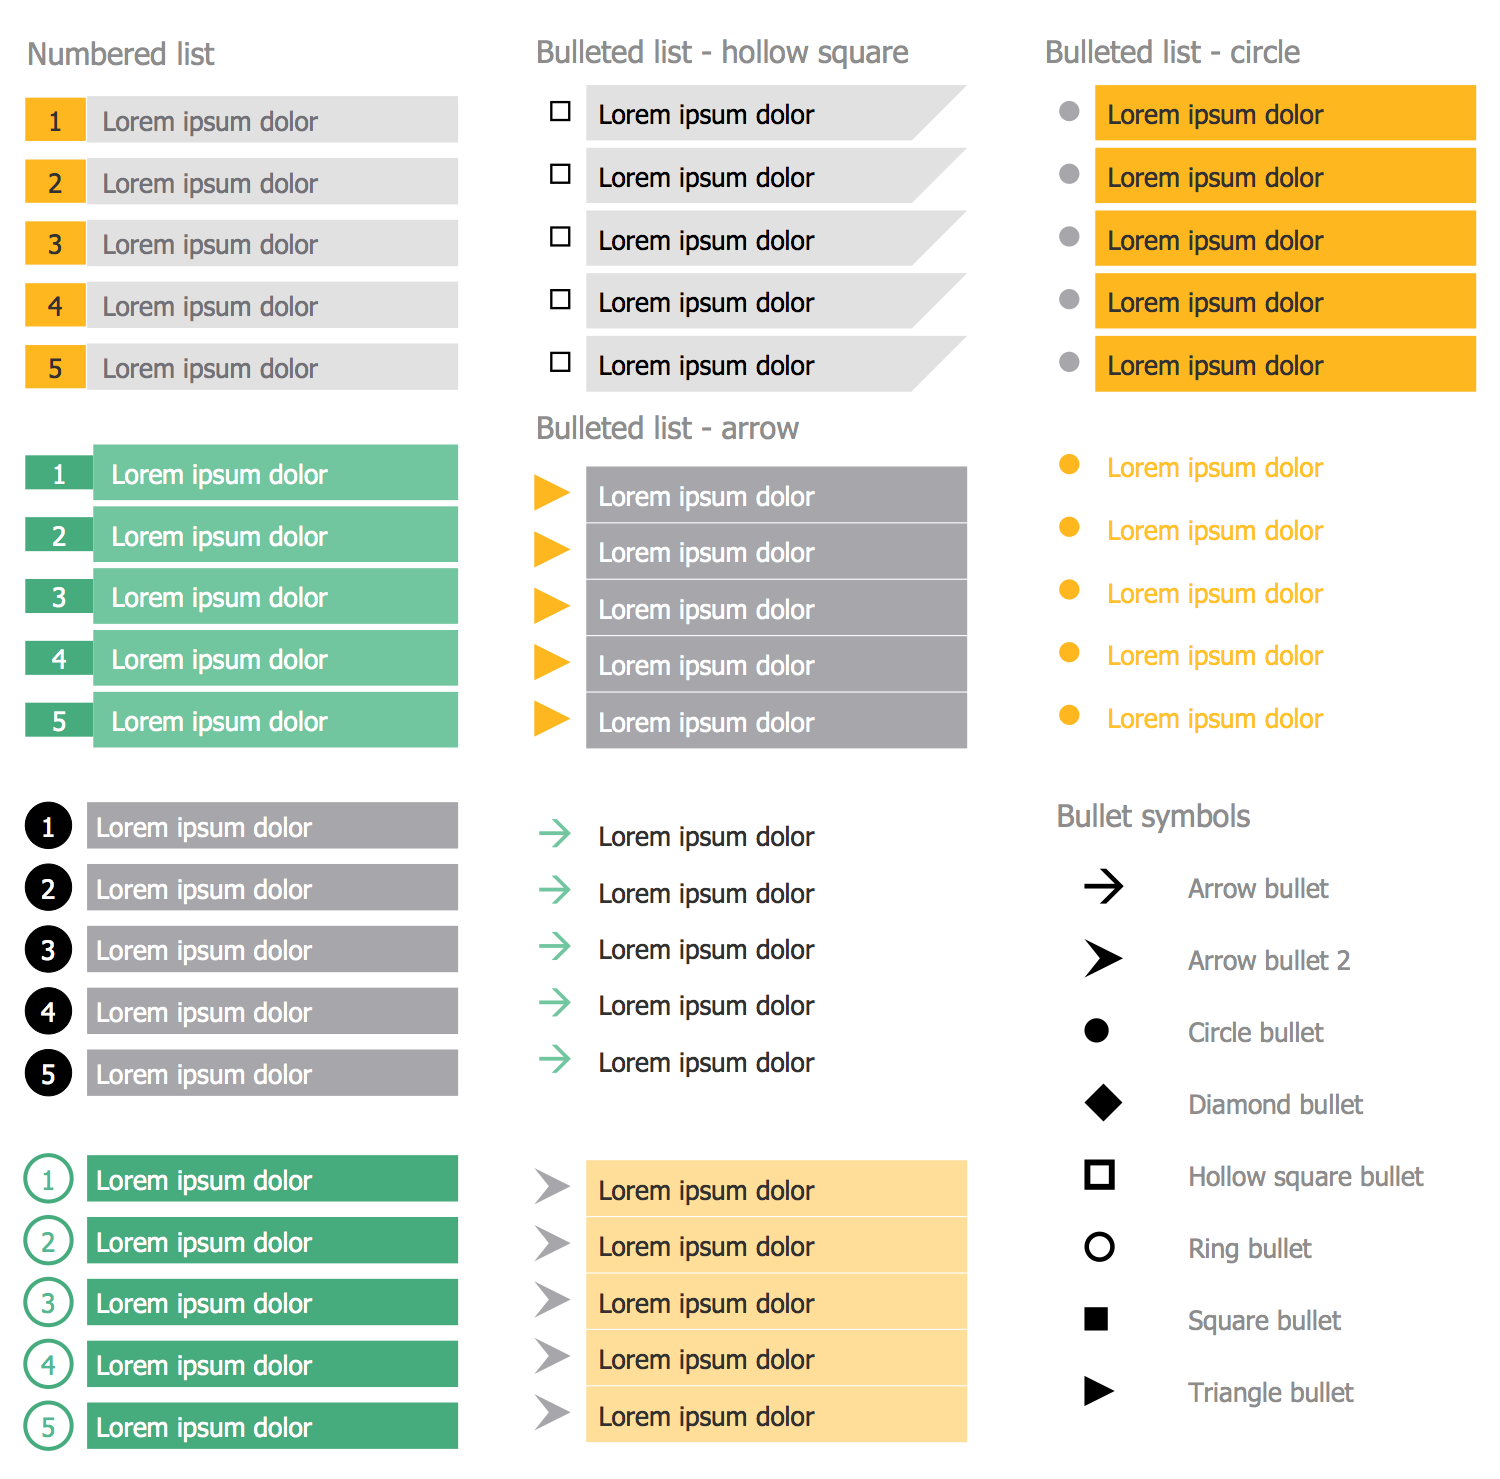
Design Elements — Management List Blocks
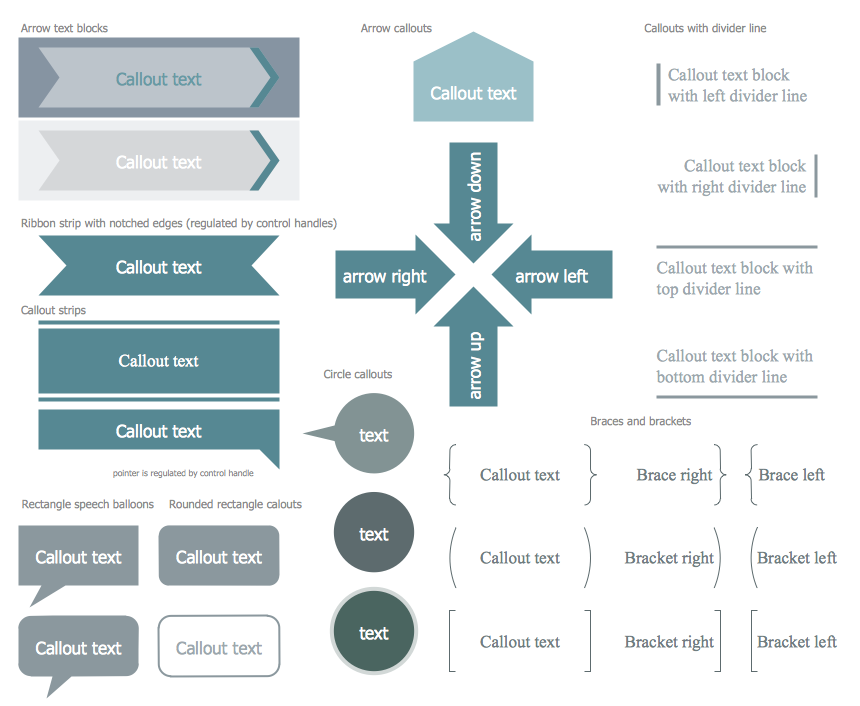
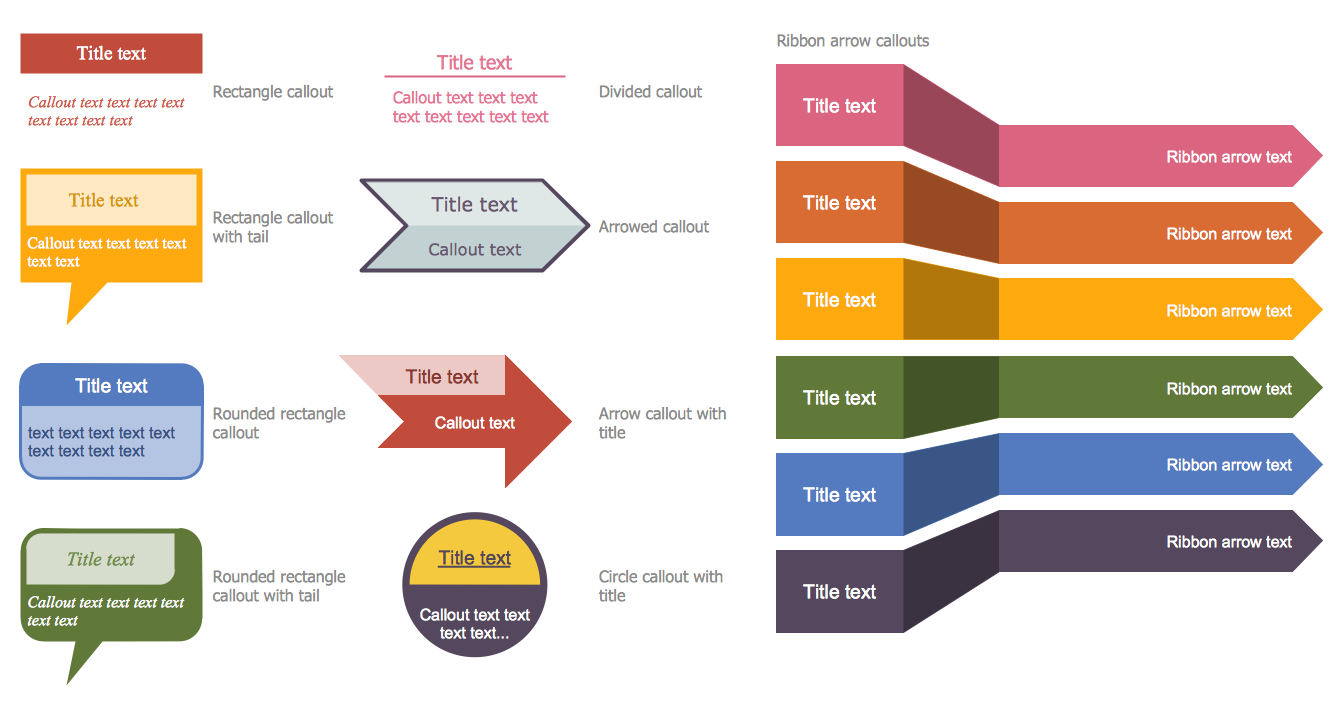
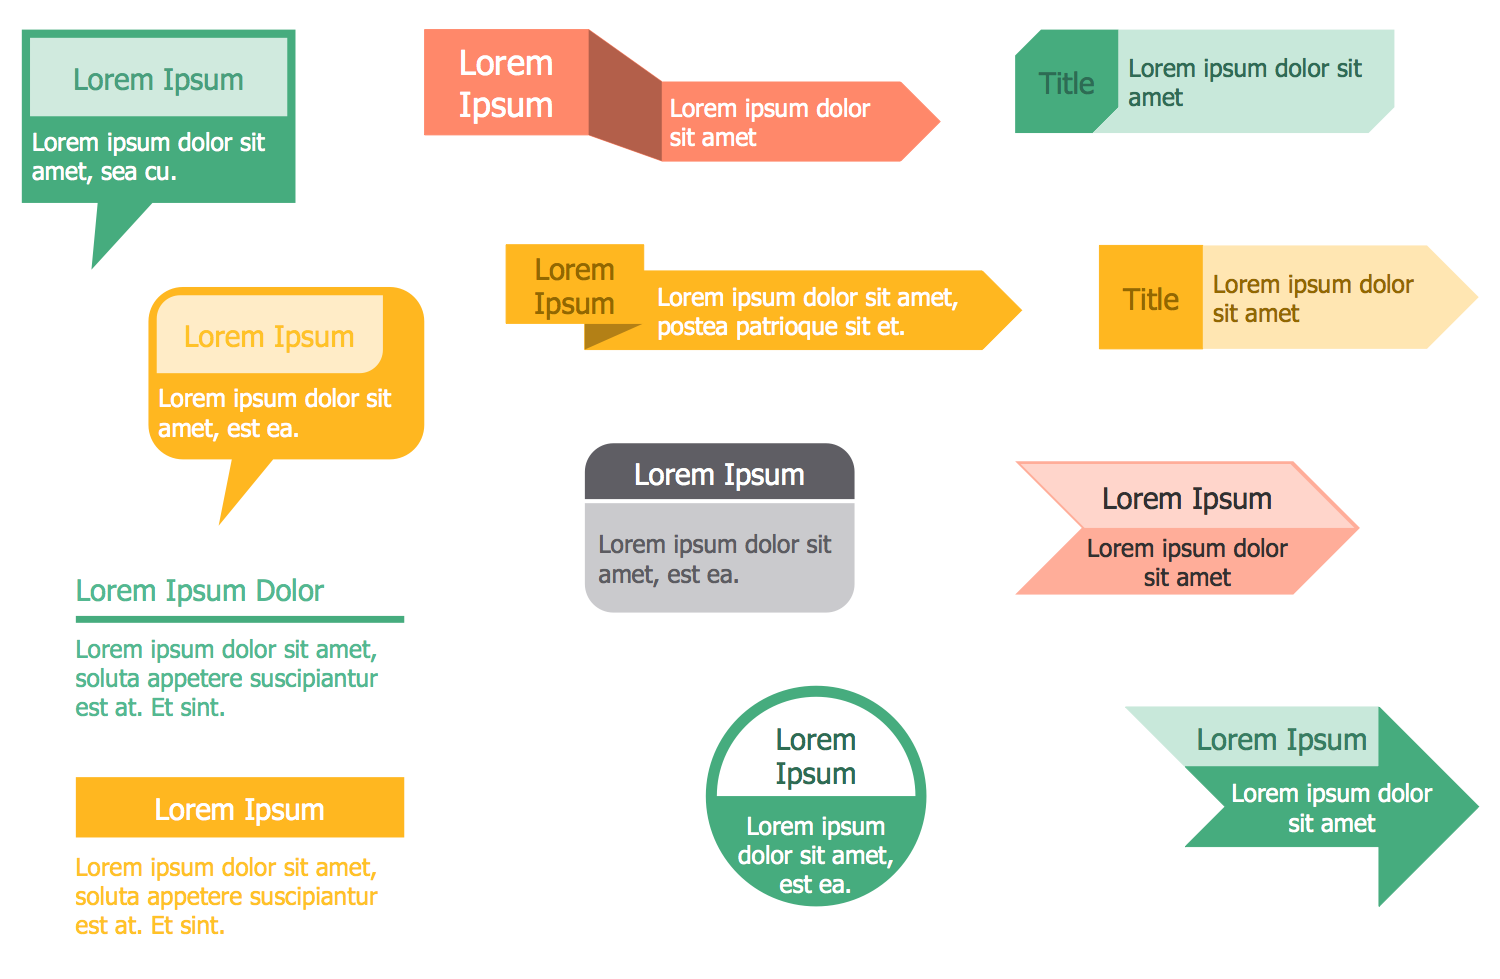
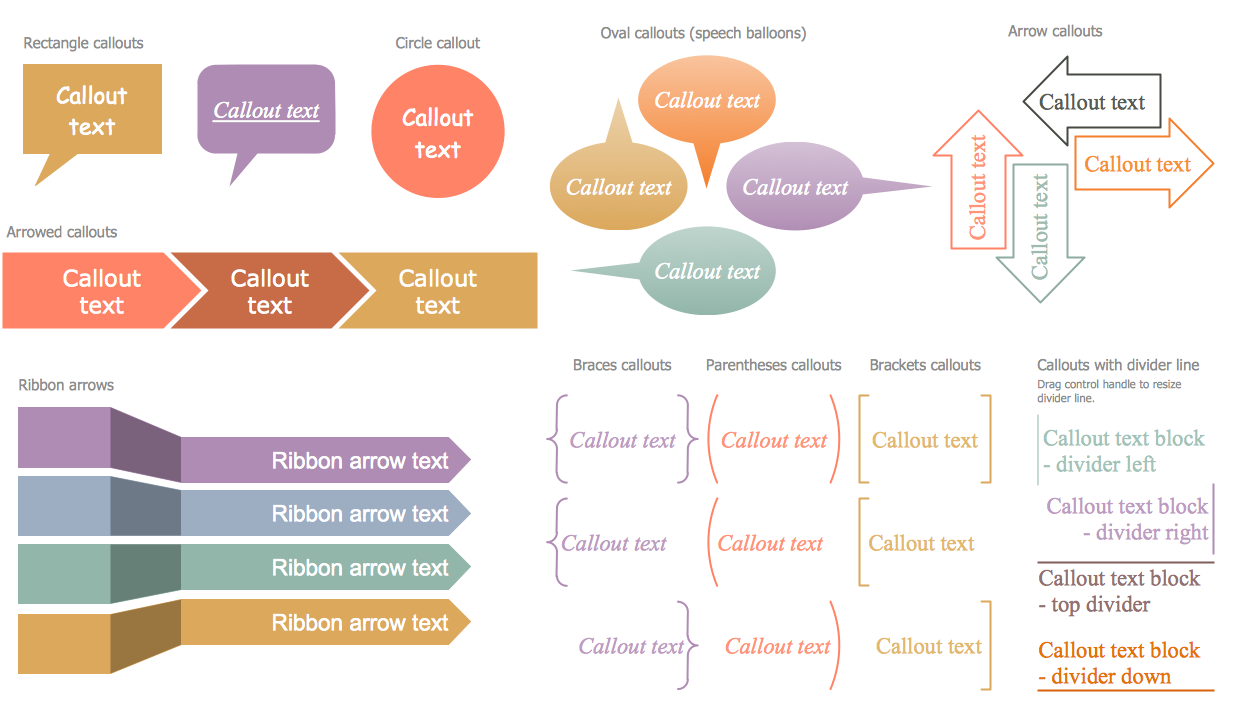
Design Elements — Management Callouts

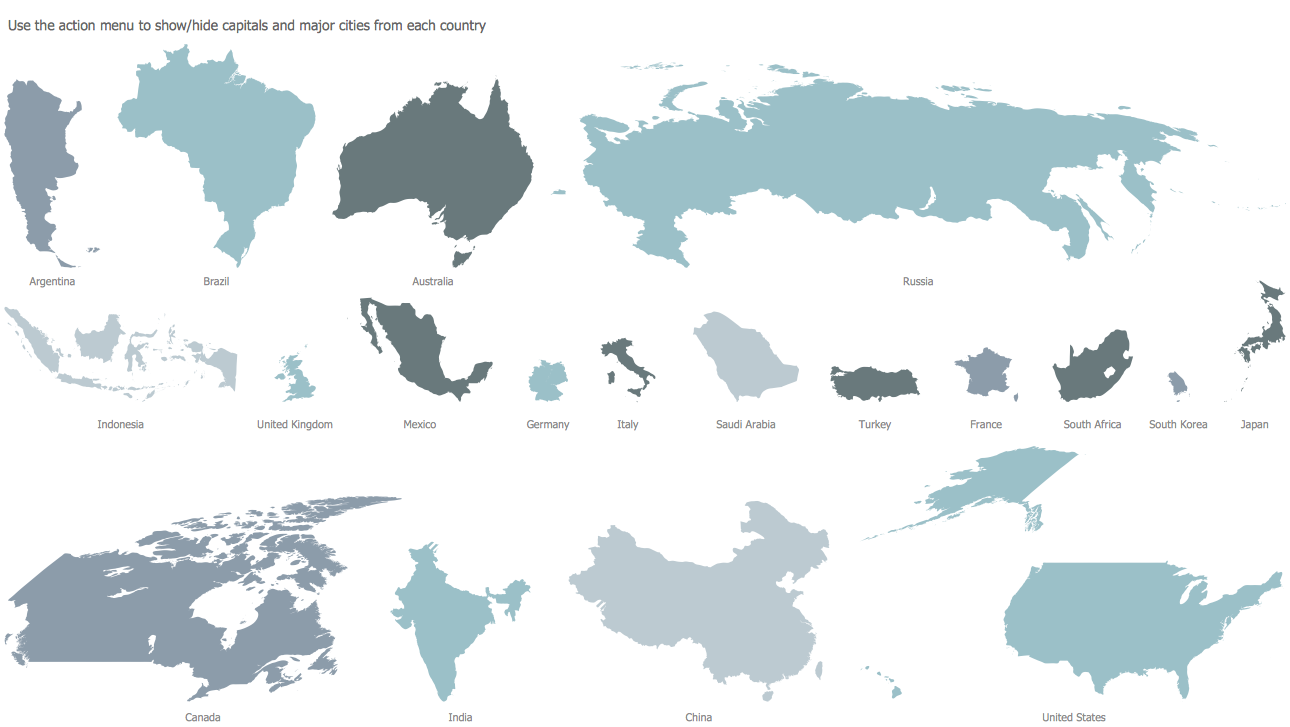
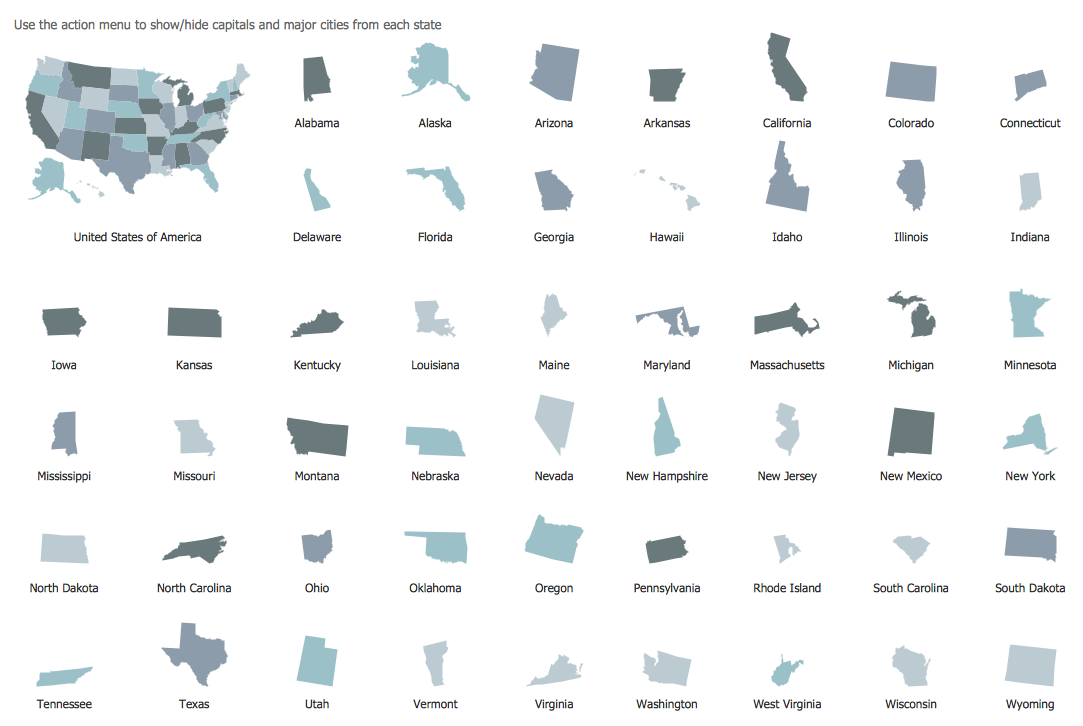
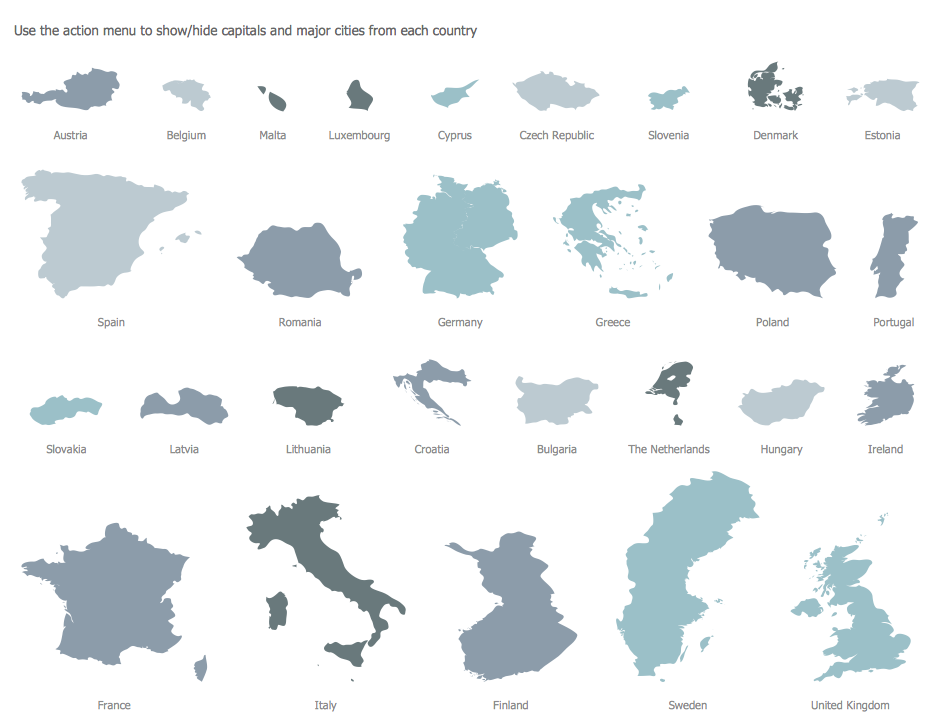
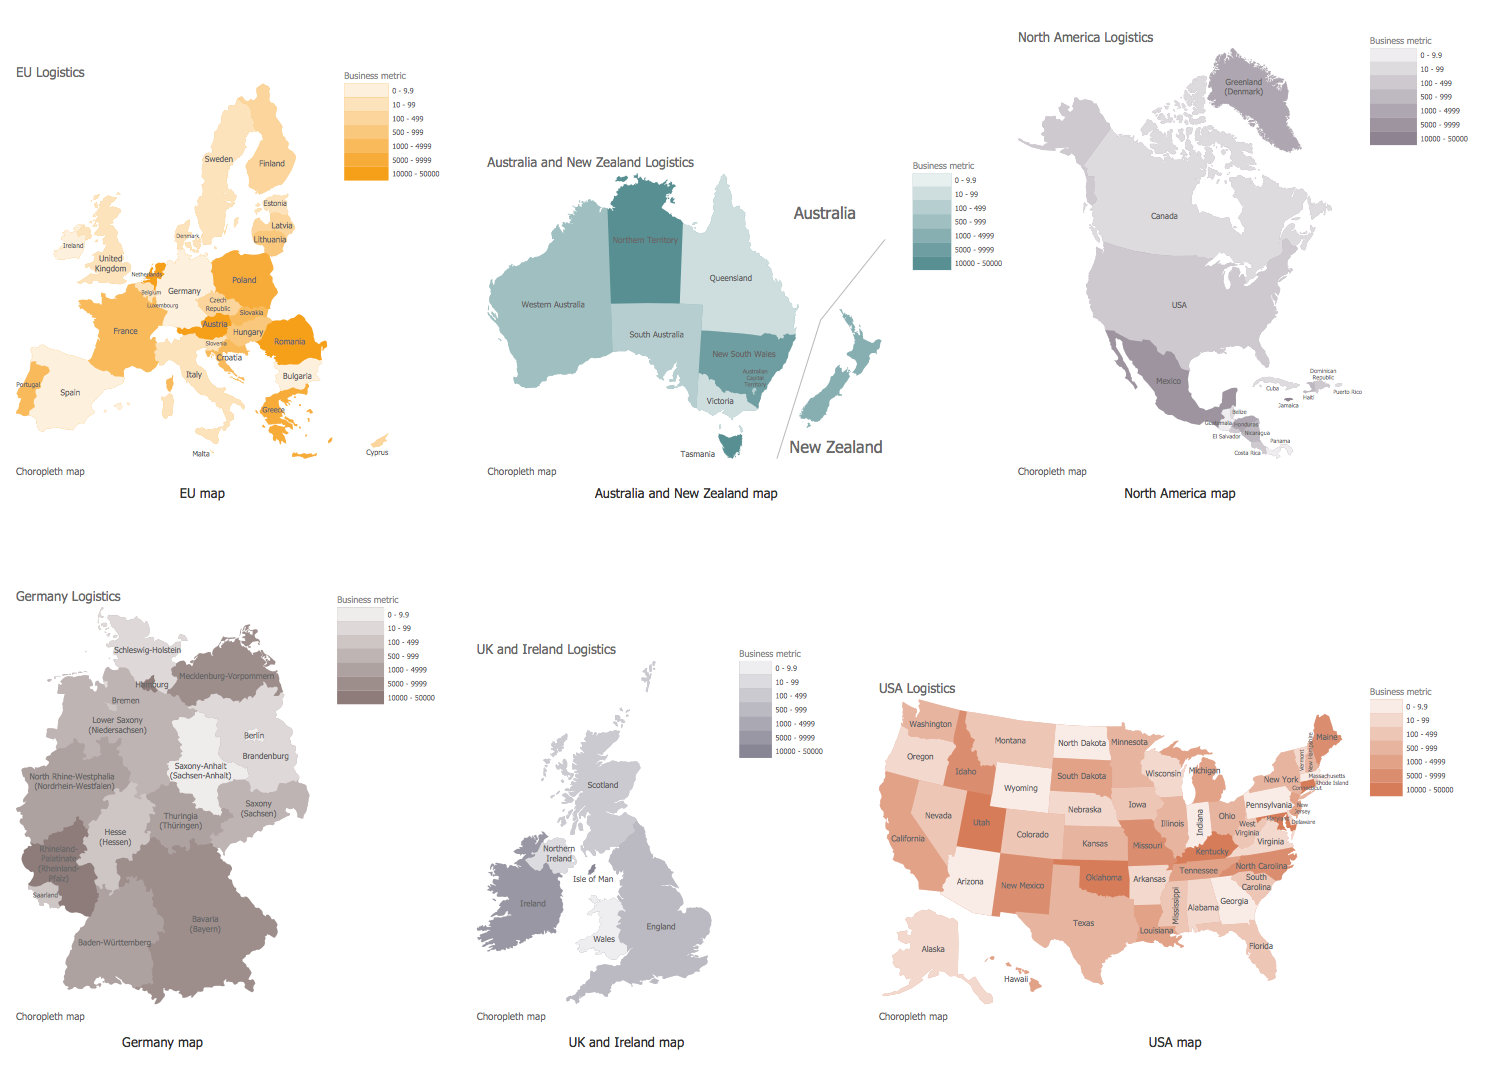
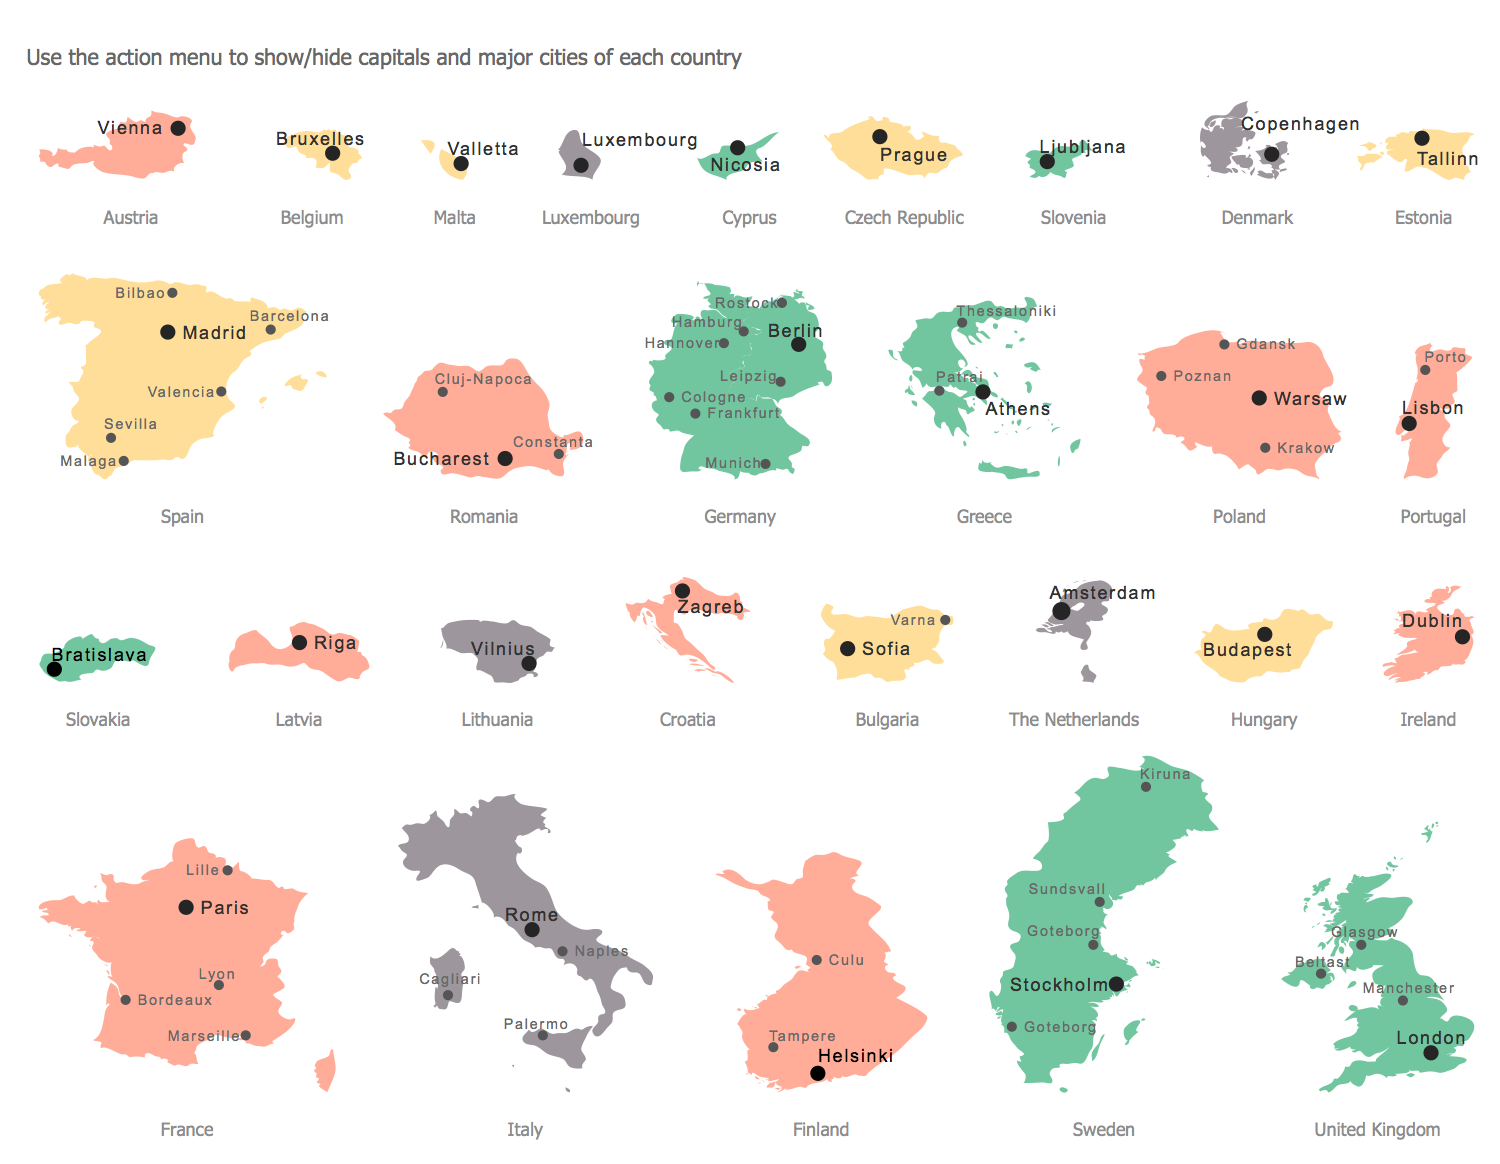
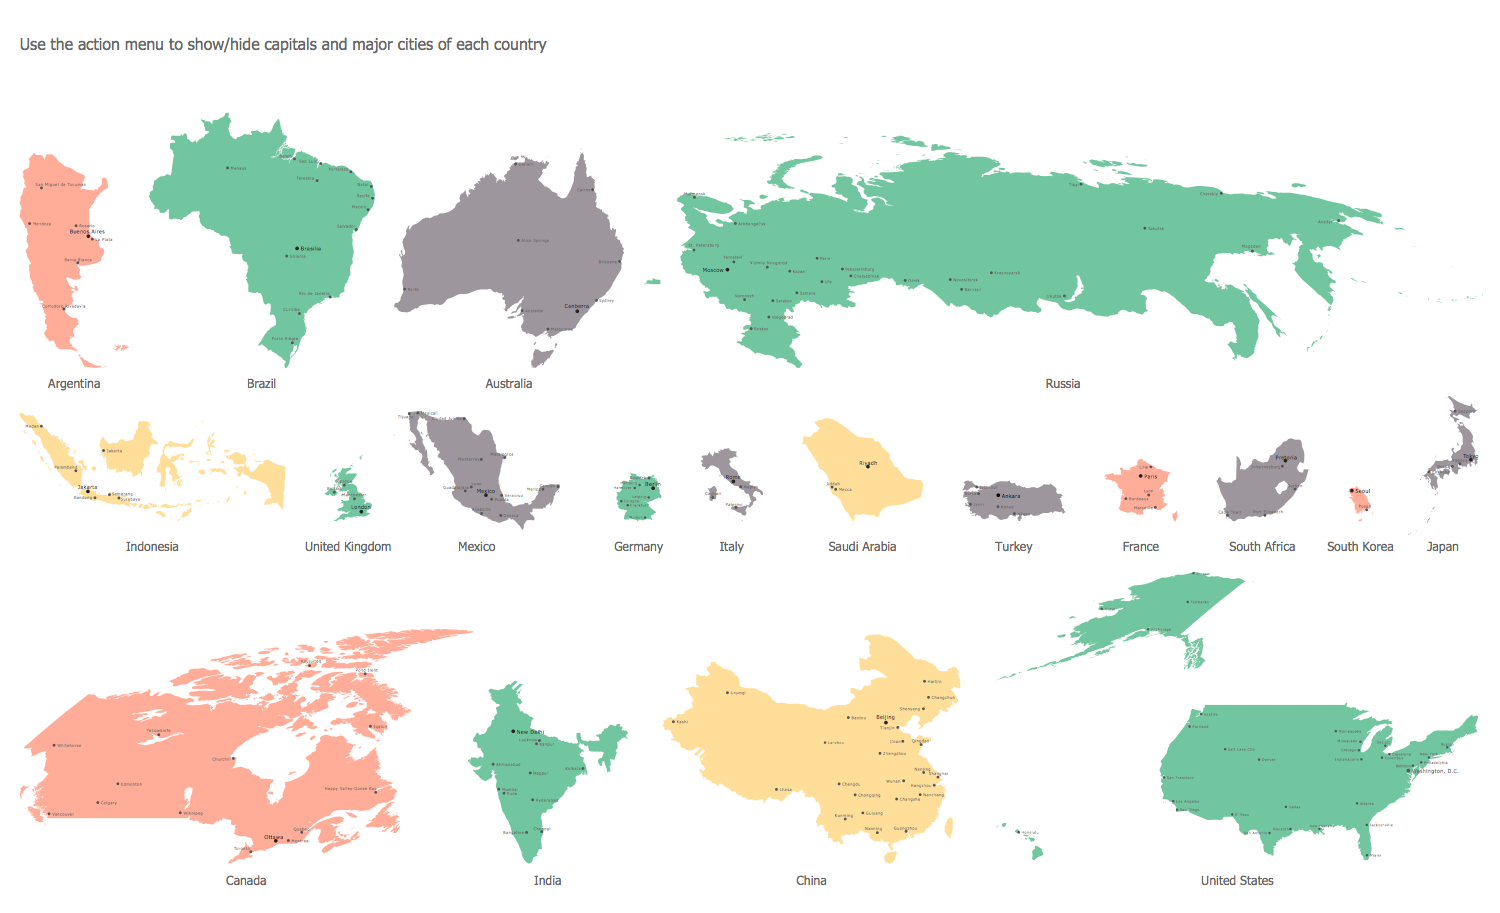
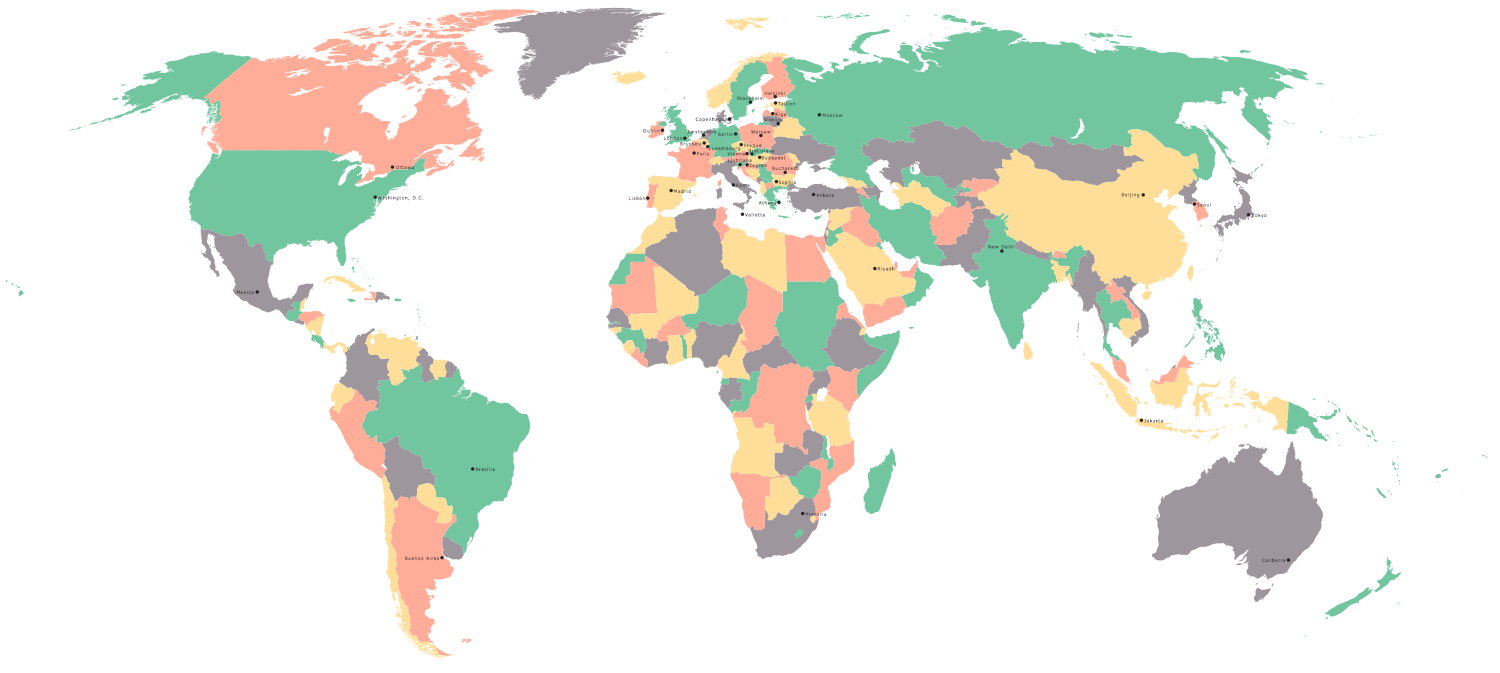
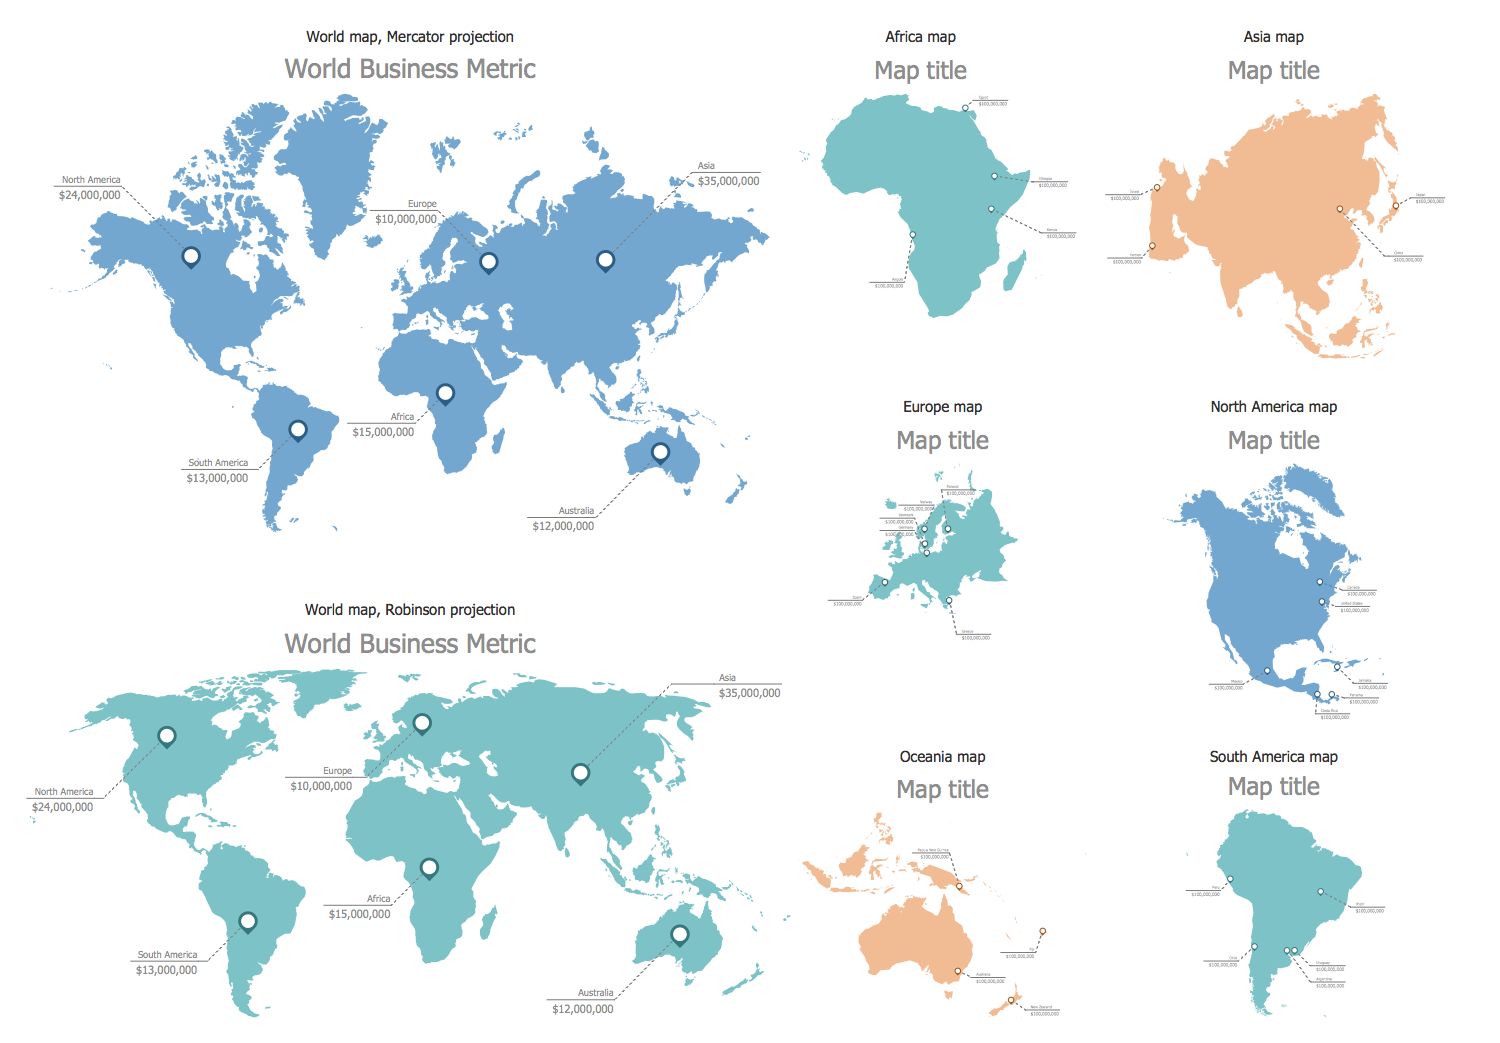
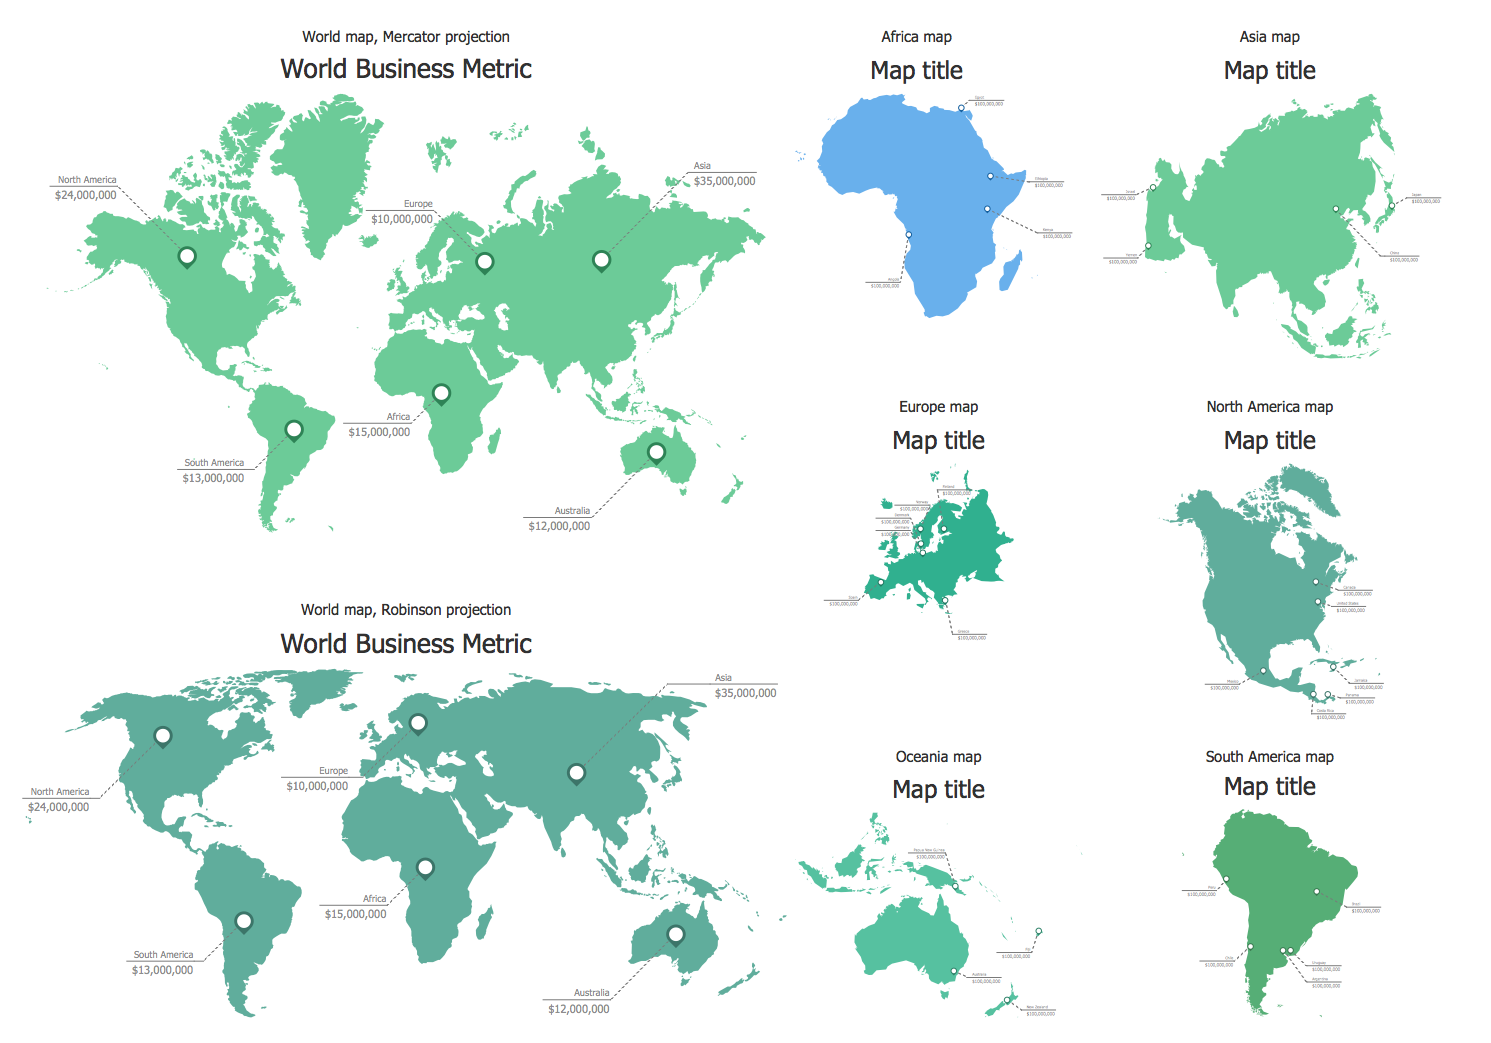
Design Elements — Management World Map
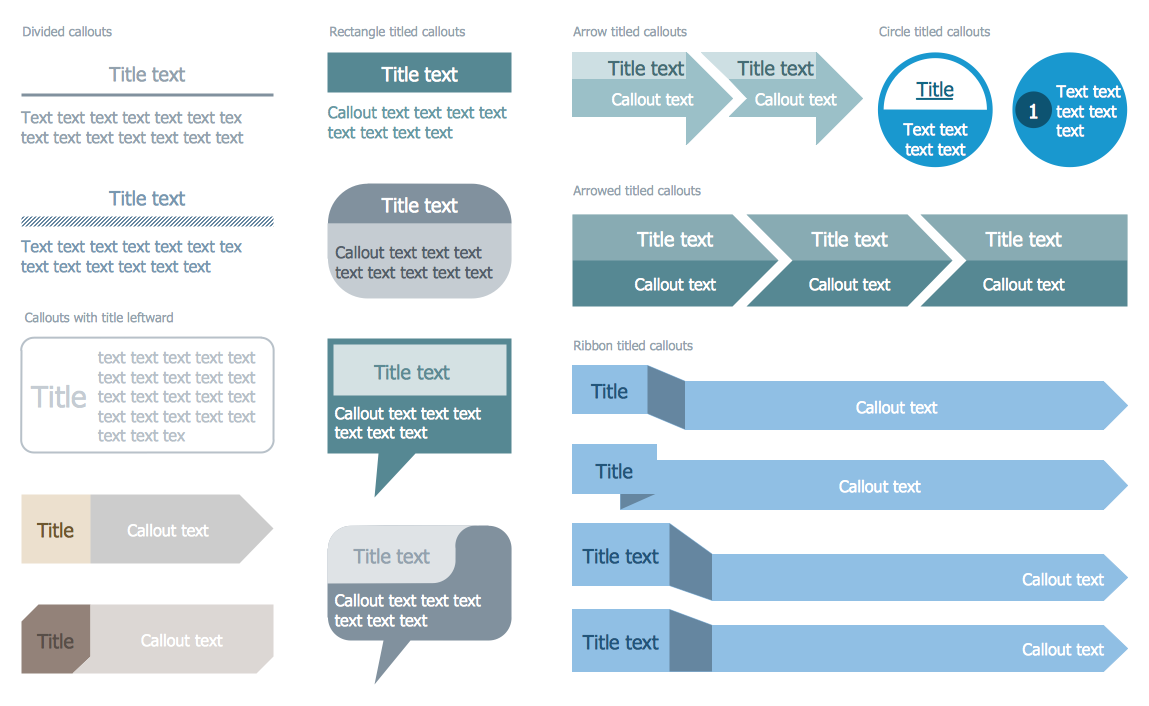
Design Elements — Management Titled Callouts
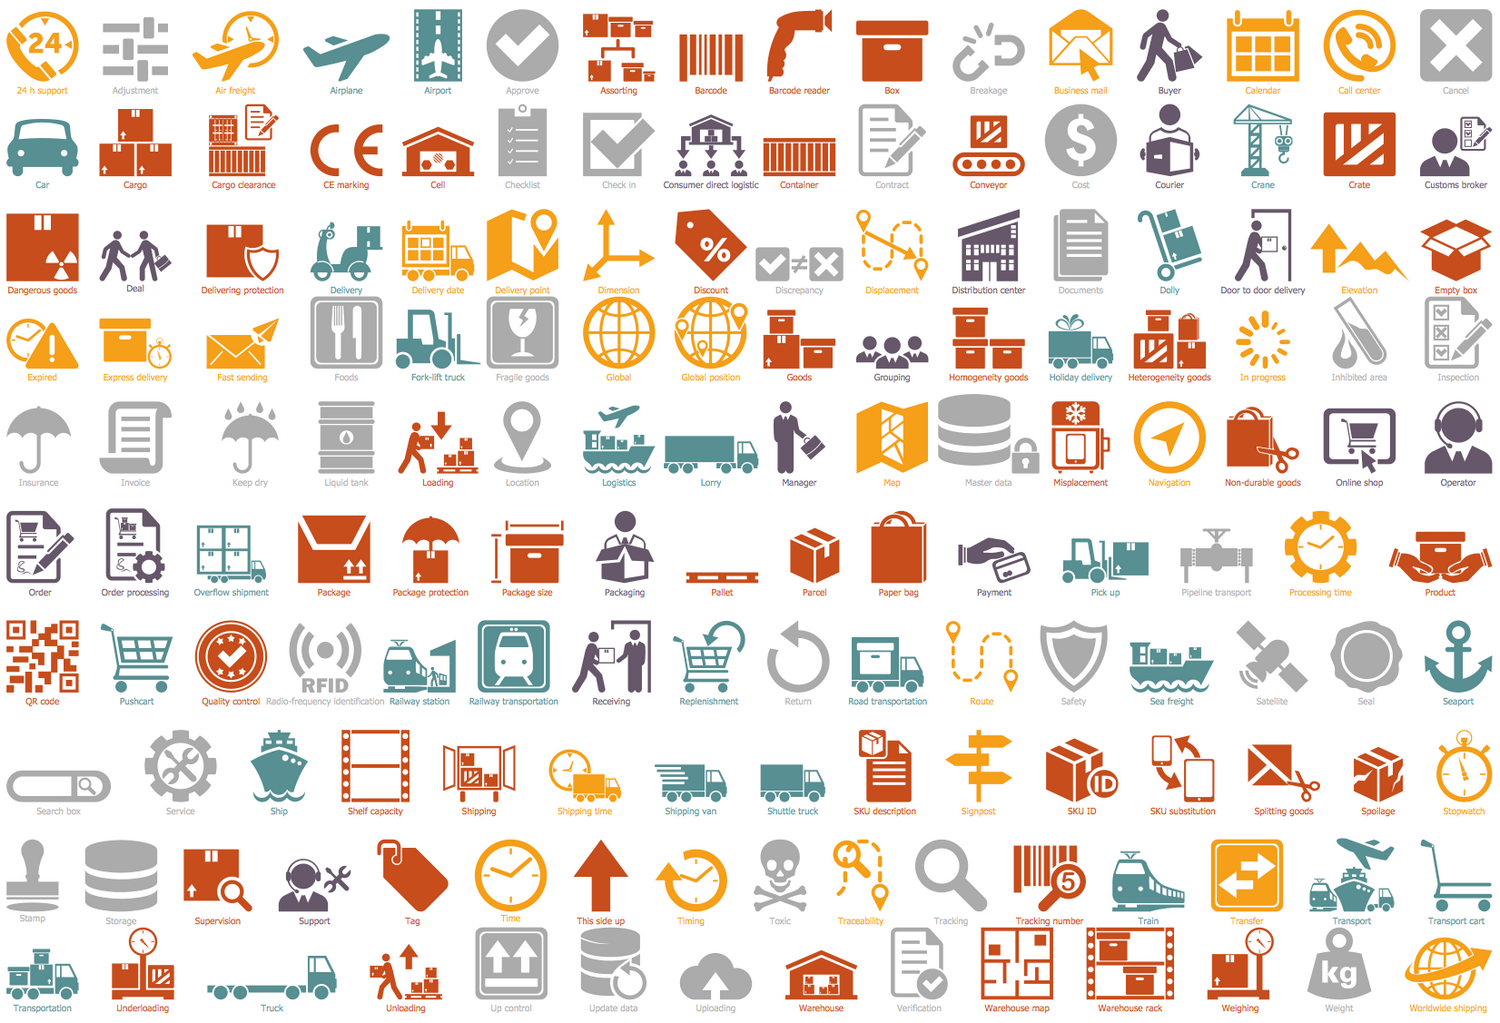
Logistic Dashboard Solution
Achieve the great success in logistics management, in analyzing logistic processes and designing Logistic dashboards, Logistic maps, Logistic charts, diagrams and infographics with Logistic Dashboard solution.
There are 5 stencil libraries containing 180 vector objects and 10 examples in the Logistic Dashboard solution.
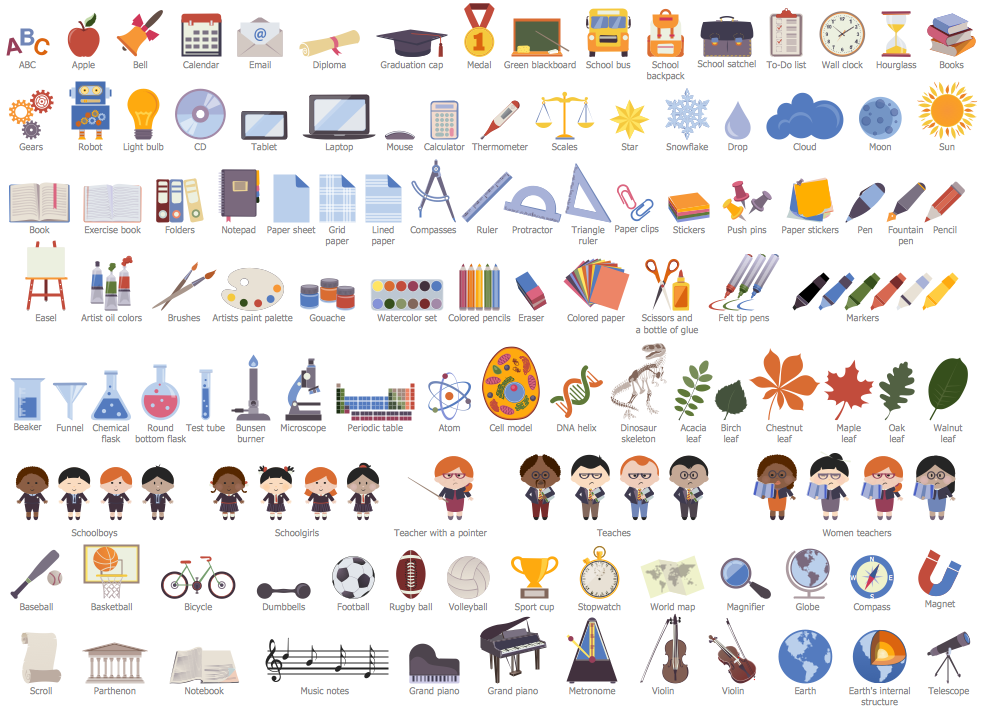
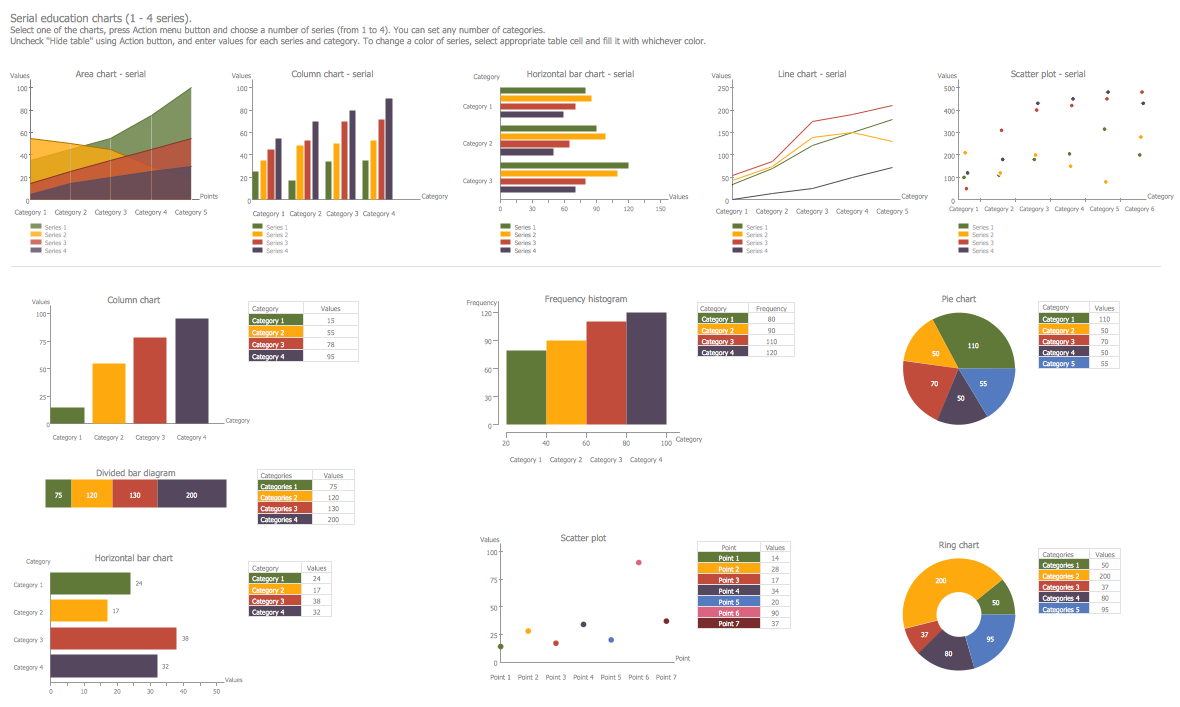
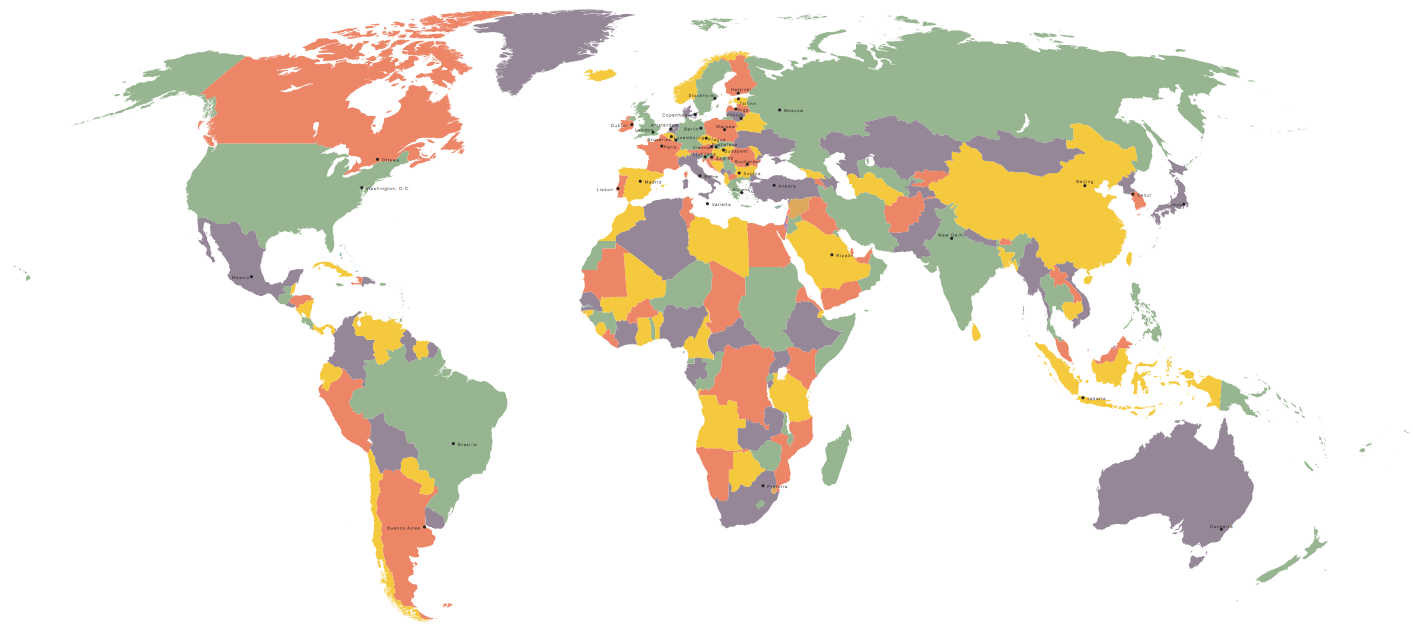
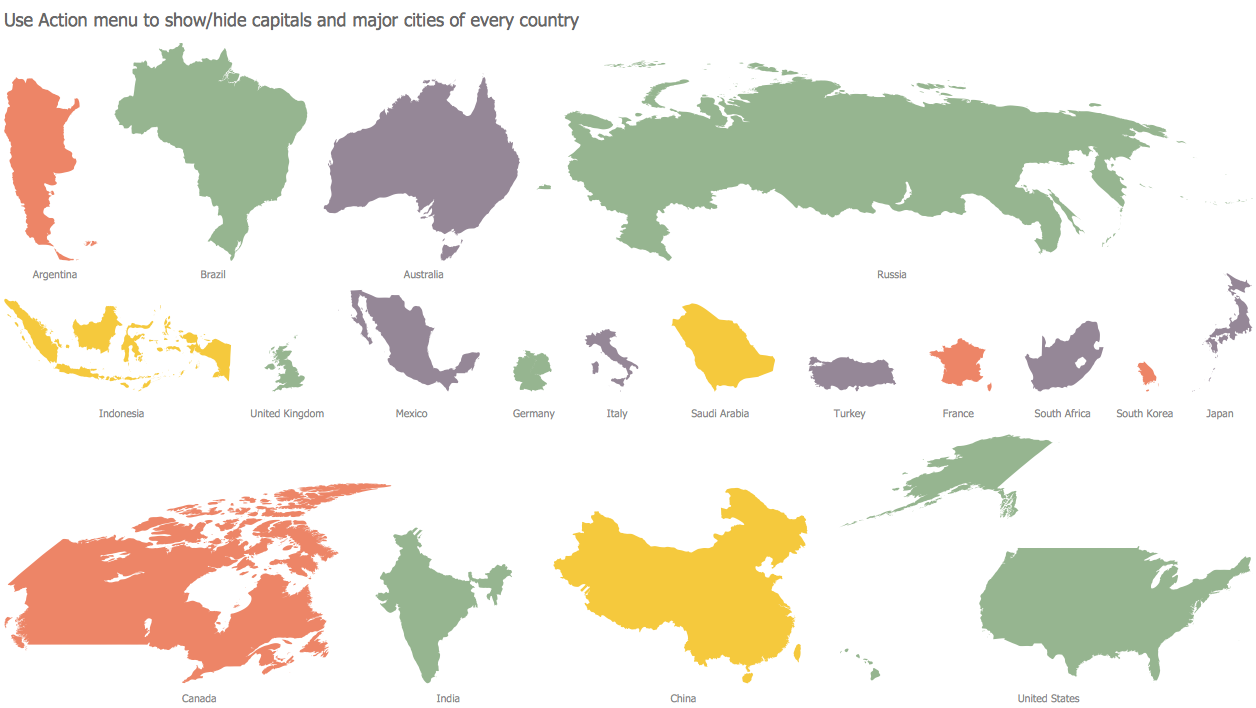
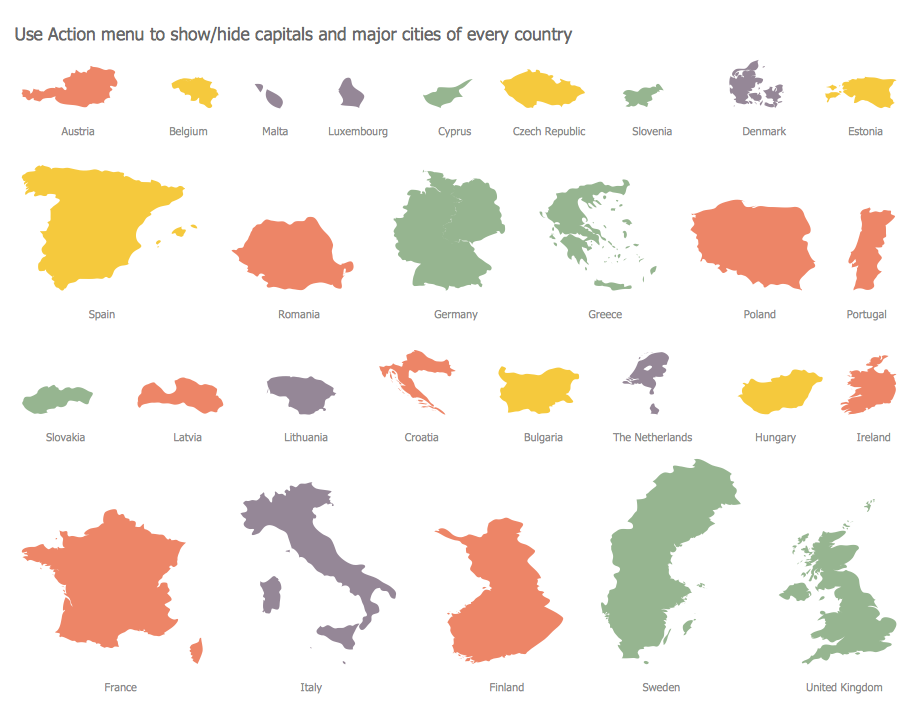
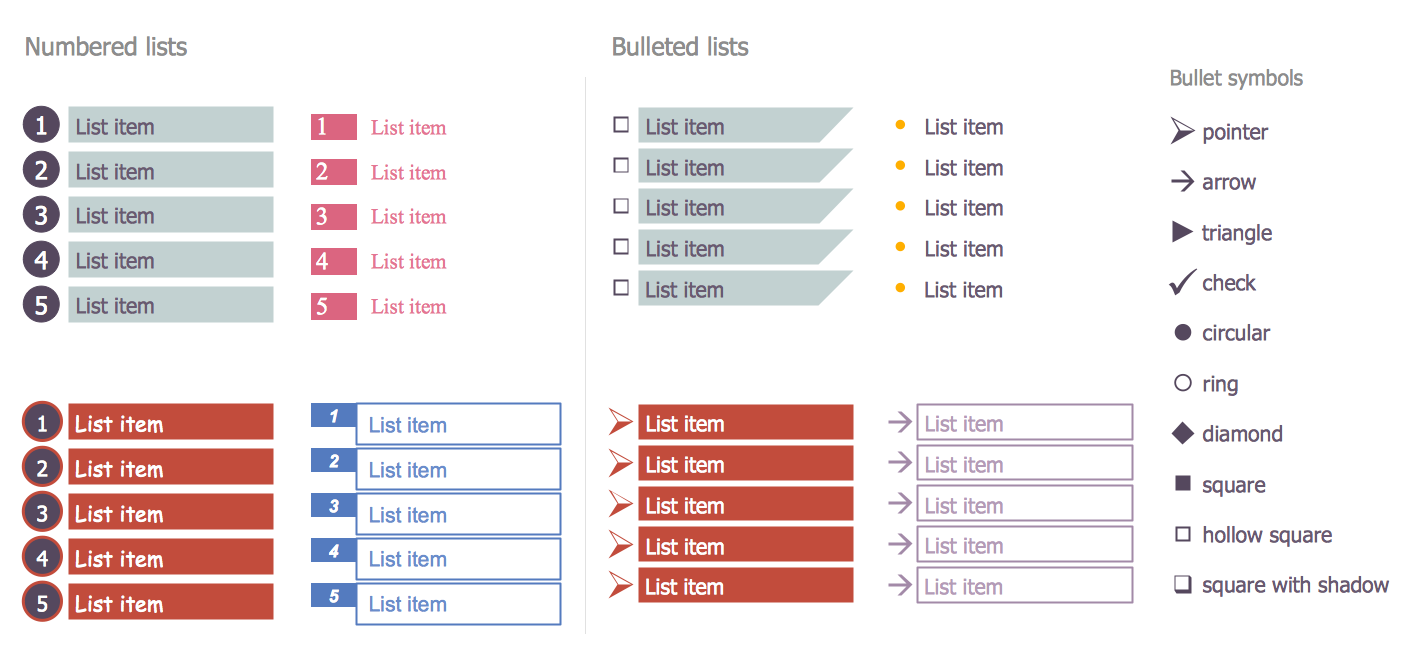
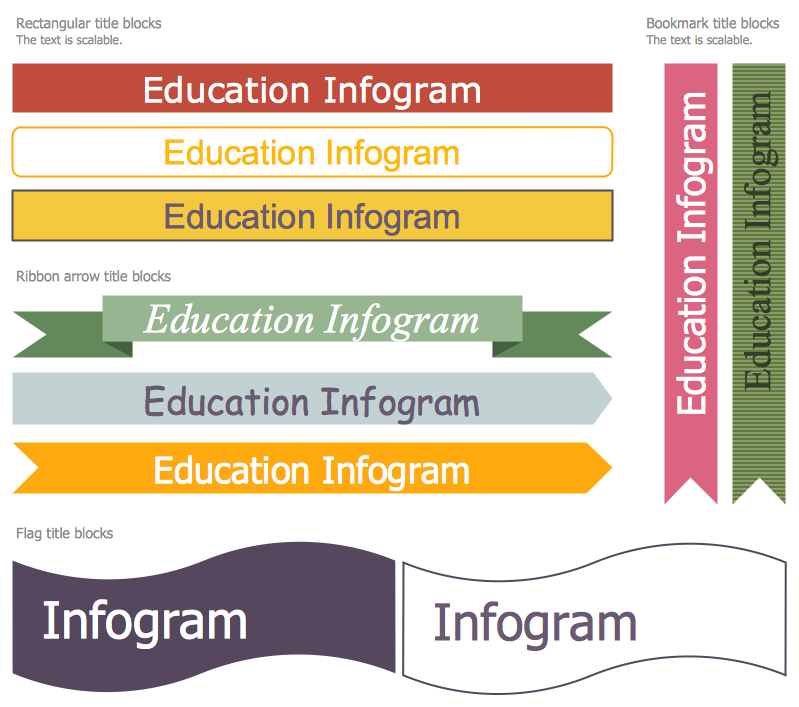
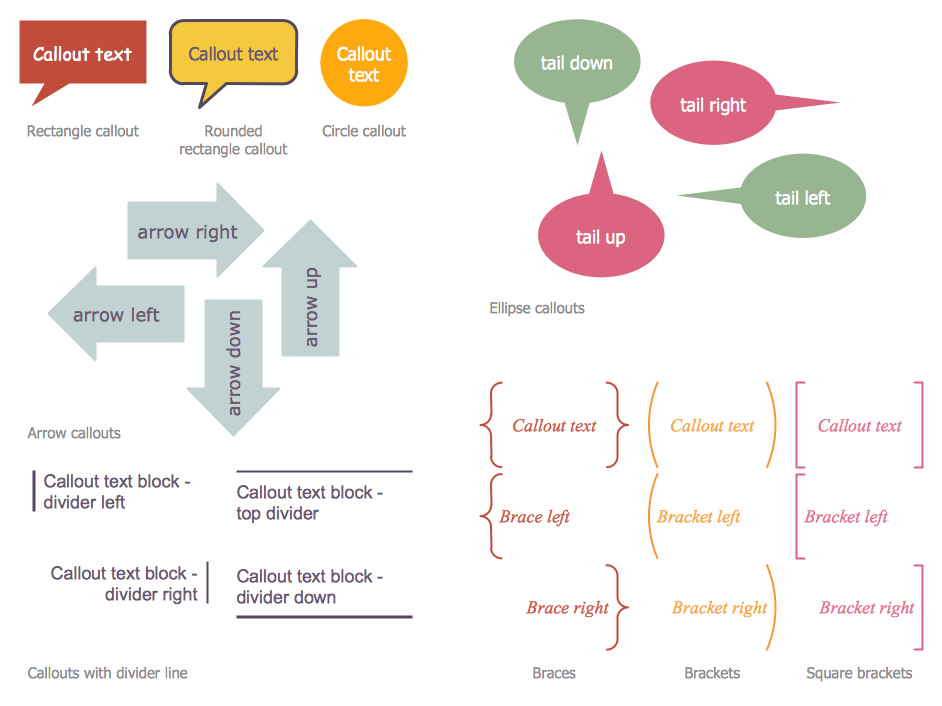
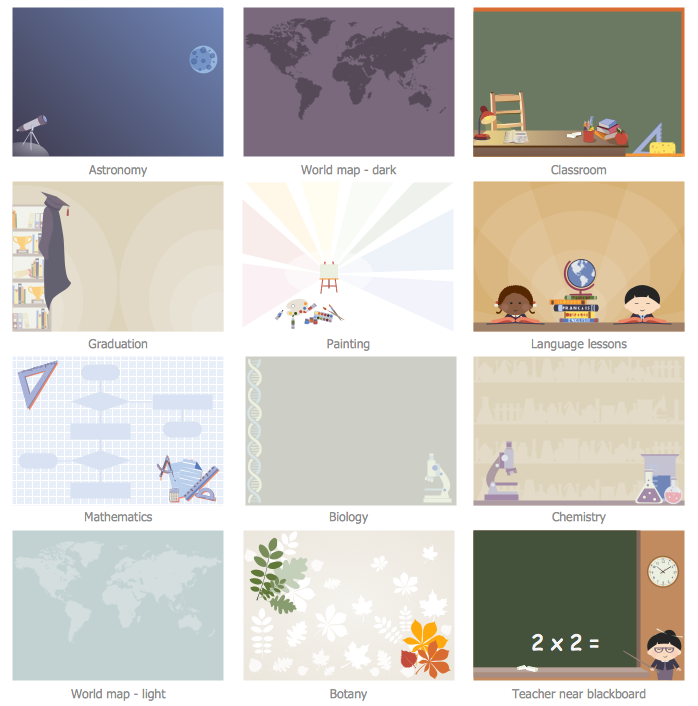
Education Infographics Solution
Learning through visualisation is a renowned technique. Convey educational themes and information using this solution.
There are 14 stencil libraries containing 404 vector objects and 10 examples in the Education Infographics solution.
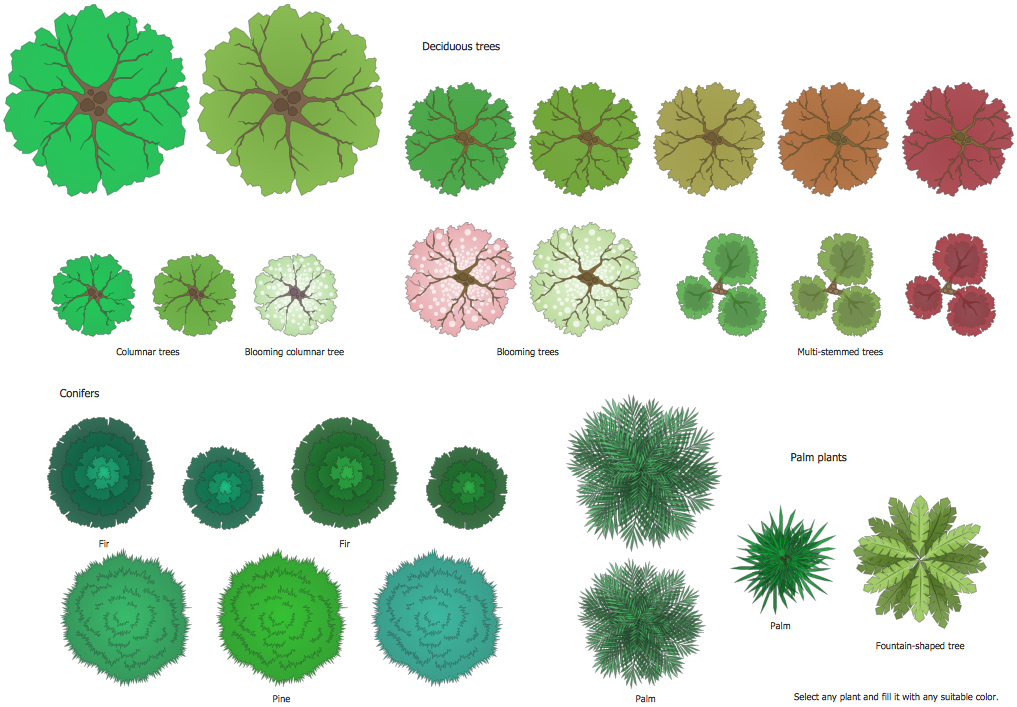
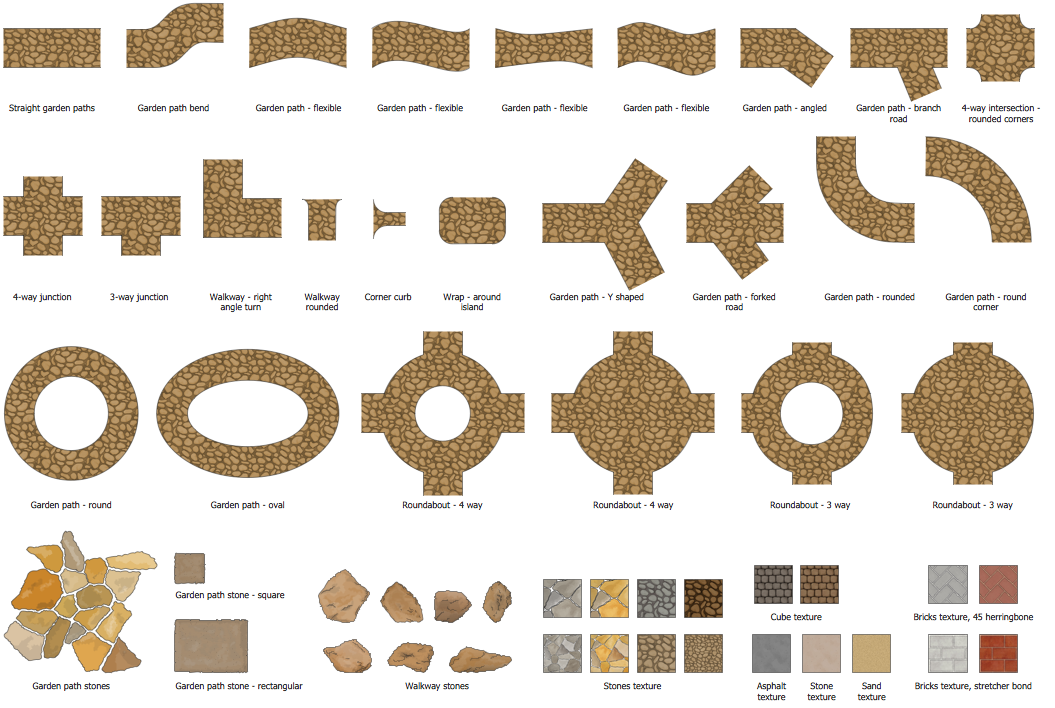
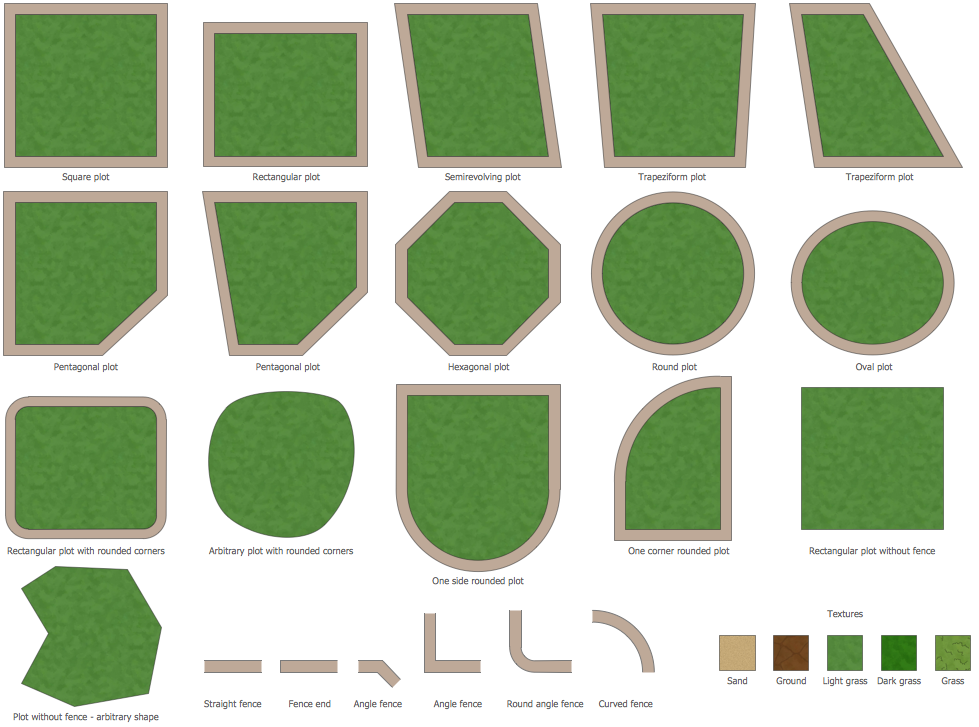
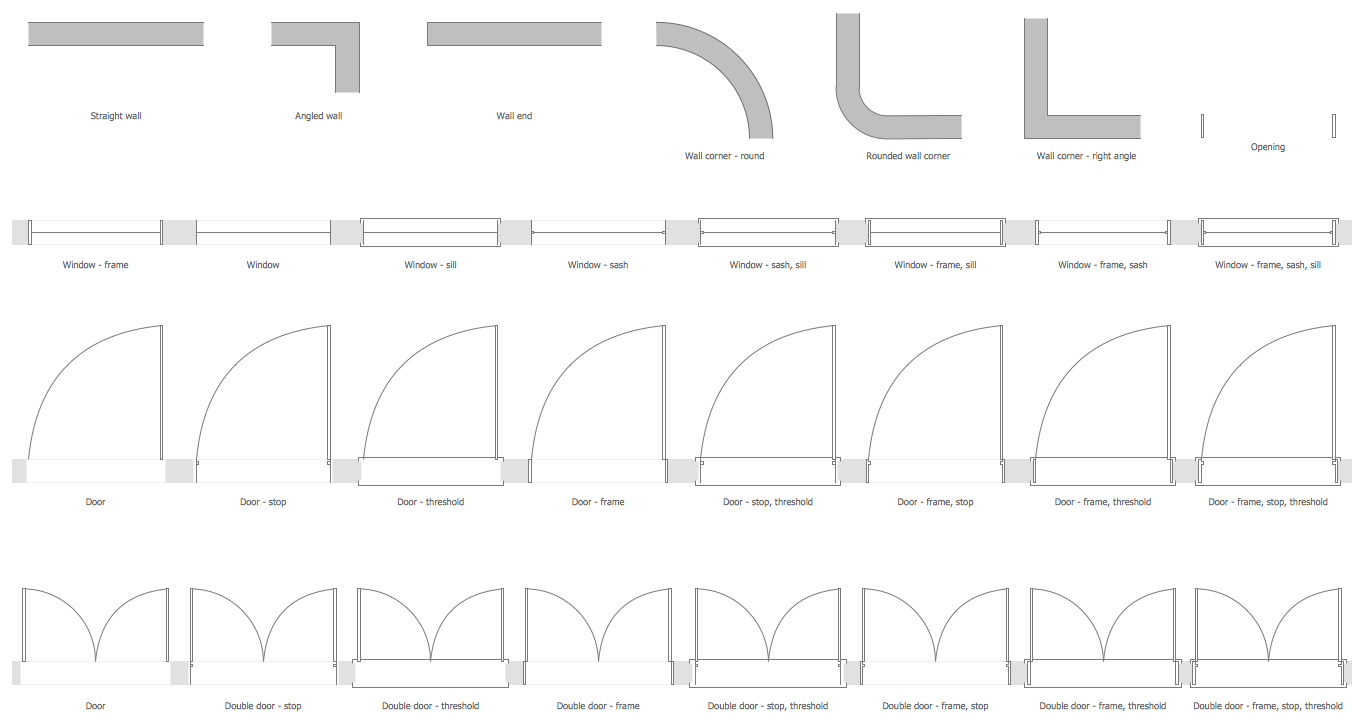
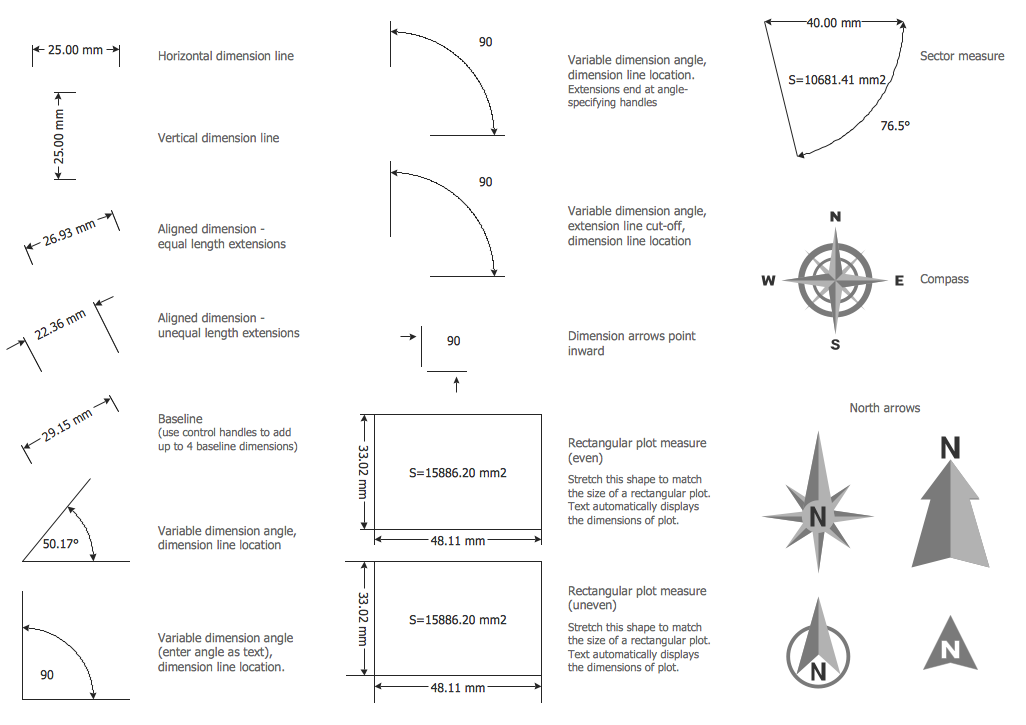
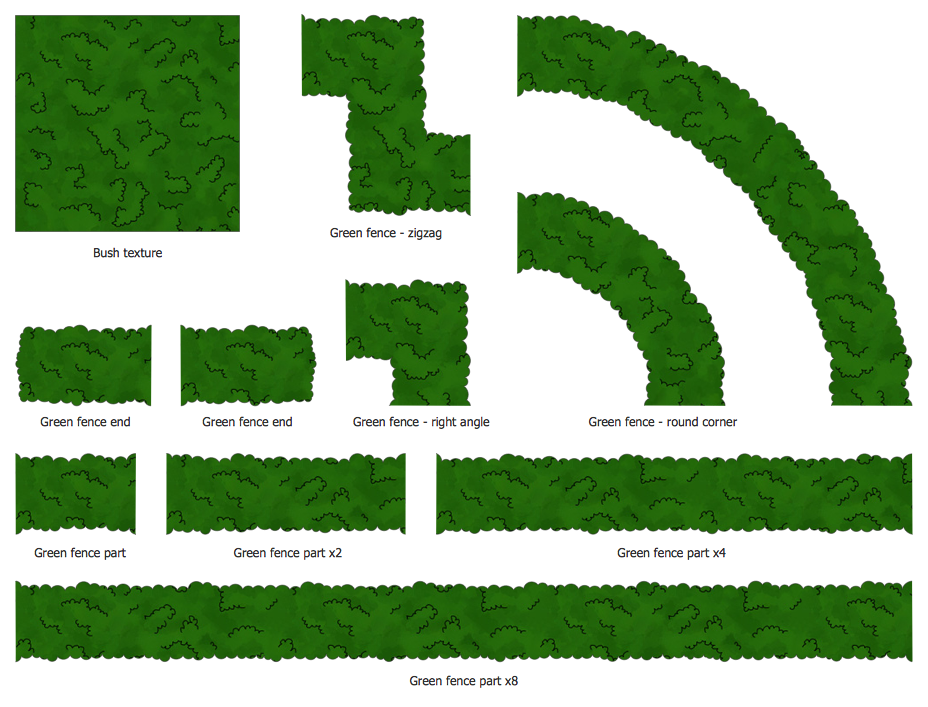
Landscape and Garden Solution
A solution for all budding horticulturalists. Before you start tearing up your lawn, use the Landscape & Garden solution to visualize a potential garden design or theme.
This solution contains 14 libraries containing 420 vector graphics shapes and 10 examples, to allow you to create professional looking documents.
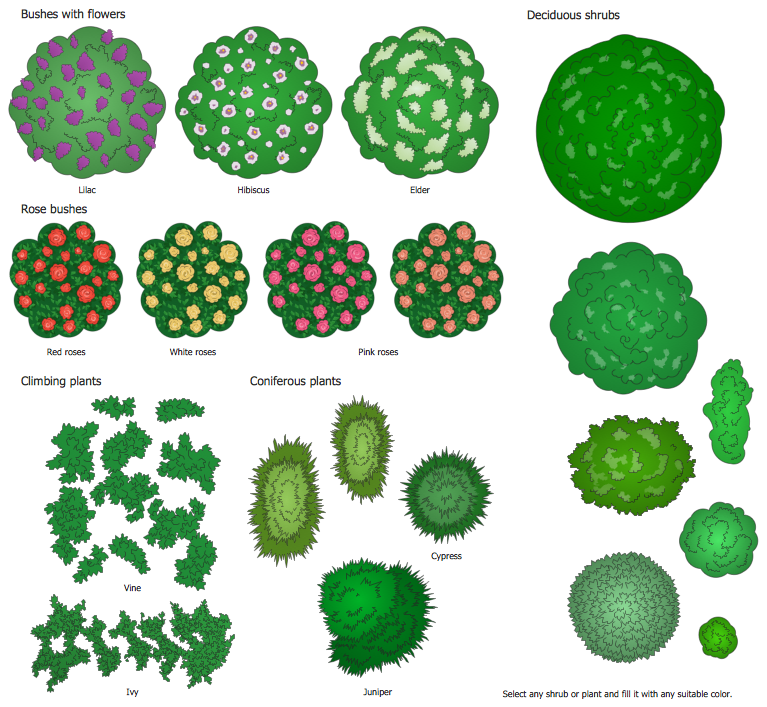
Design Elements — Bushes and Trees (bushes)
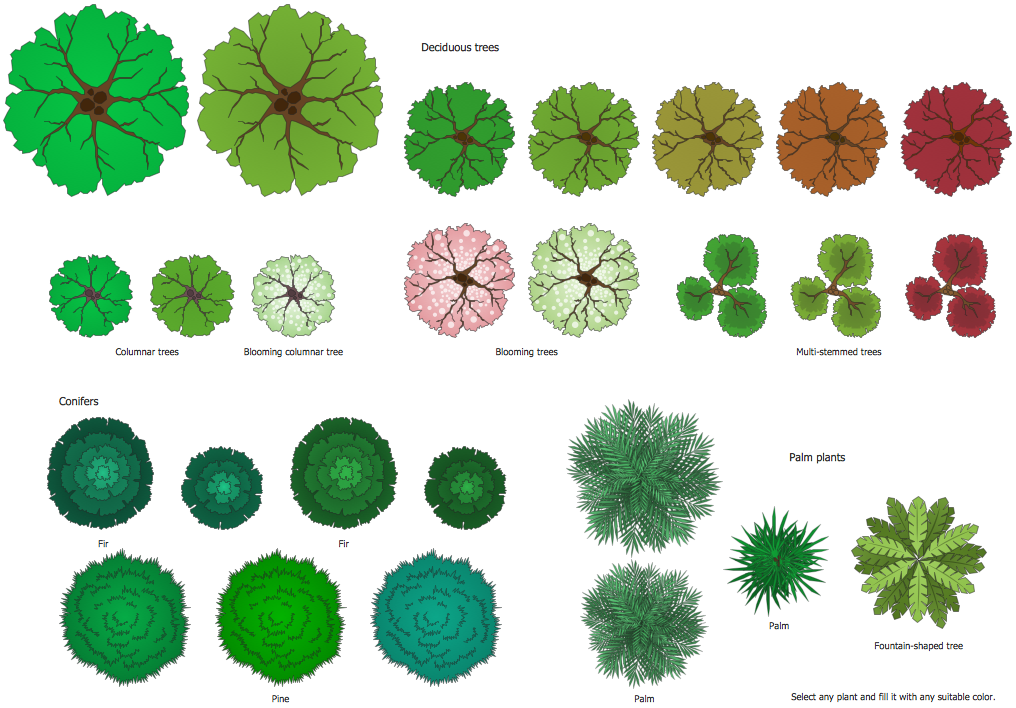
Design Elements — Bushes and Trees (trees)
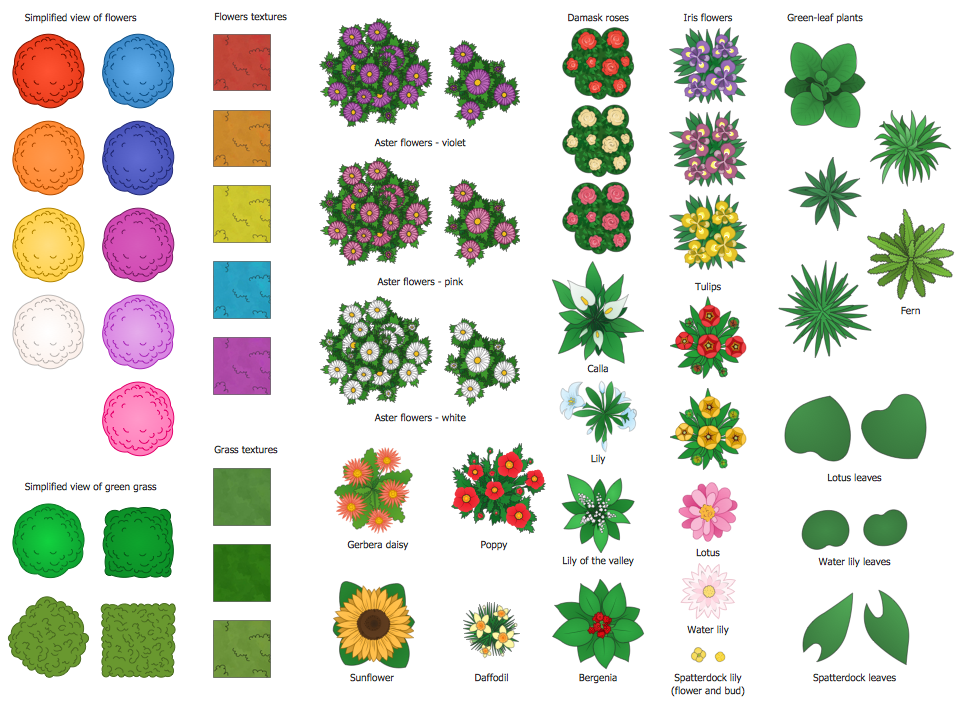
Design Elements — Flowers and Grass
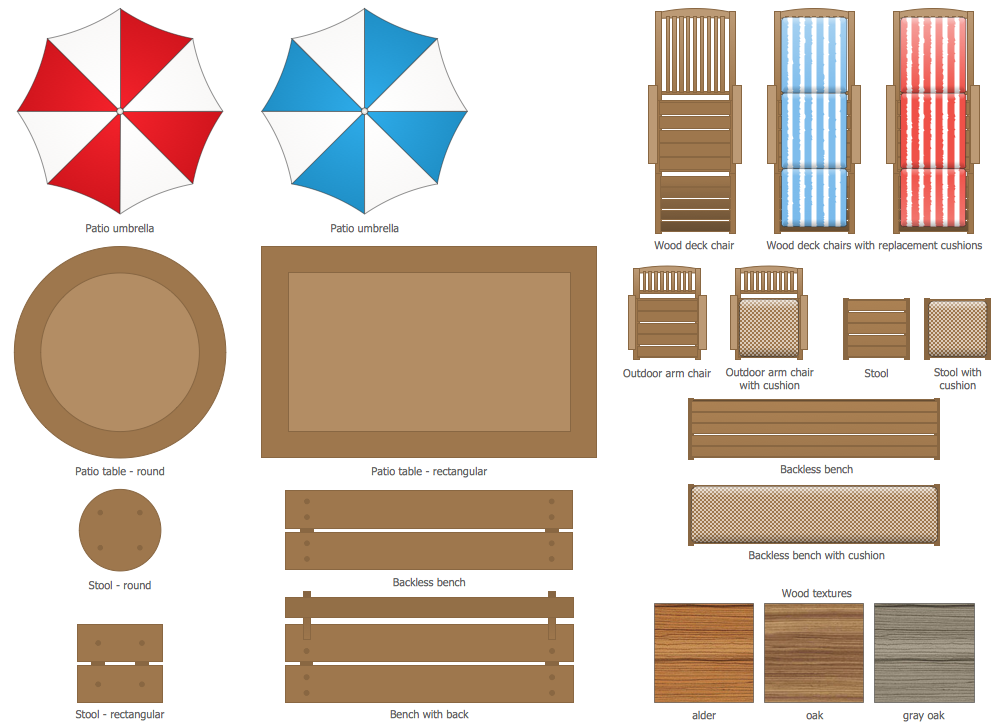
Design Elements — Garden Furniture
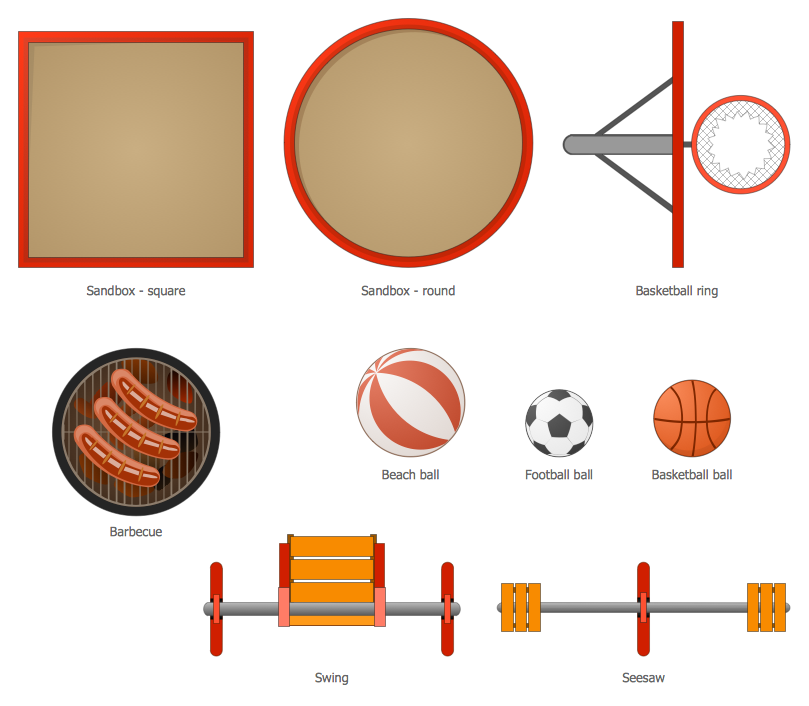
Design Elements — Outdoor Recreation Space
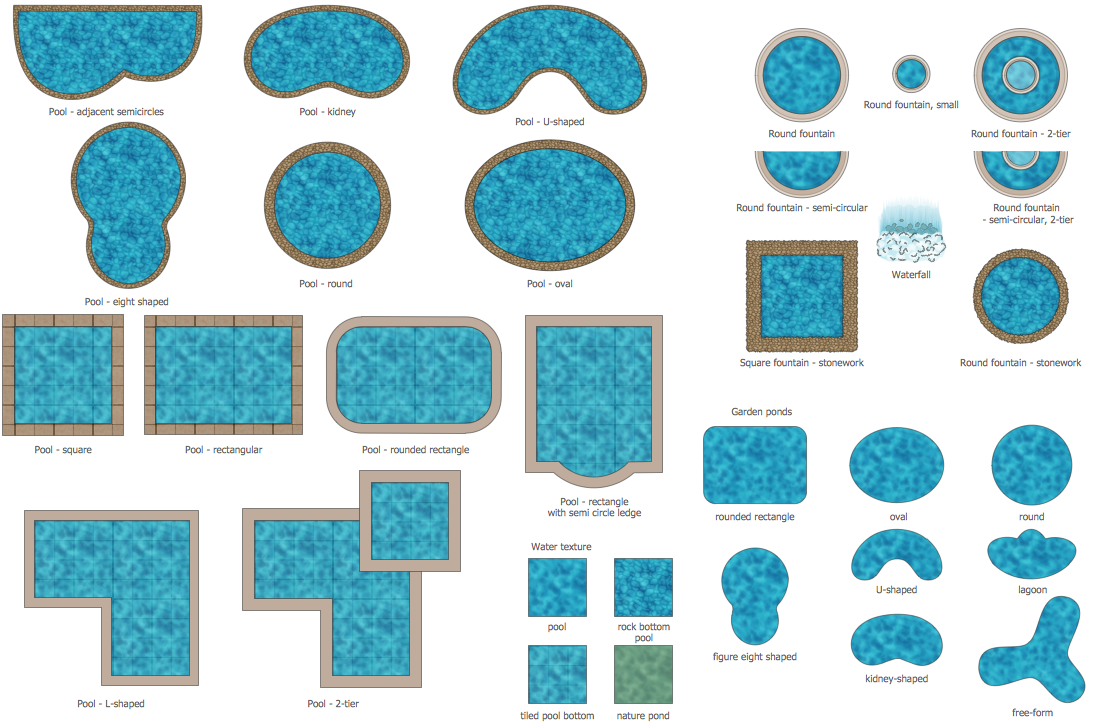
Design Elements — Ponds and Fountains


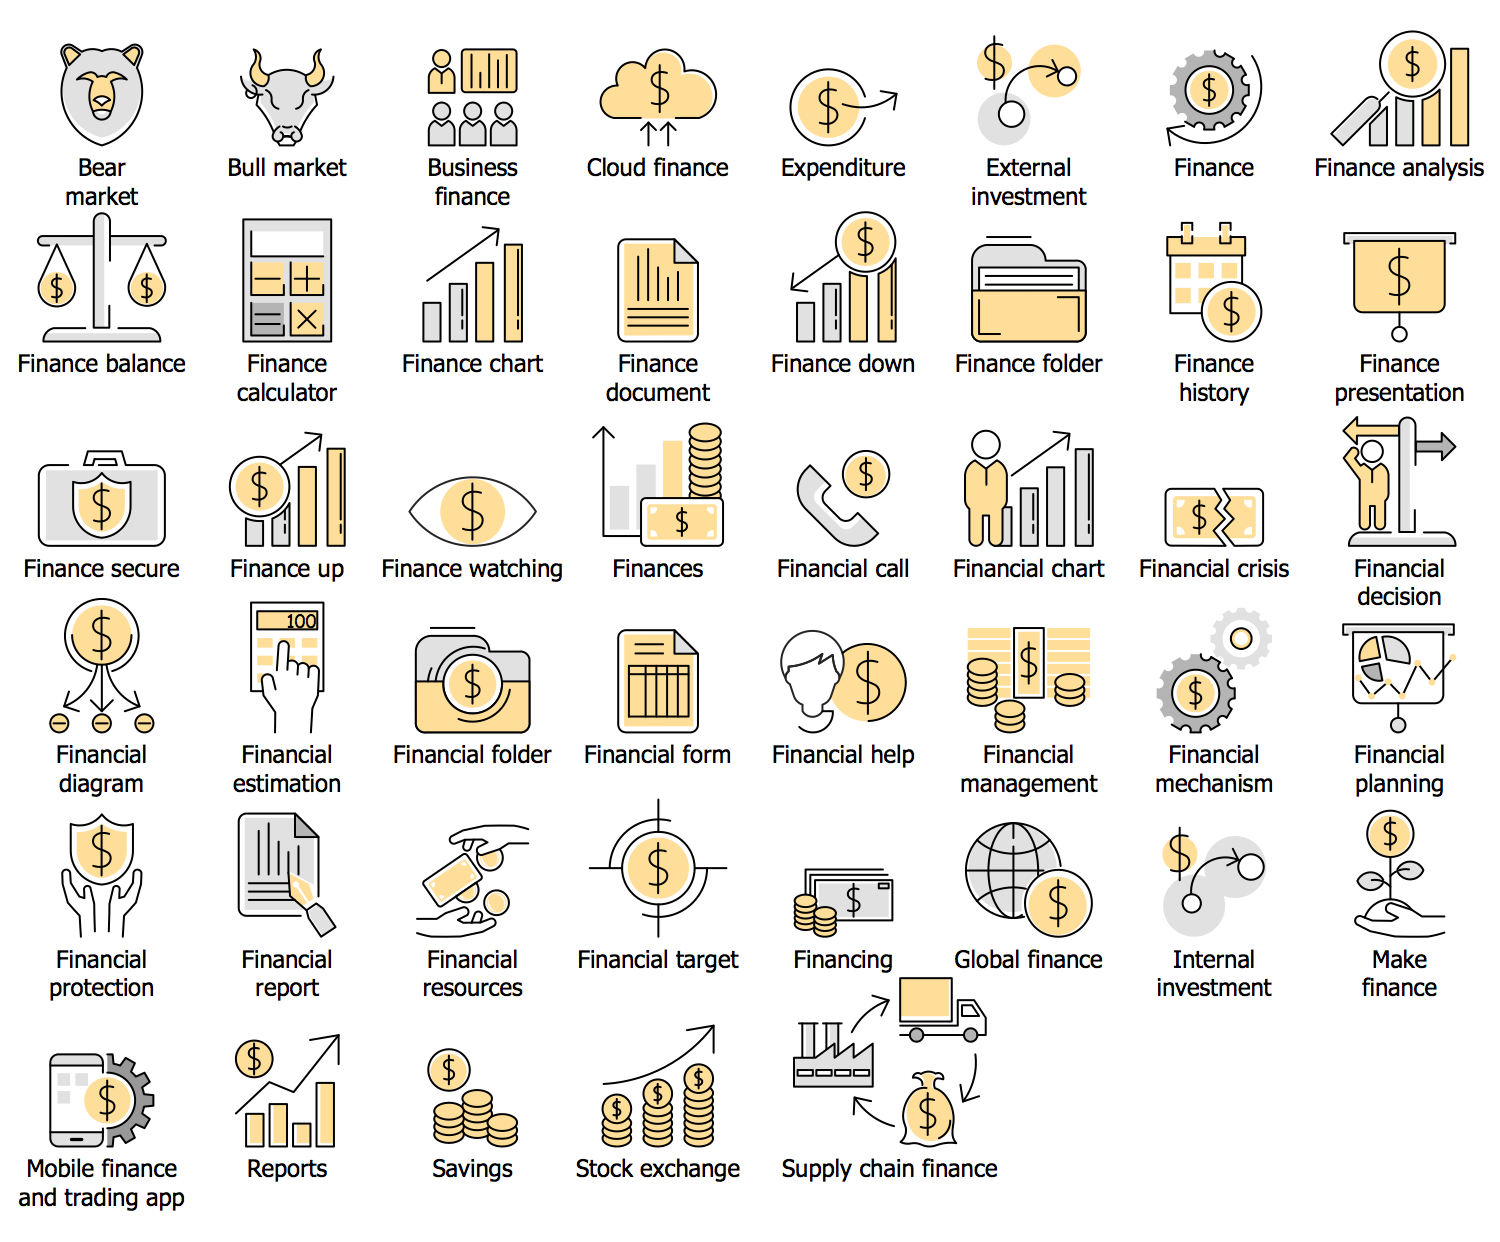
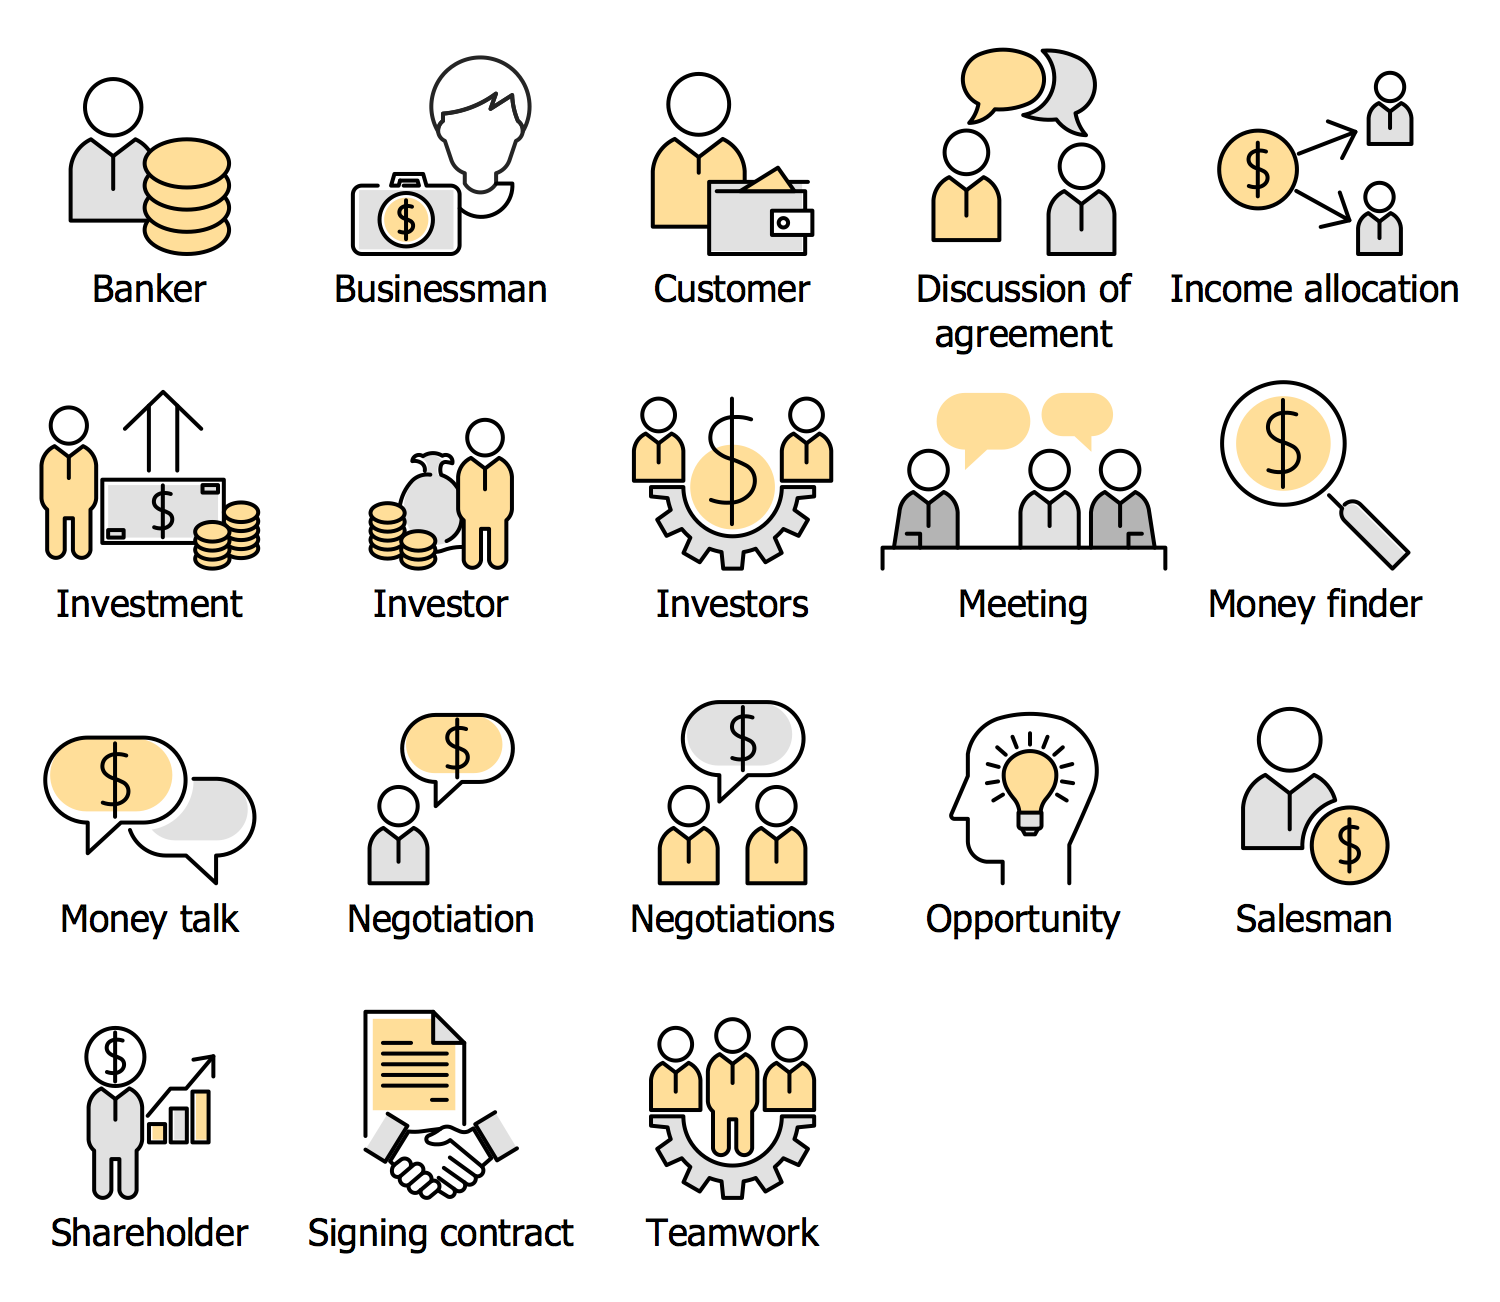
Financial Infographics Solution
Accelerate your success in visualization of financial data and statistics, and vivify your financial reports, presentations and analytic documents with modern and convenient financial infographics drawing tools of Financial Infographics solution.
There are 20 stencil libraries containing 526 vector objects and 15 examples in the Financial Infographics solution.
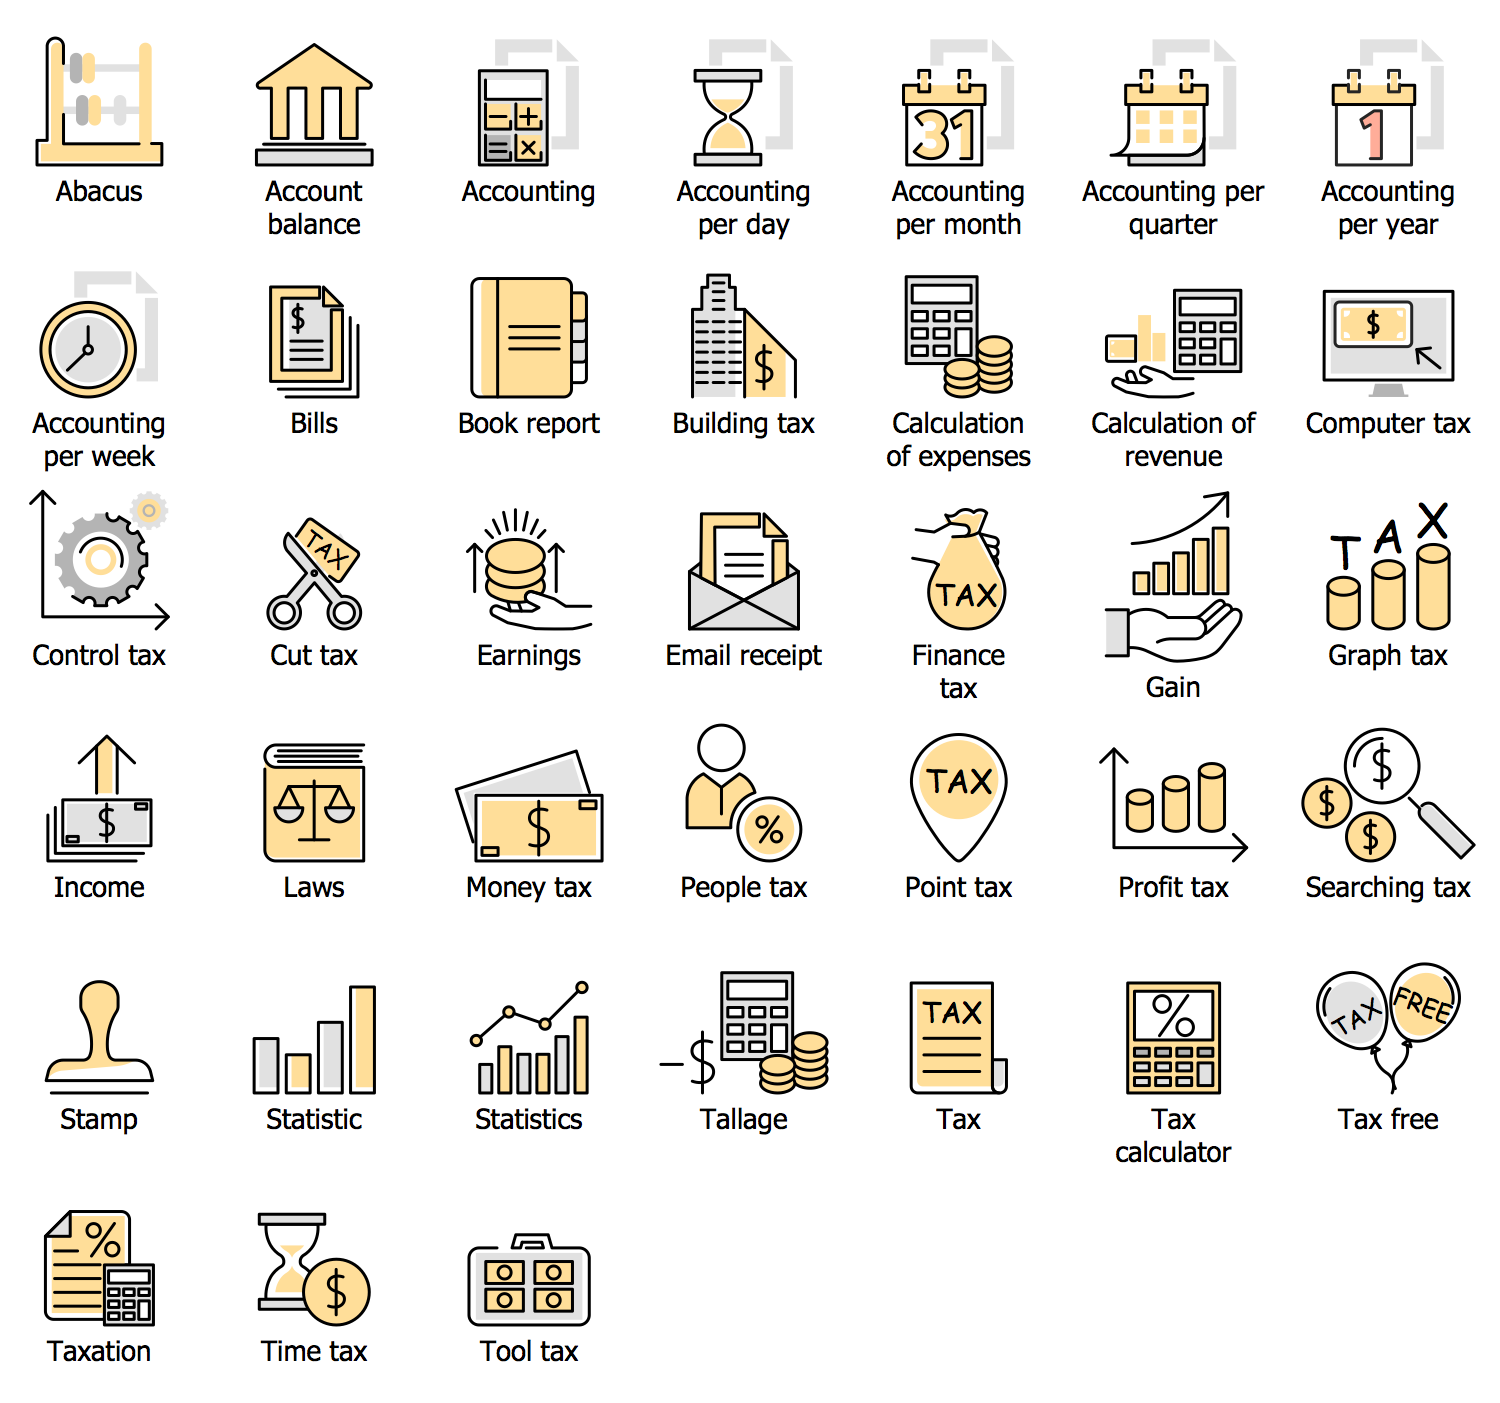
Design Elements — Accounting
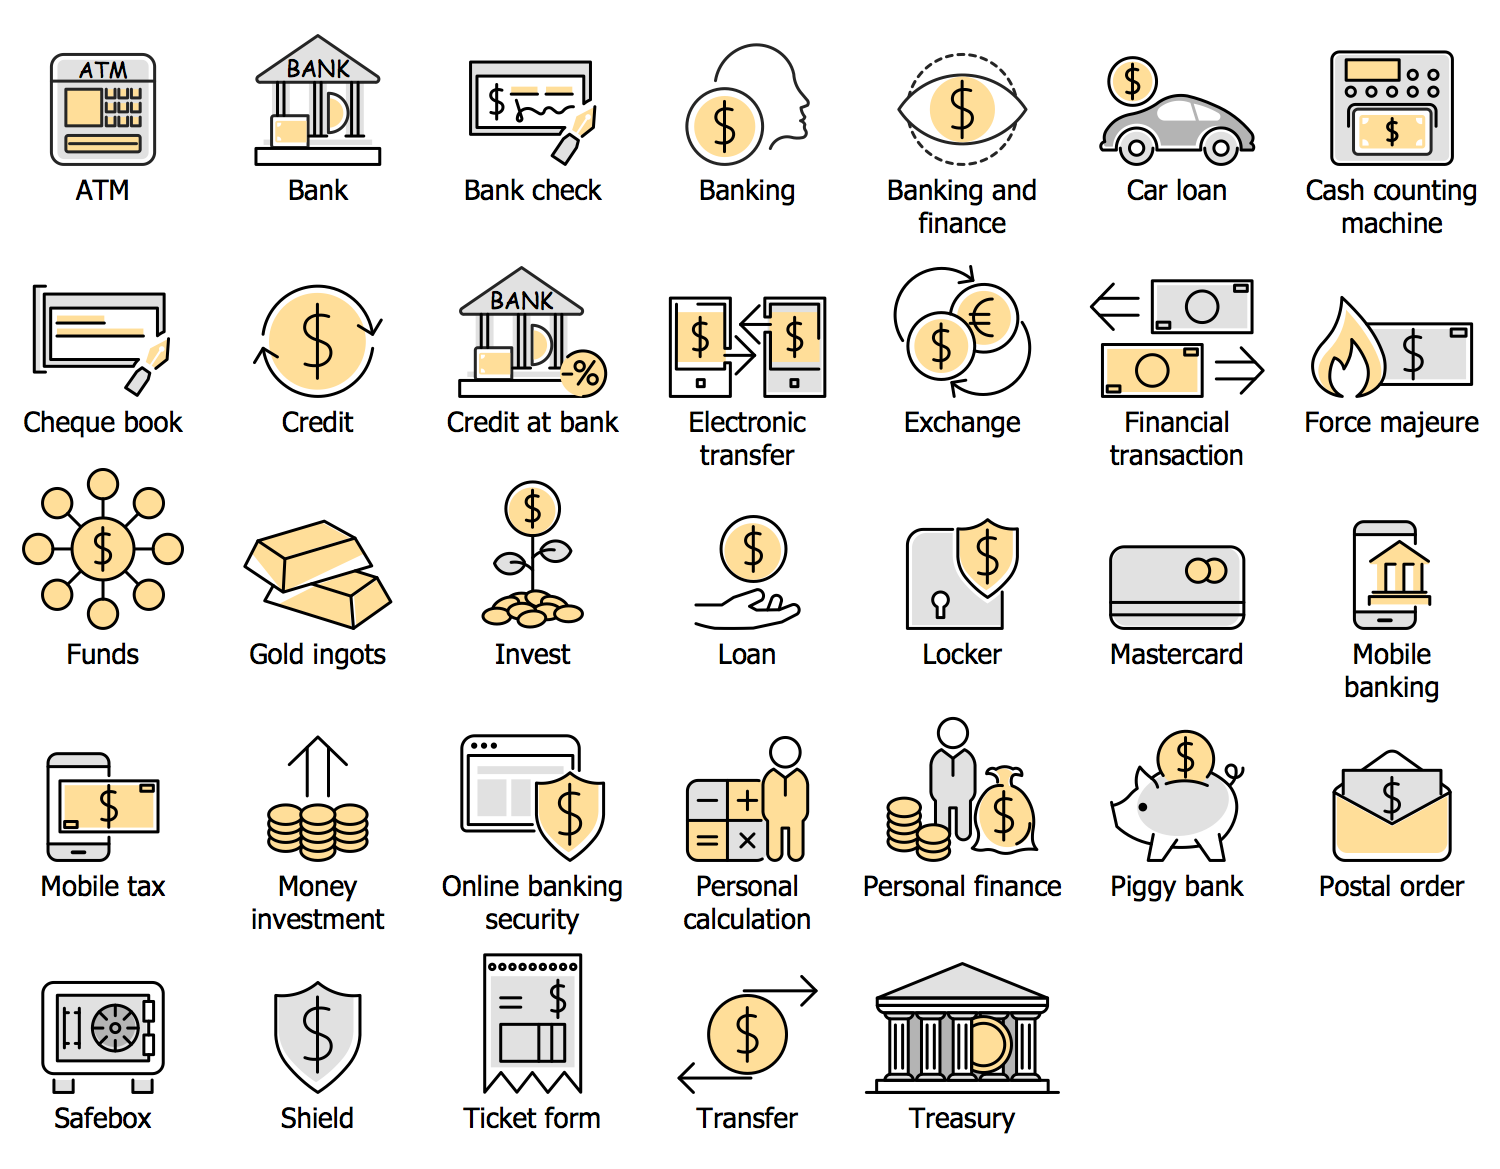
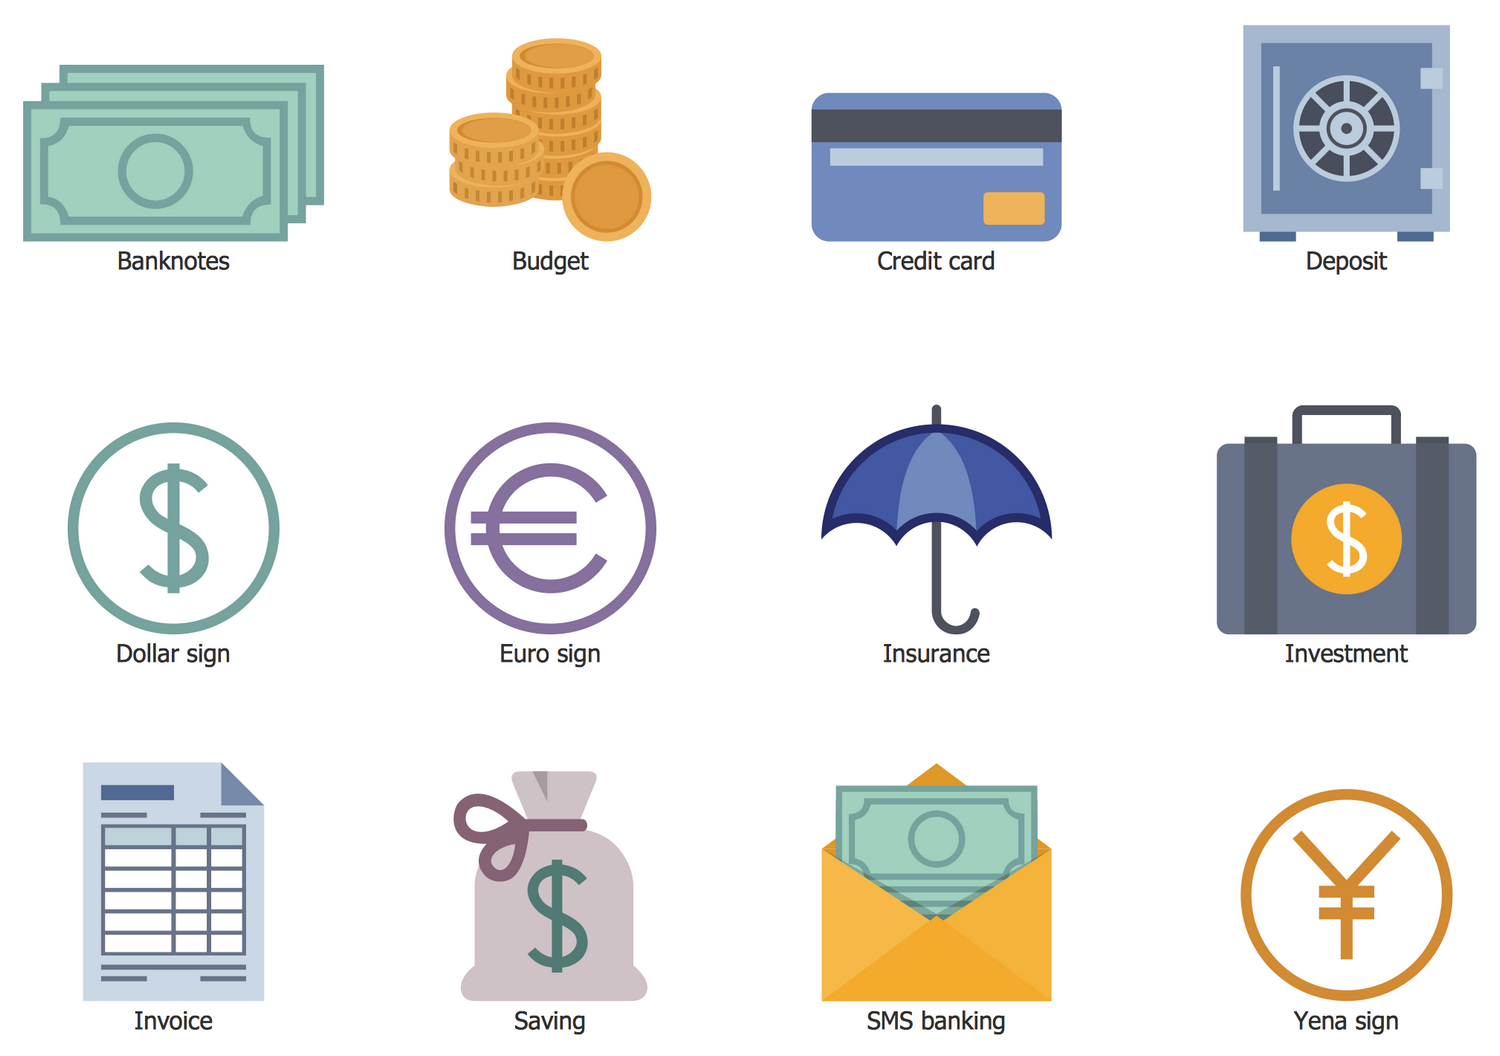
Design Elements — Banking
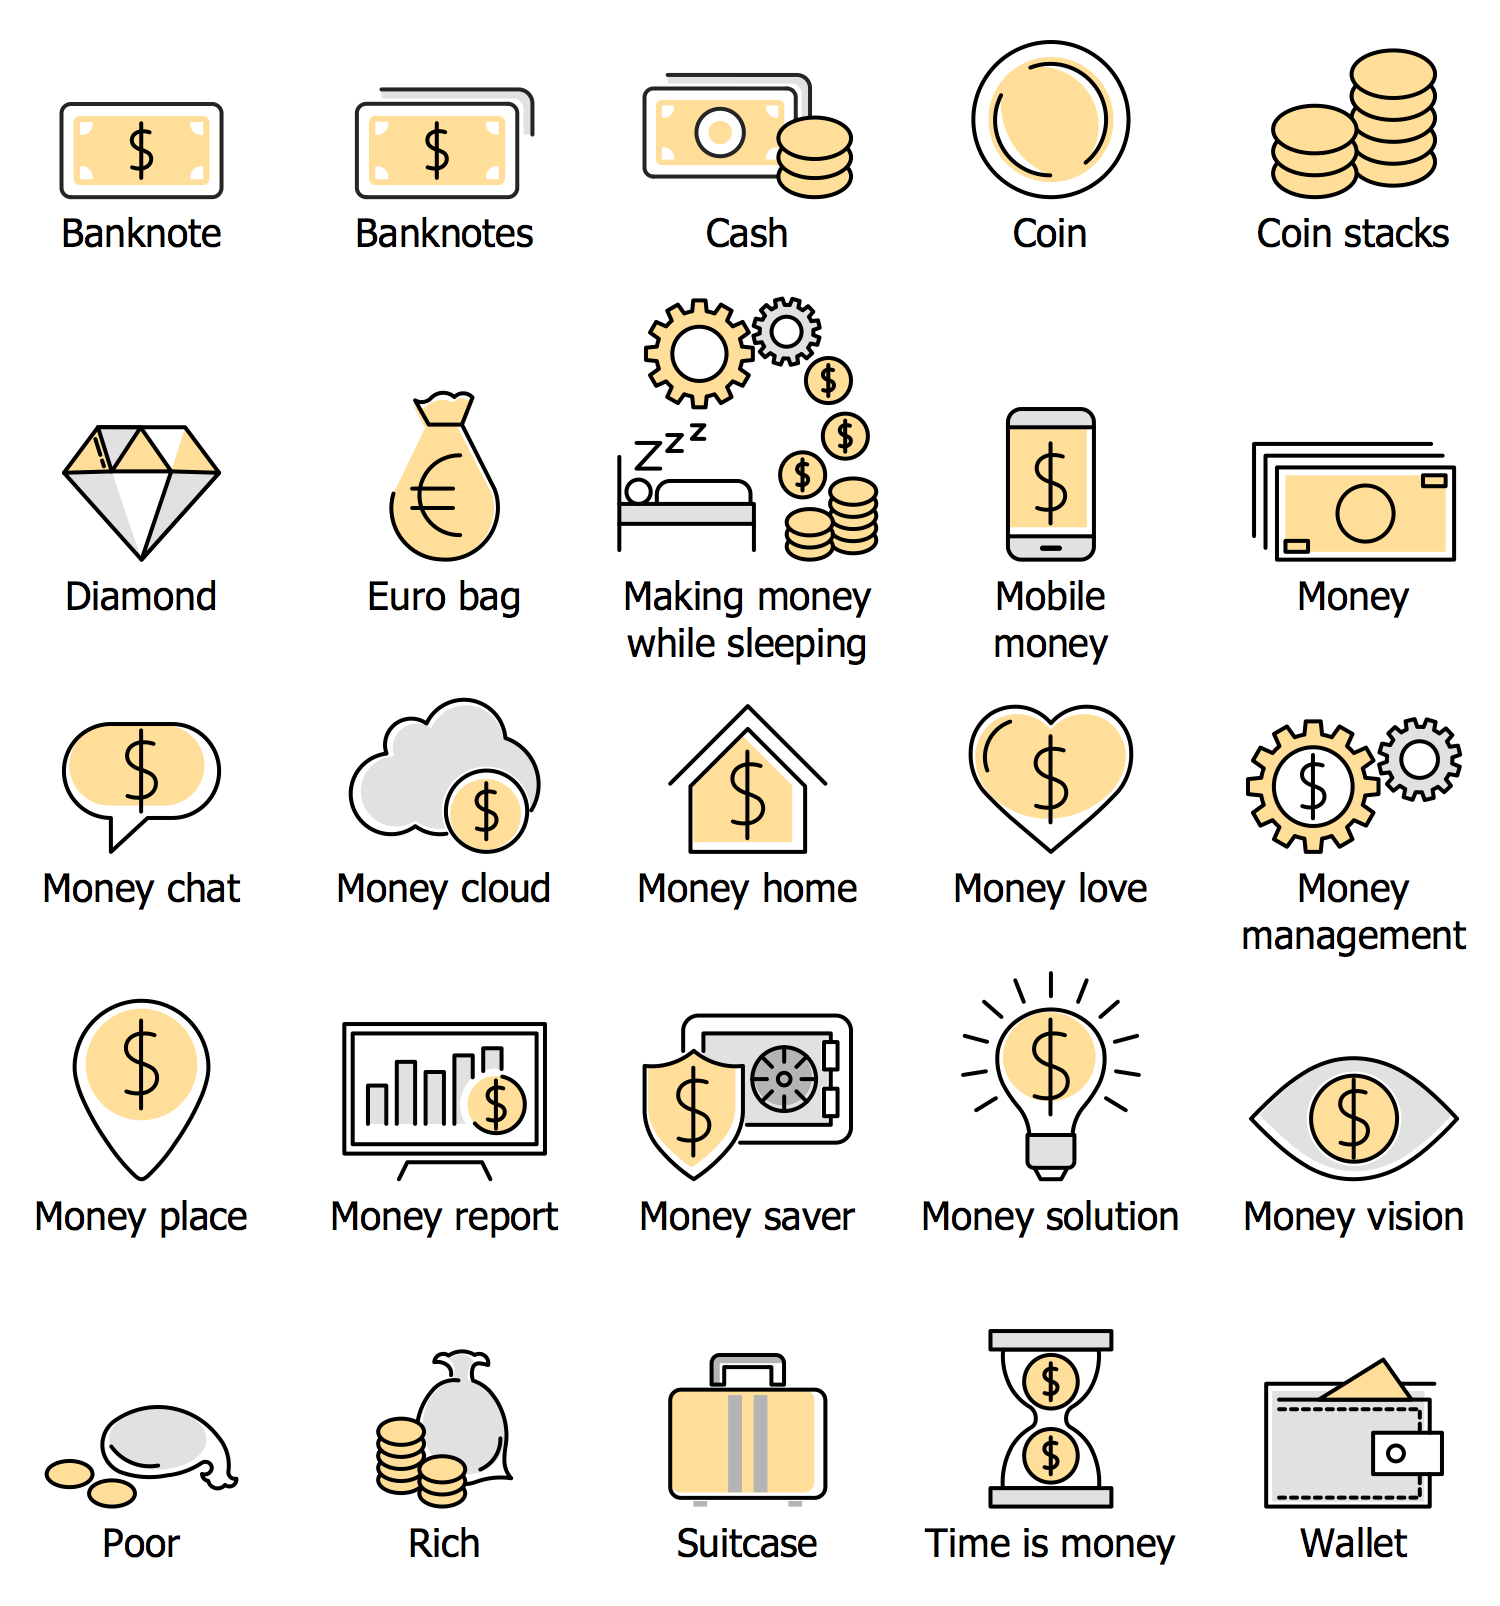
Design Elements — Cash
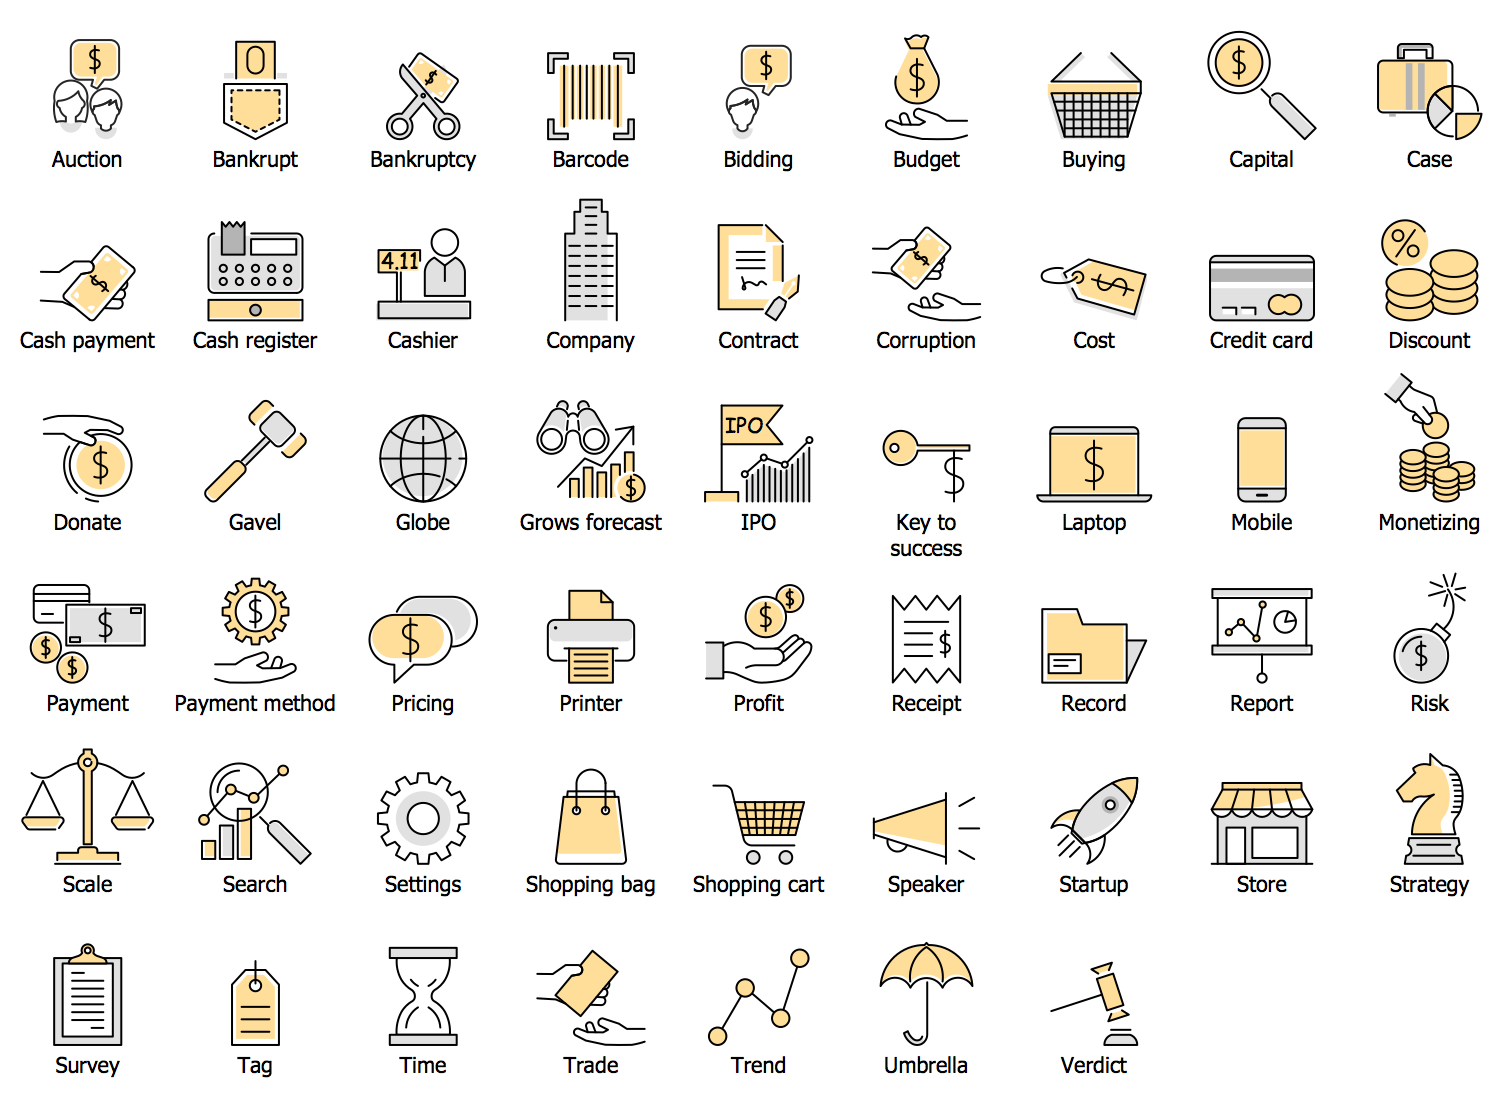
Design Elements — Commerce
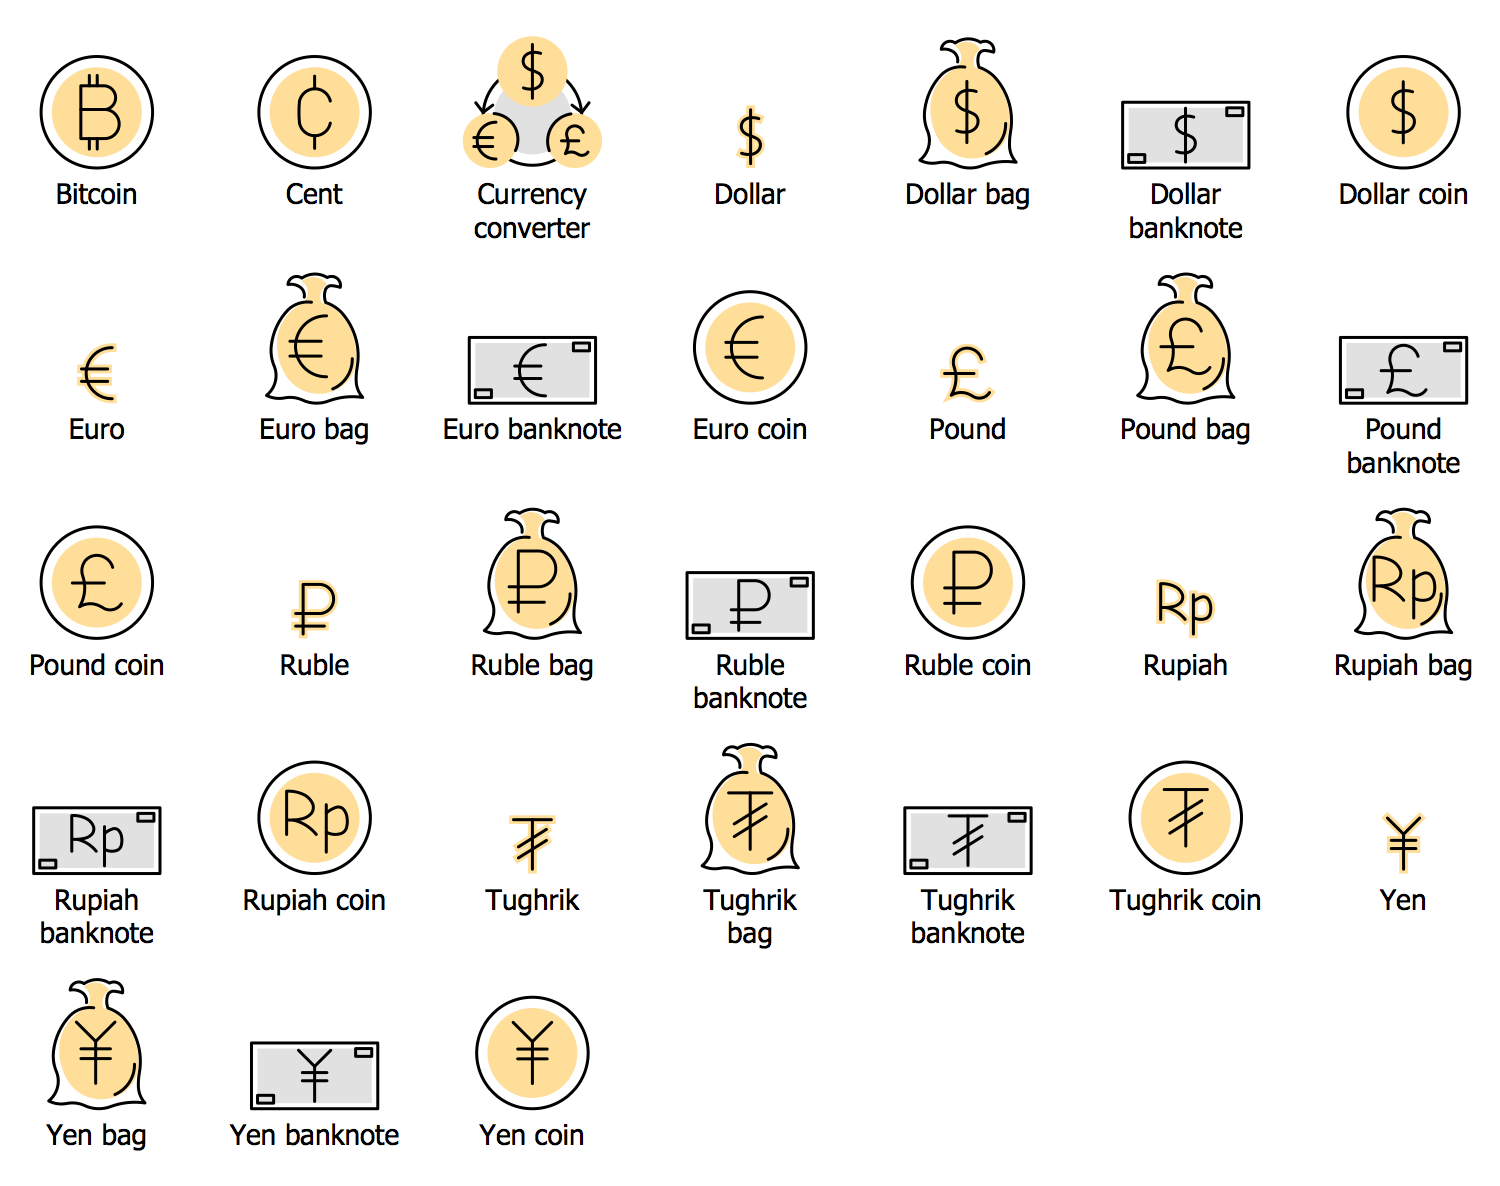
Design Elements — Exchange
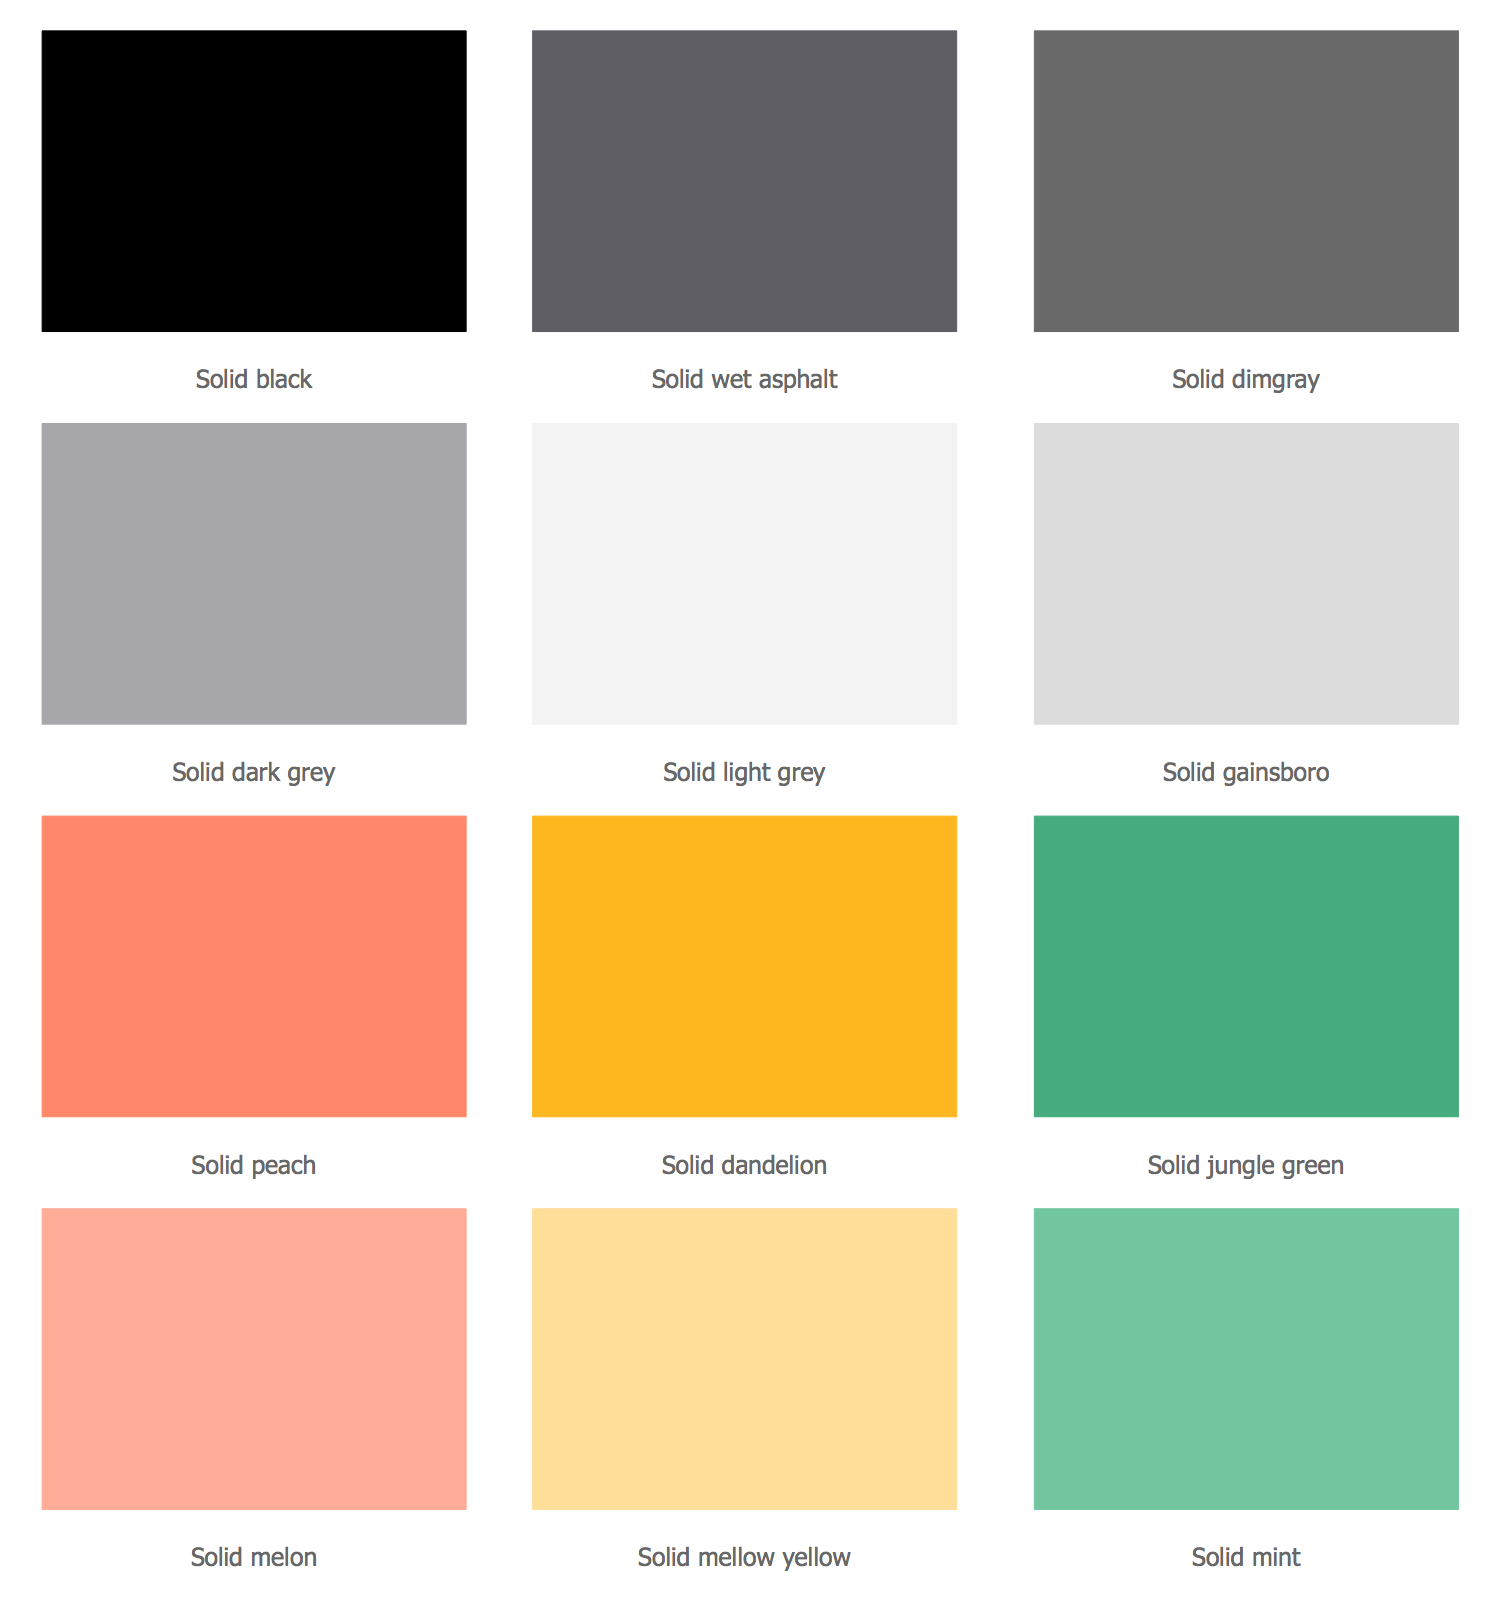
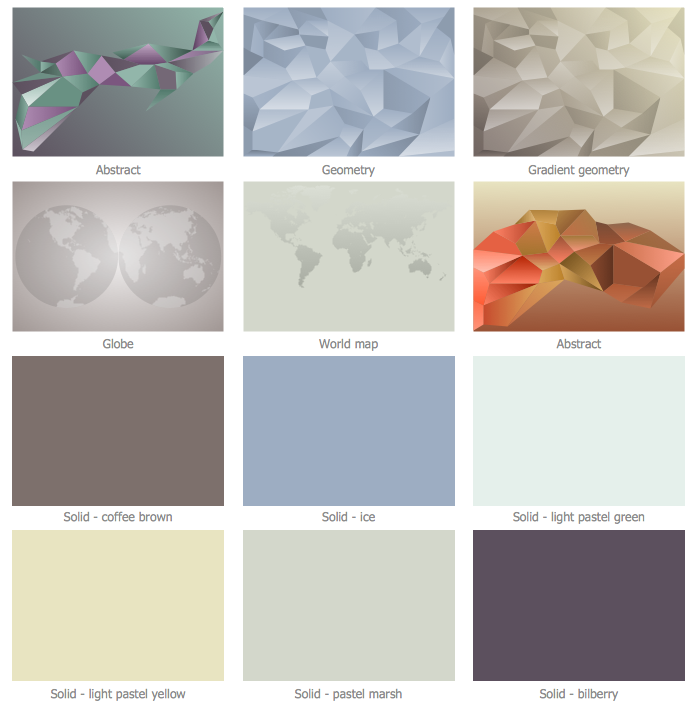
Design Elements — Financial Backgrounds
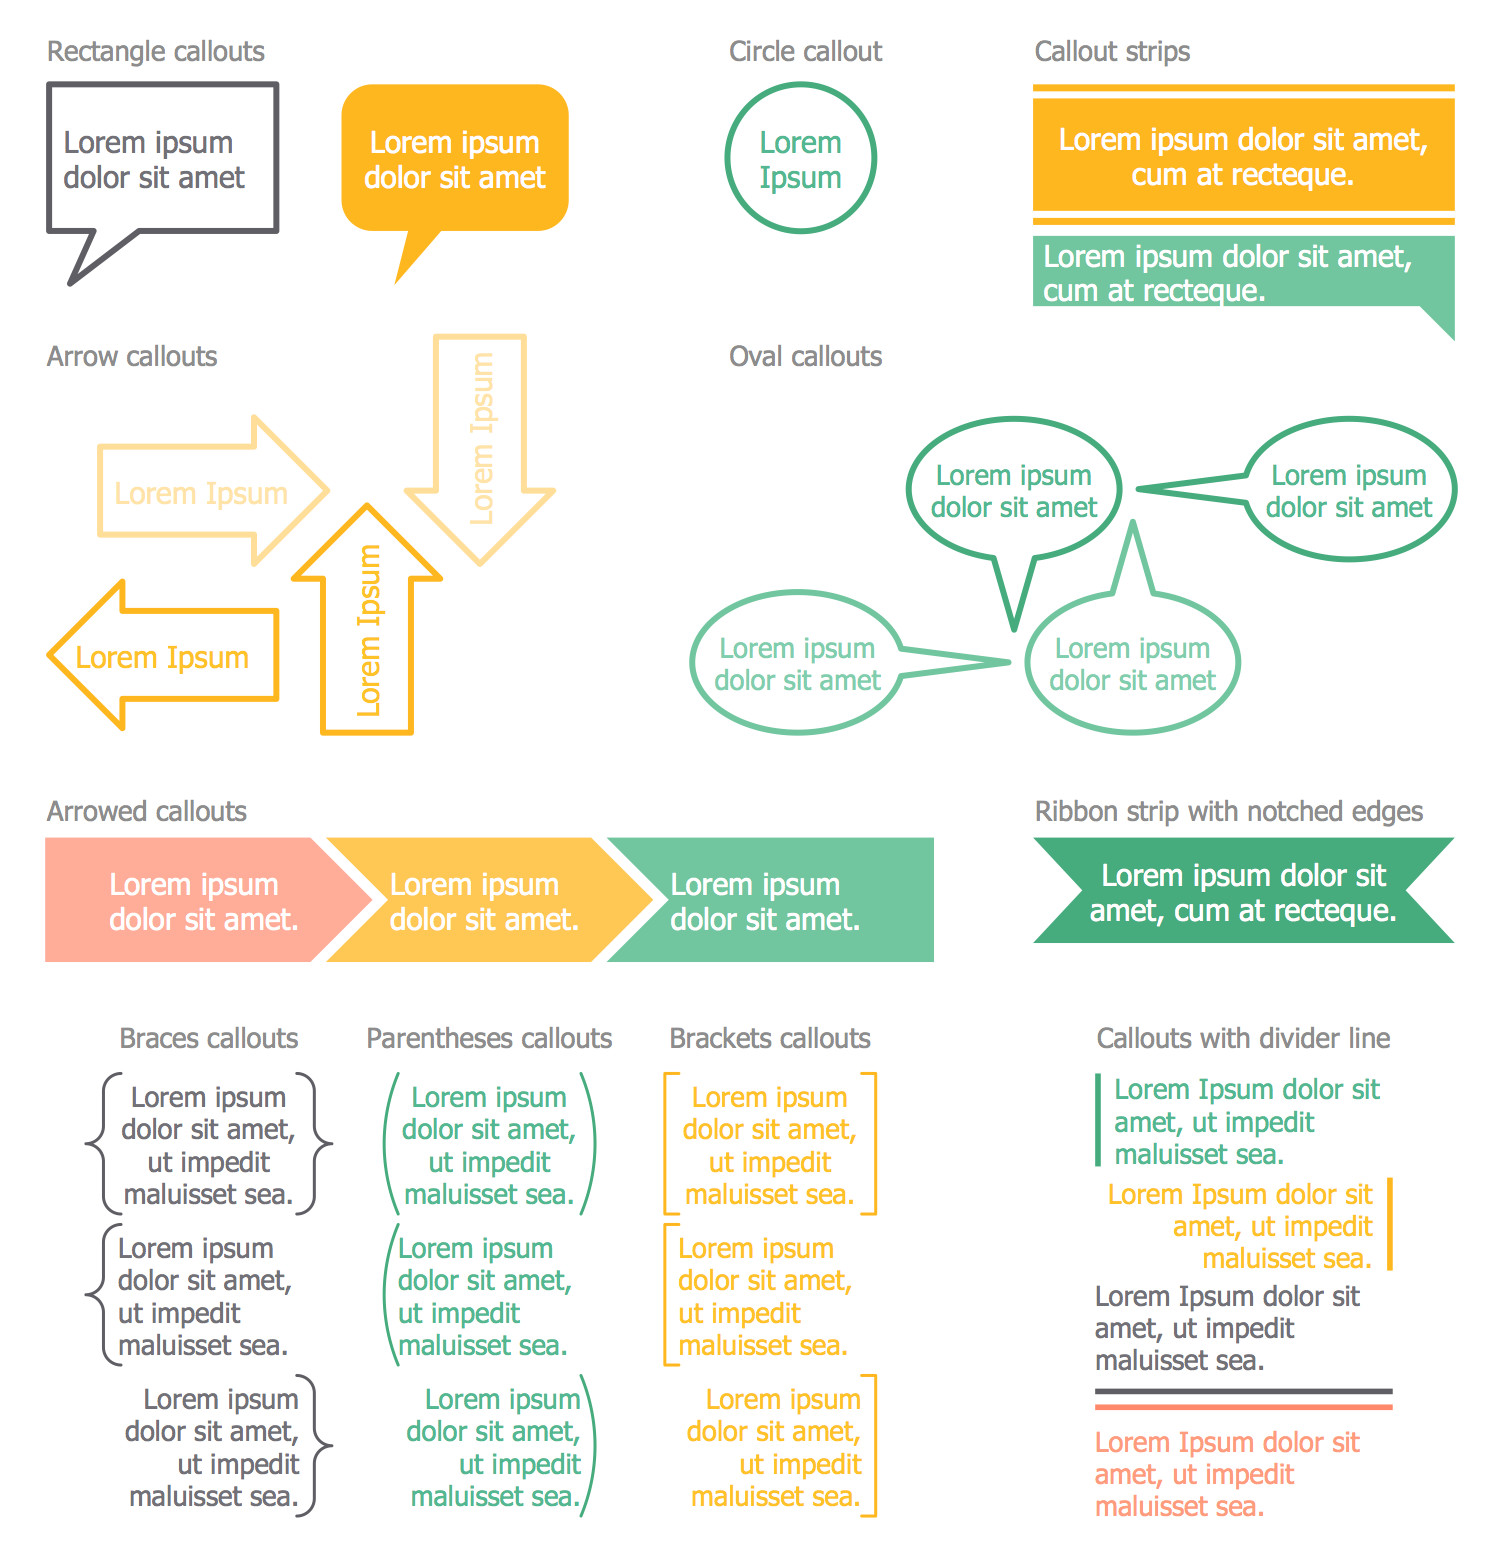
Design Elements — Financial Callouts
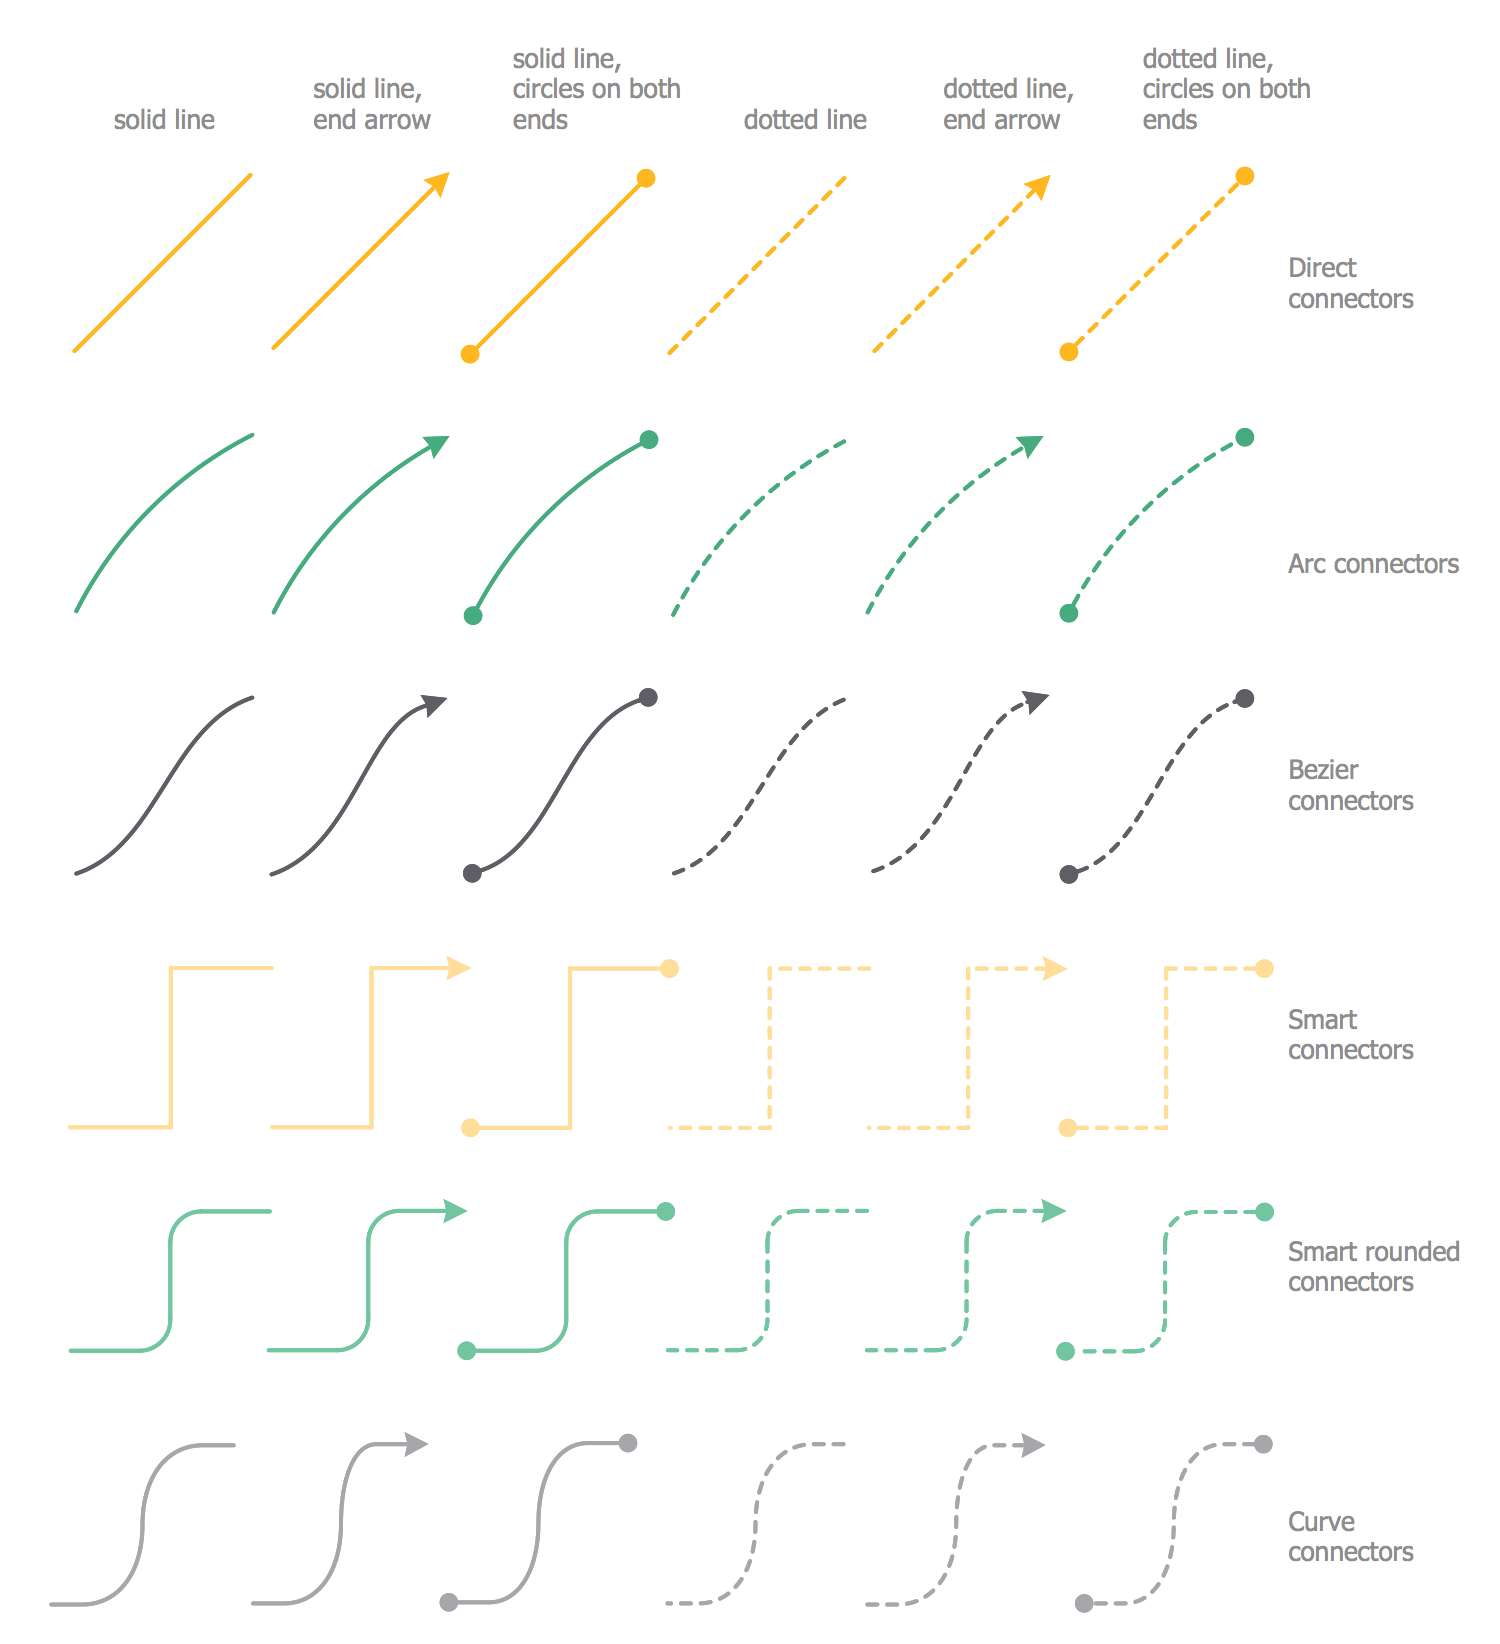
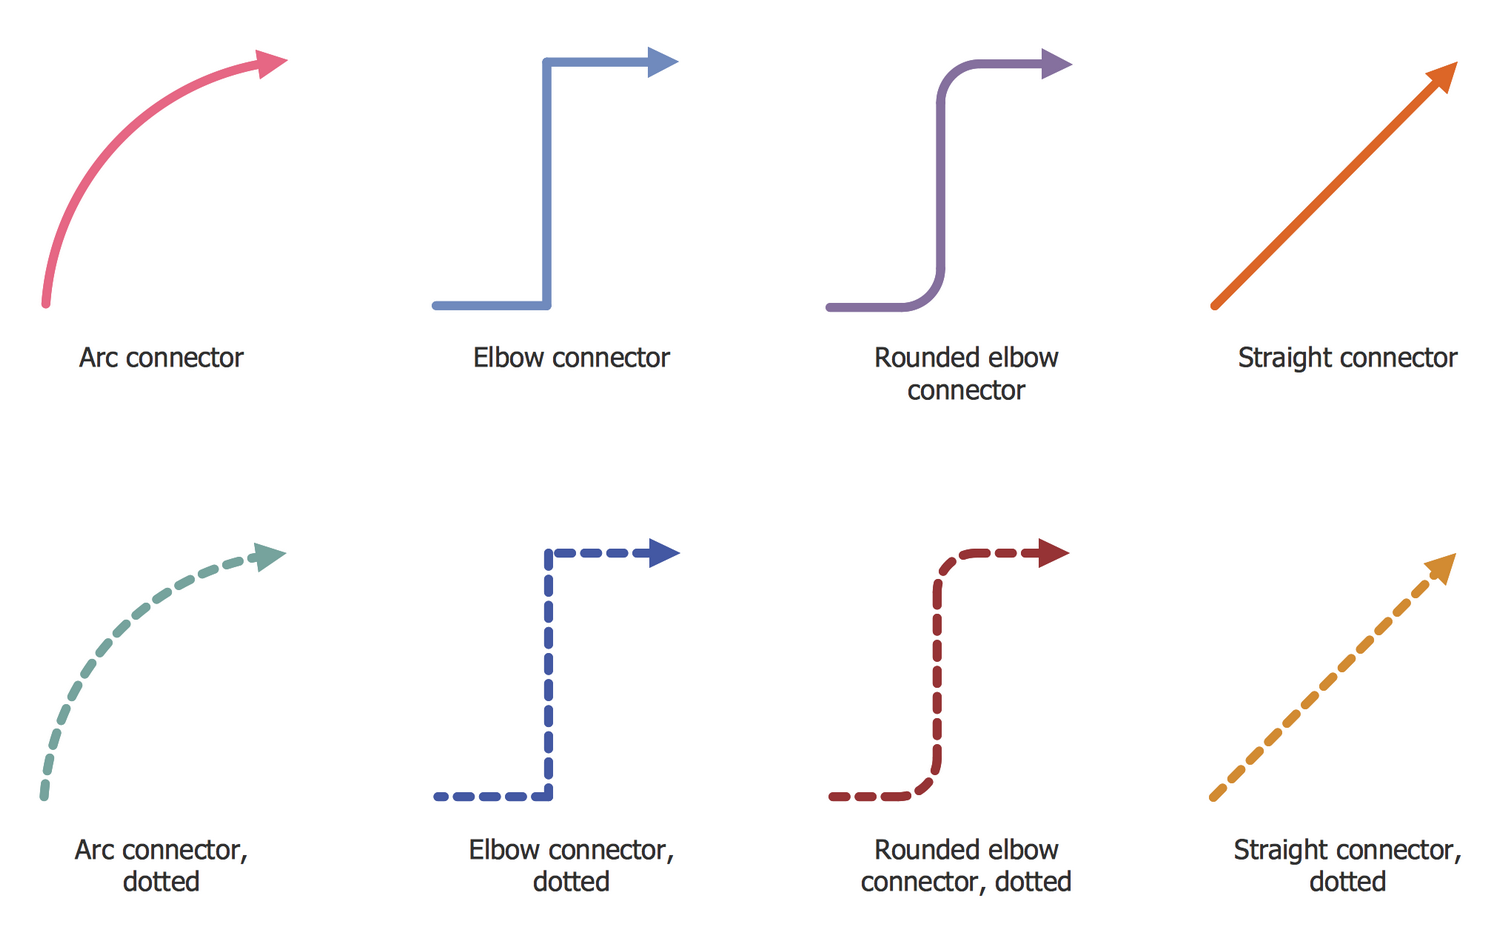
Design Elements — Financial Connectors
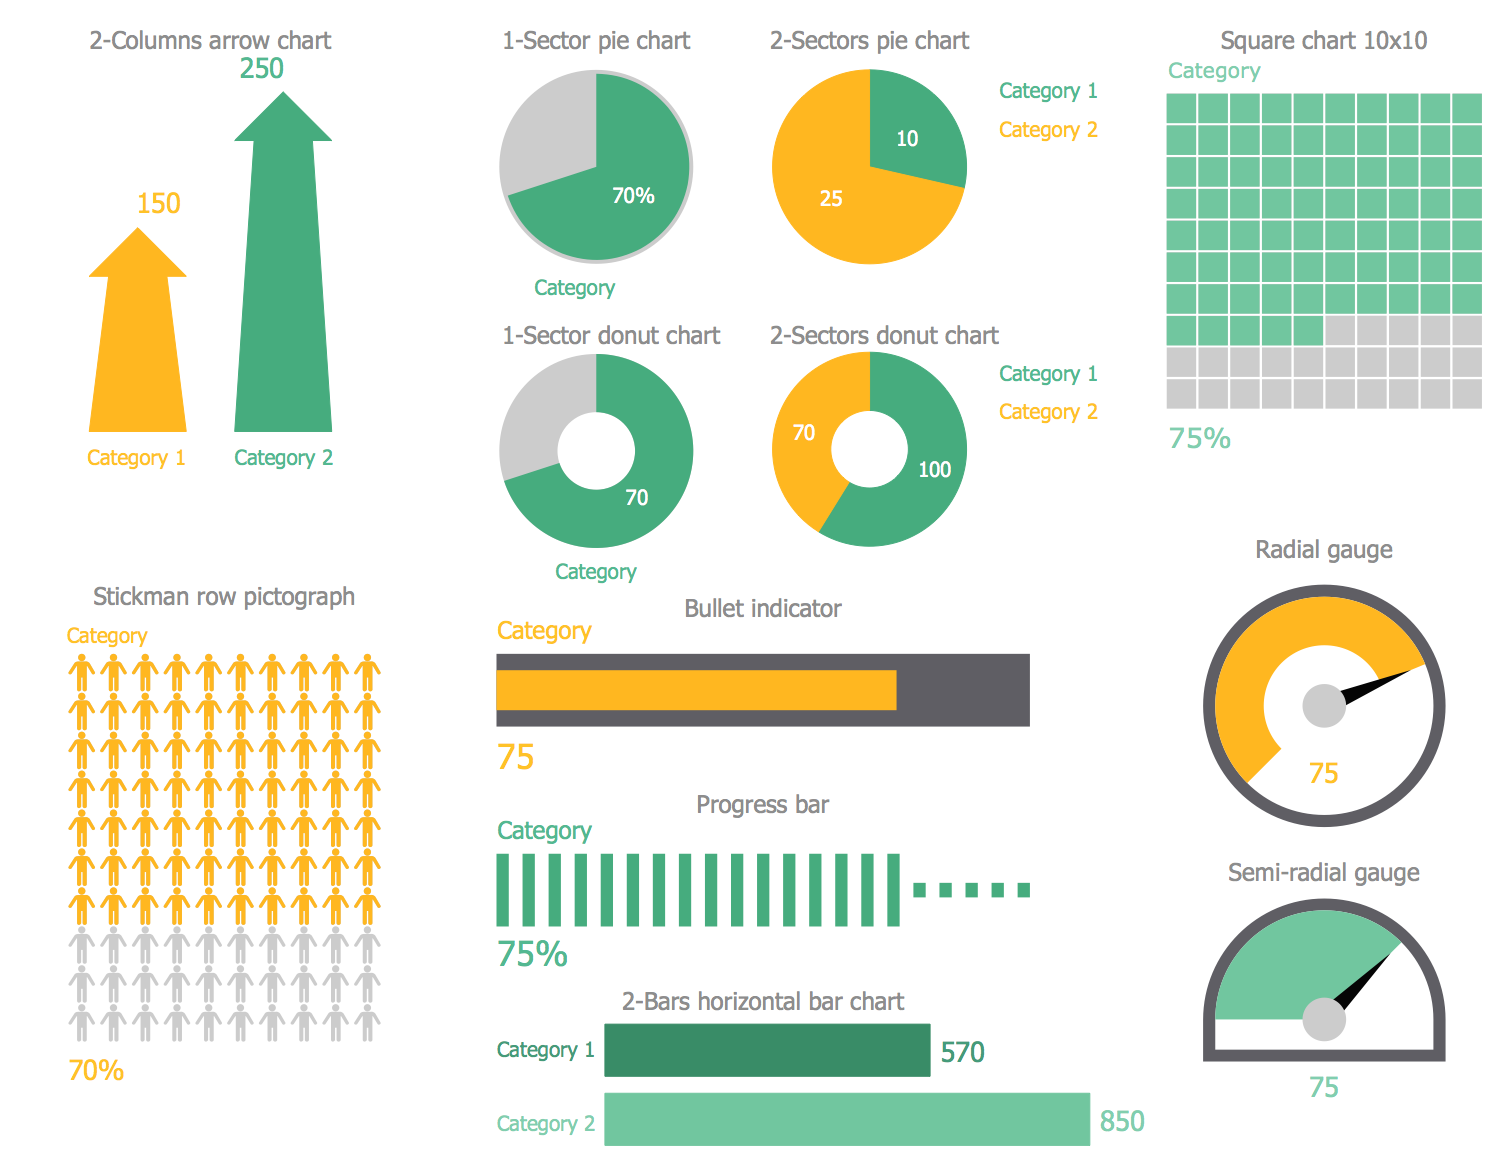
Design Elements — Financial Indicators
Design Elements — Financial Lists
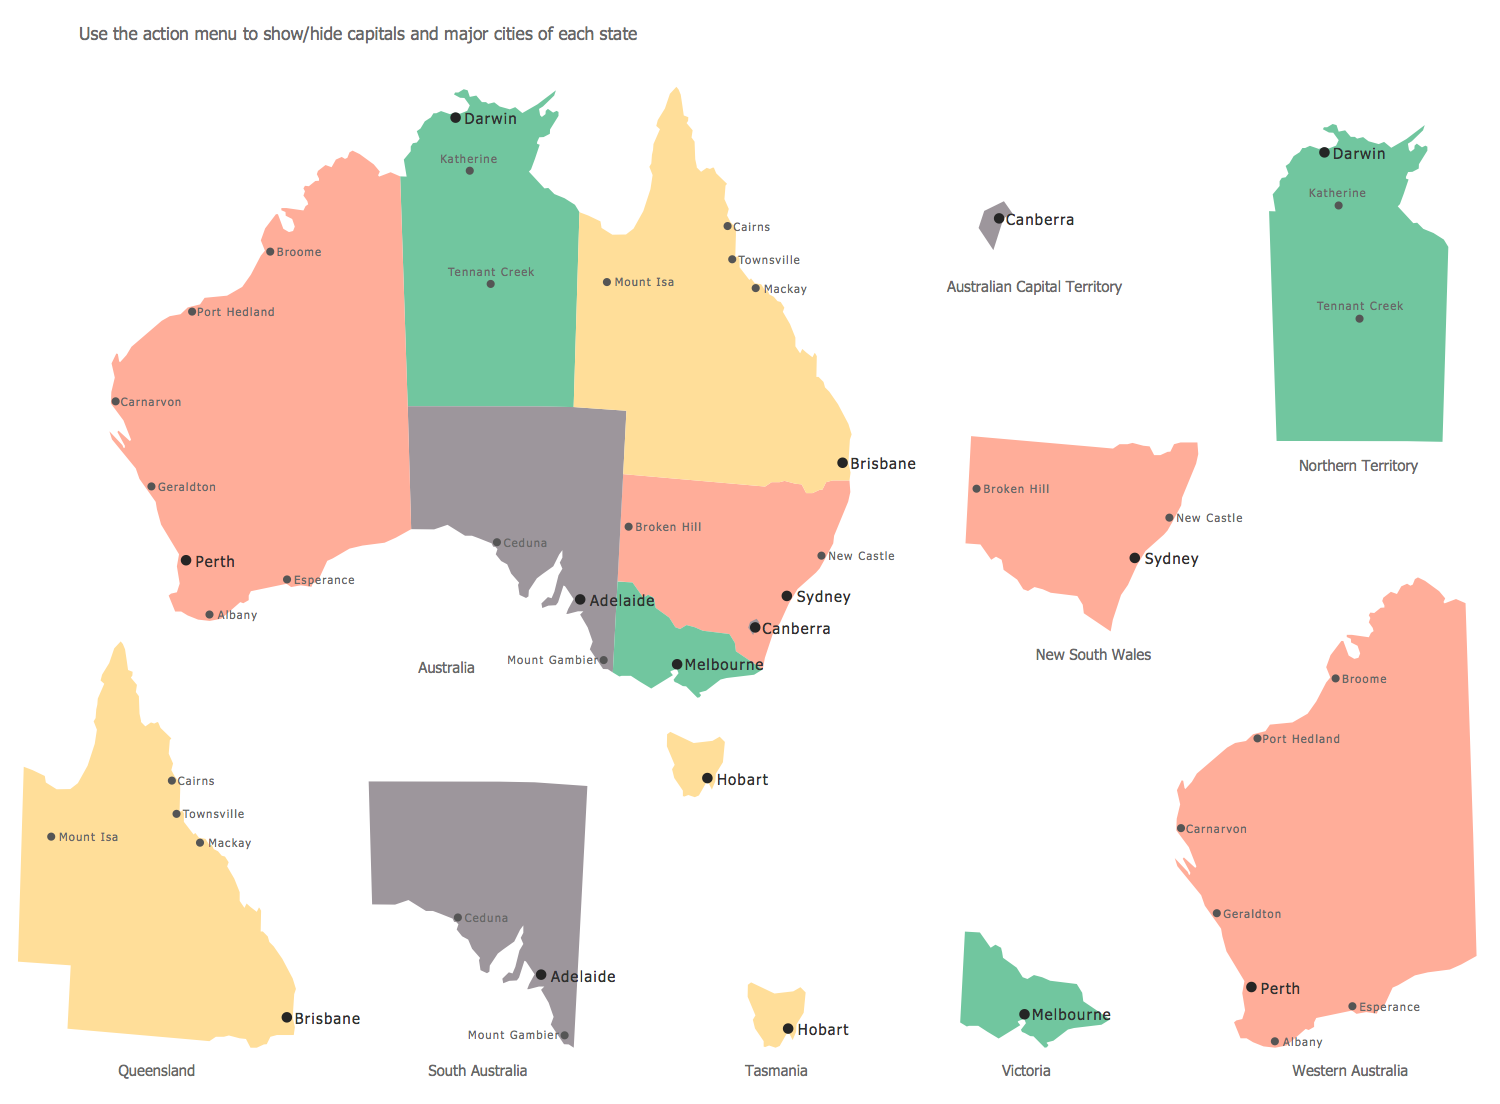
Design Elements — Financial Map Australia
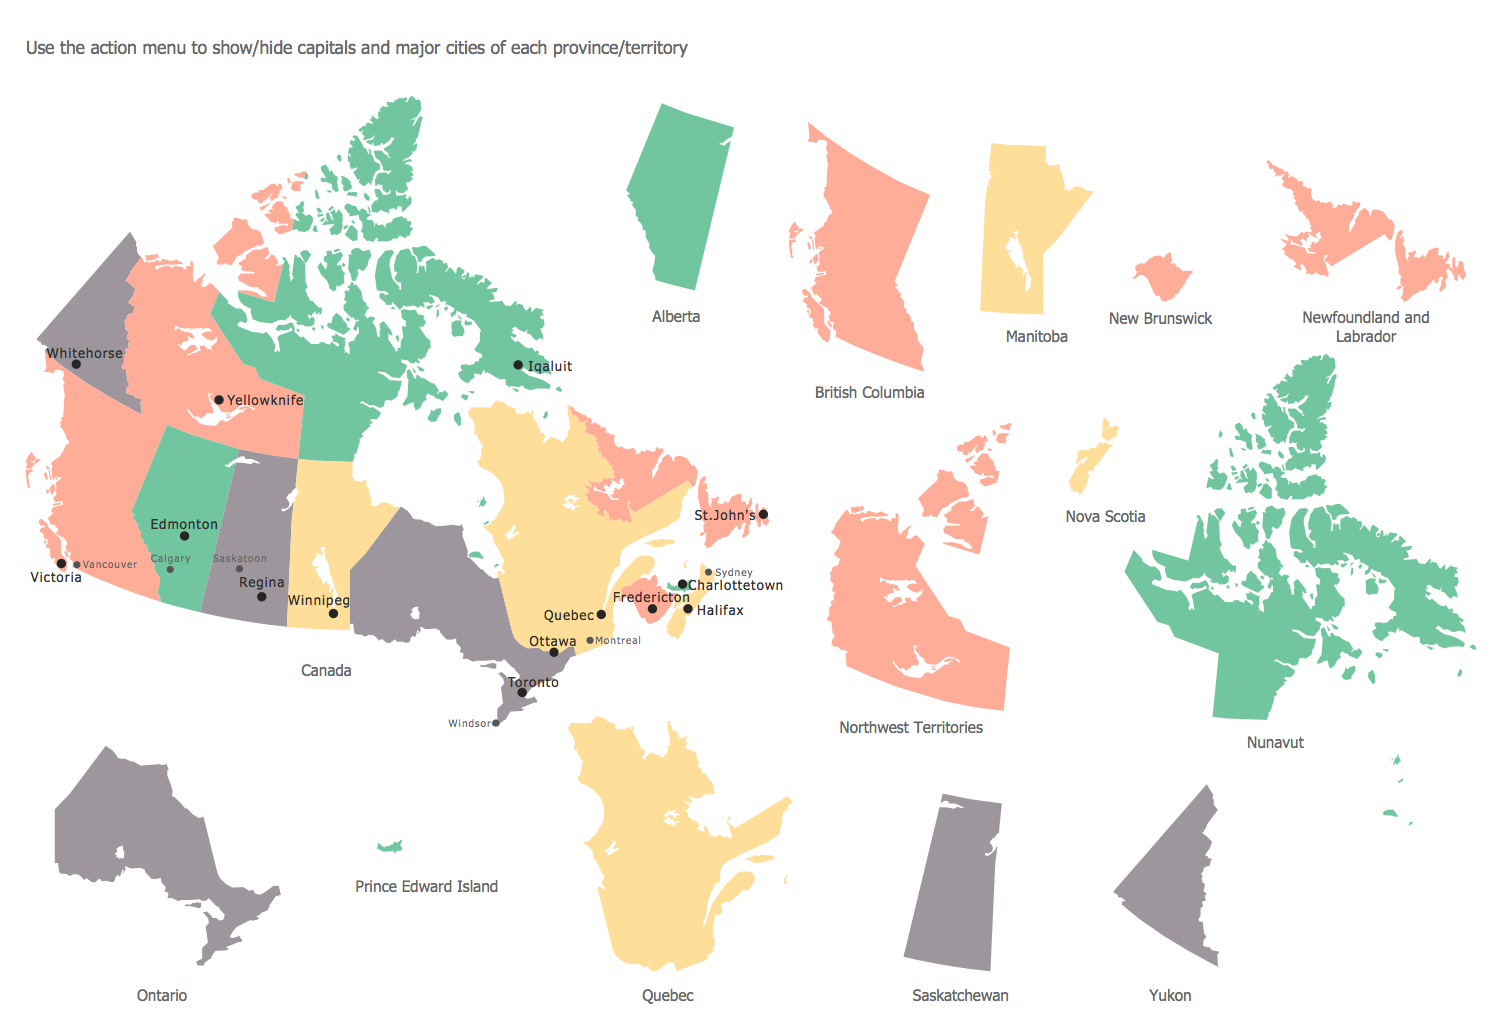
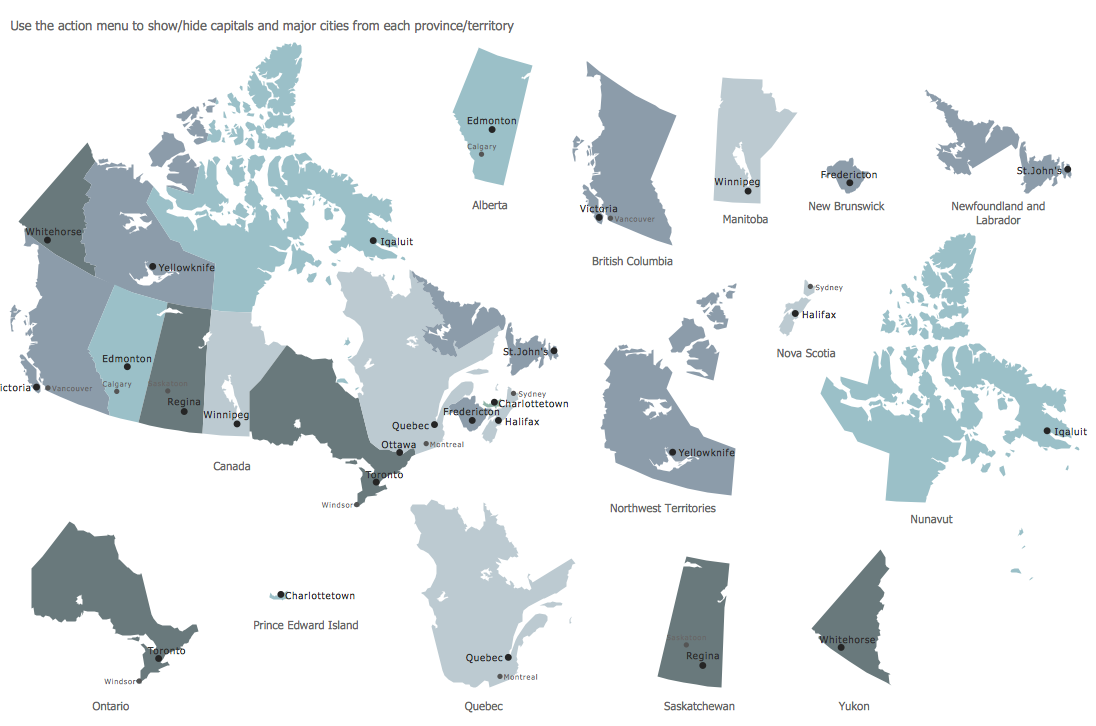
Design Elements — Financial Map Canada
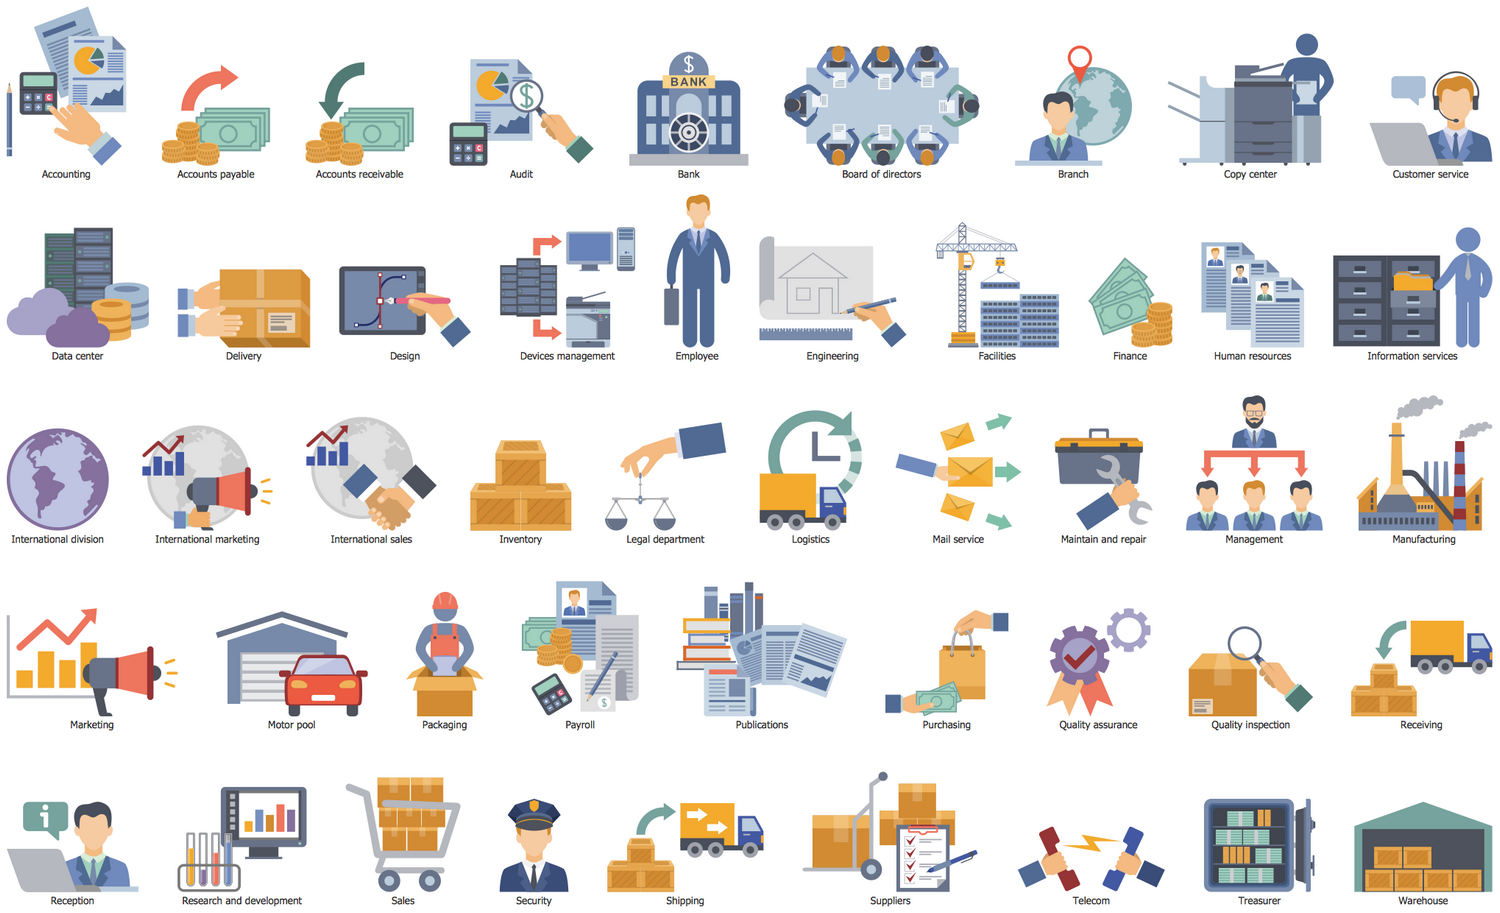
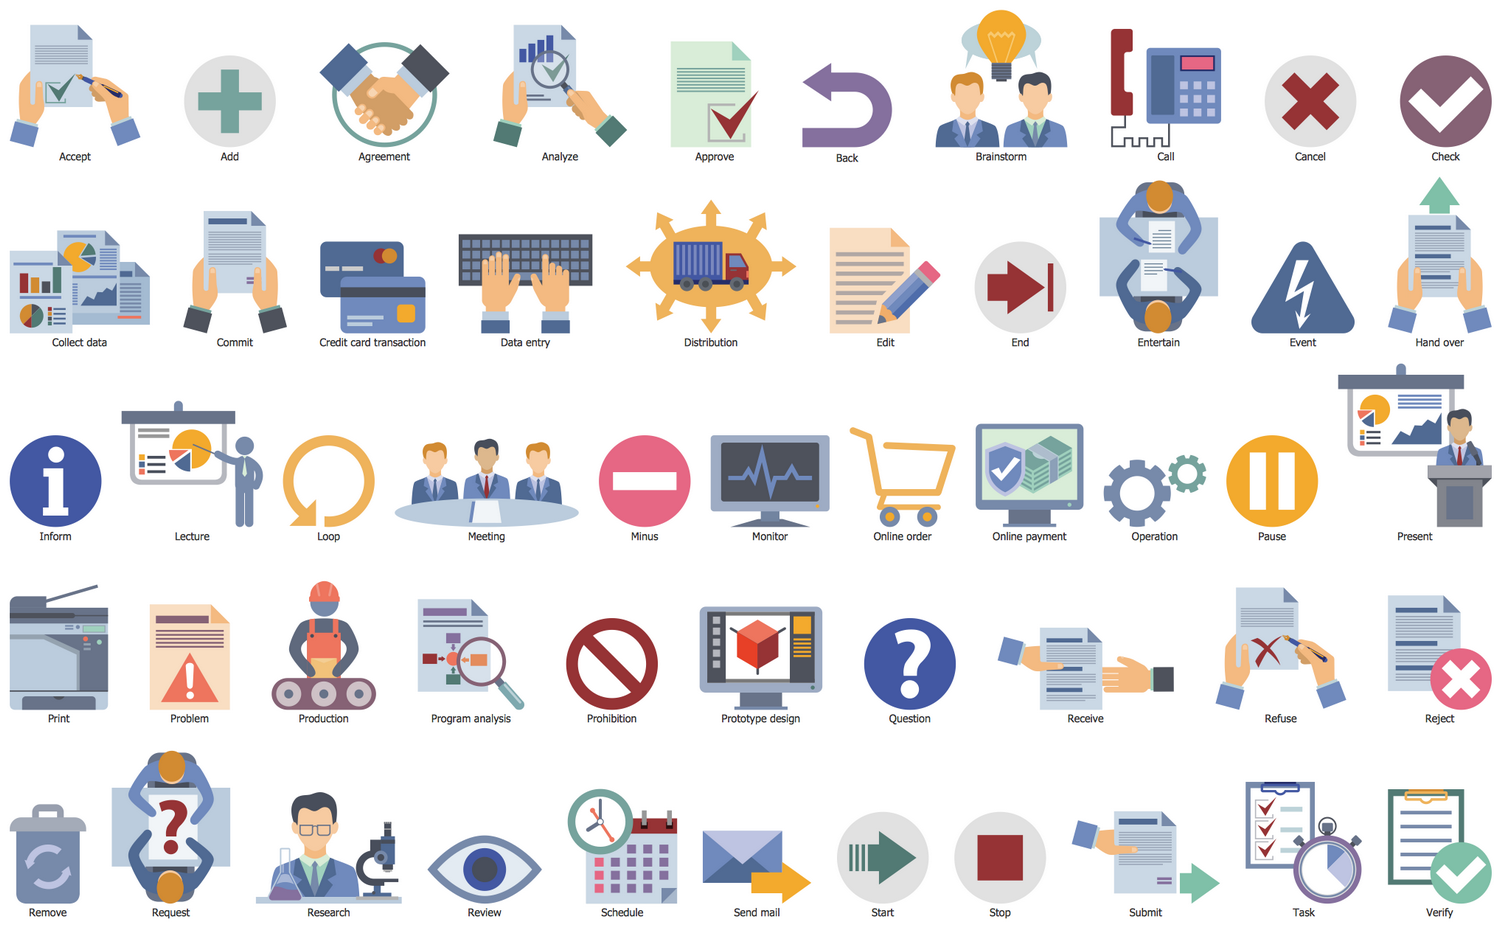
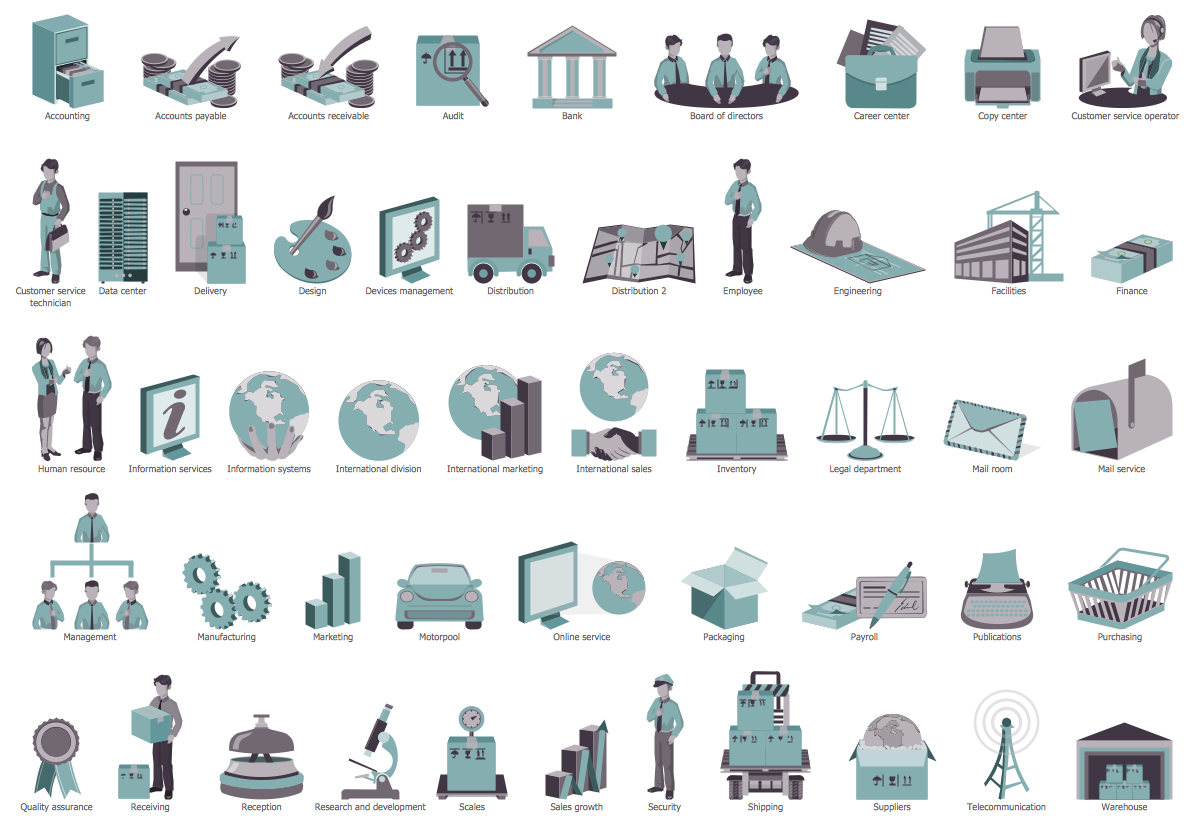
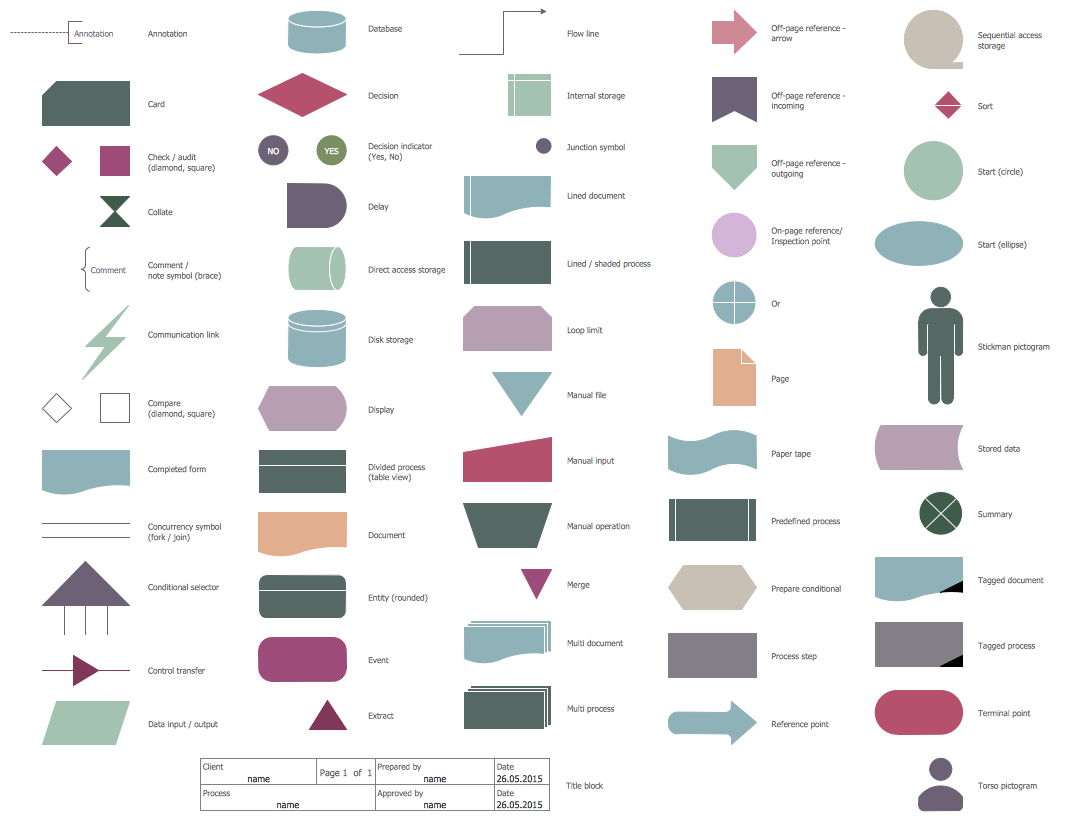
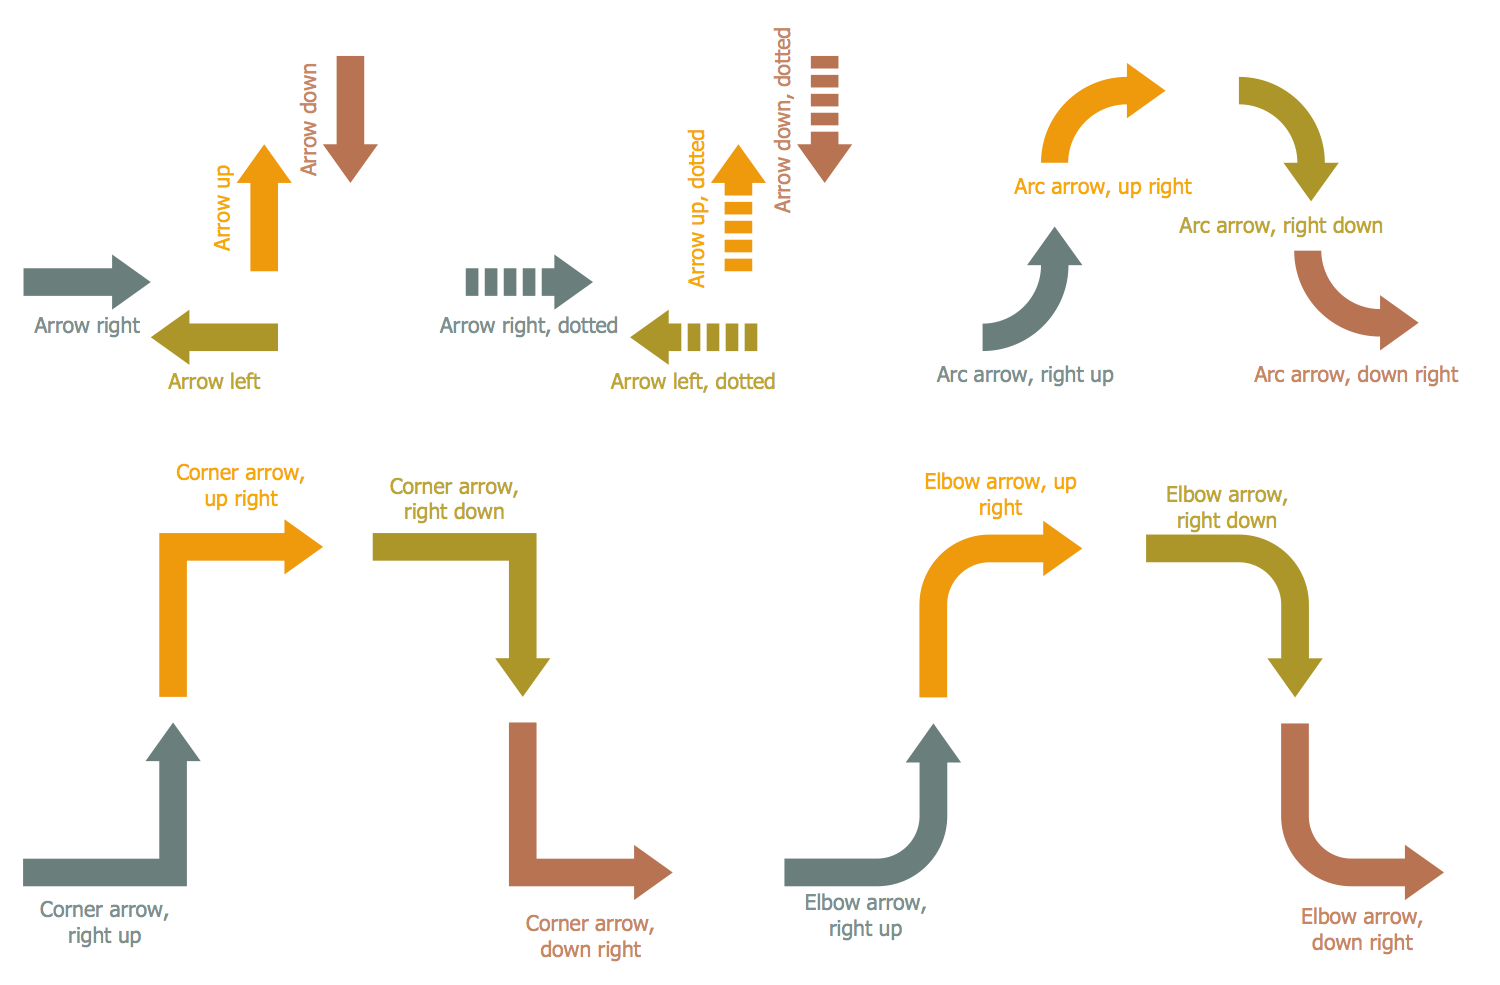
Business Process Workflow Diagrams Solution
Achieve a success in business analysis, documenting complex business processes and process flows, business process optimization and drawing Business Process Workflow Diagram, Business Process Flow Diagram, schematics, flowcharts, and infographics with Business Process Workflow Diagrams solution for ConceptDraw DIAGRAM software.
There are 10 stencil libraries containing 317 vector graphics and 10 examples in the Business Process Workflow Diagrams solution.
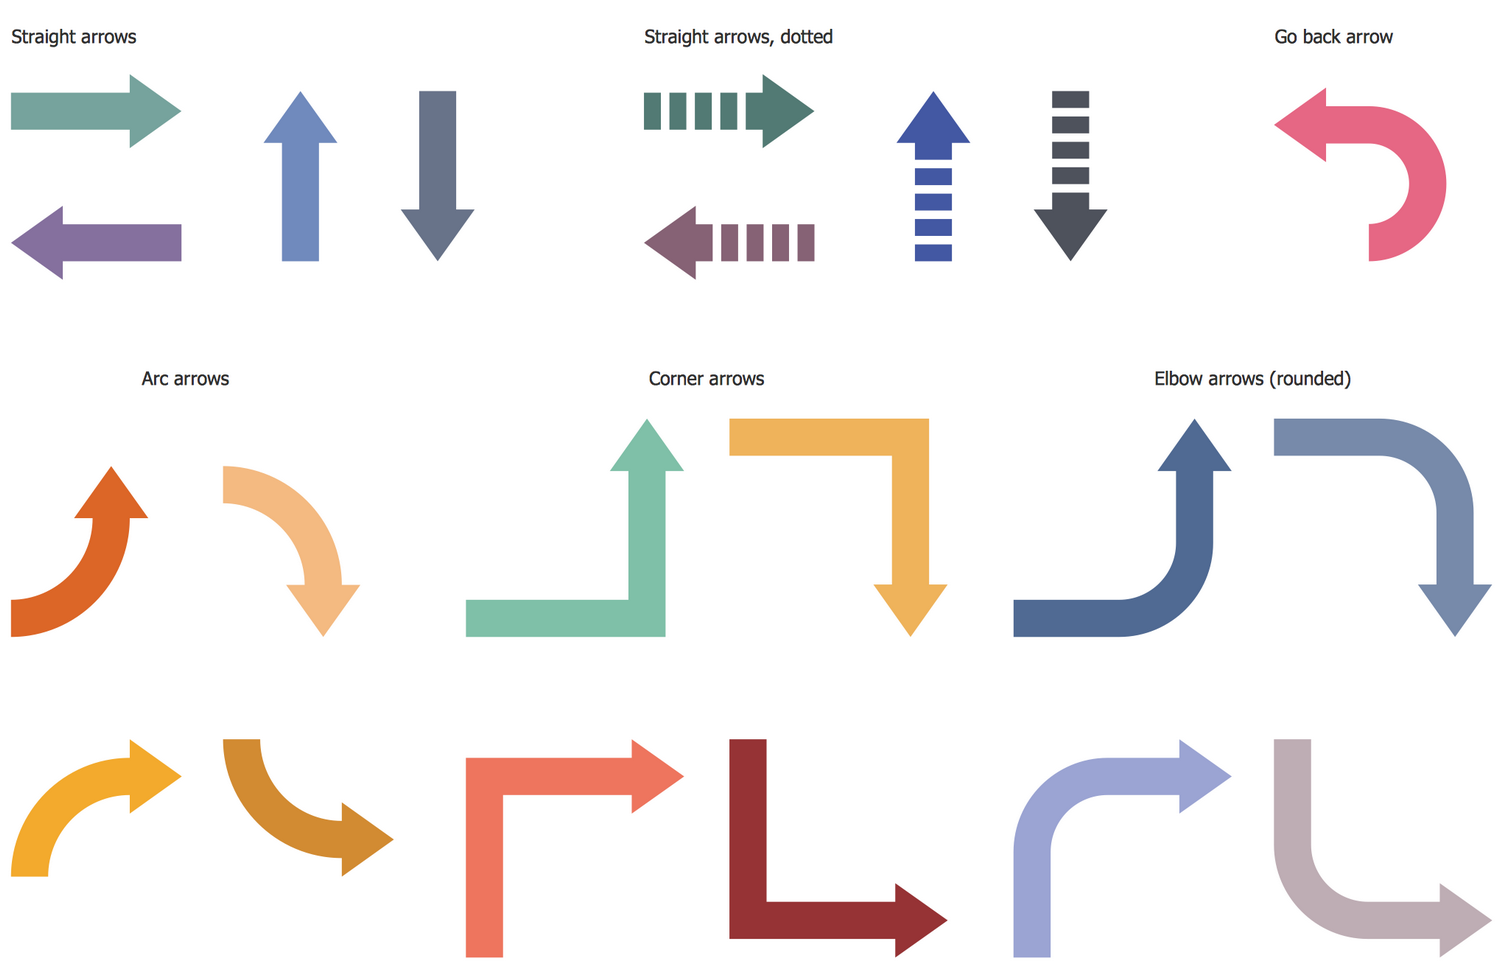
Design Elements — Workflow Arrows
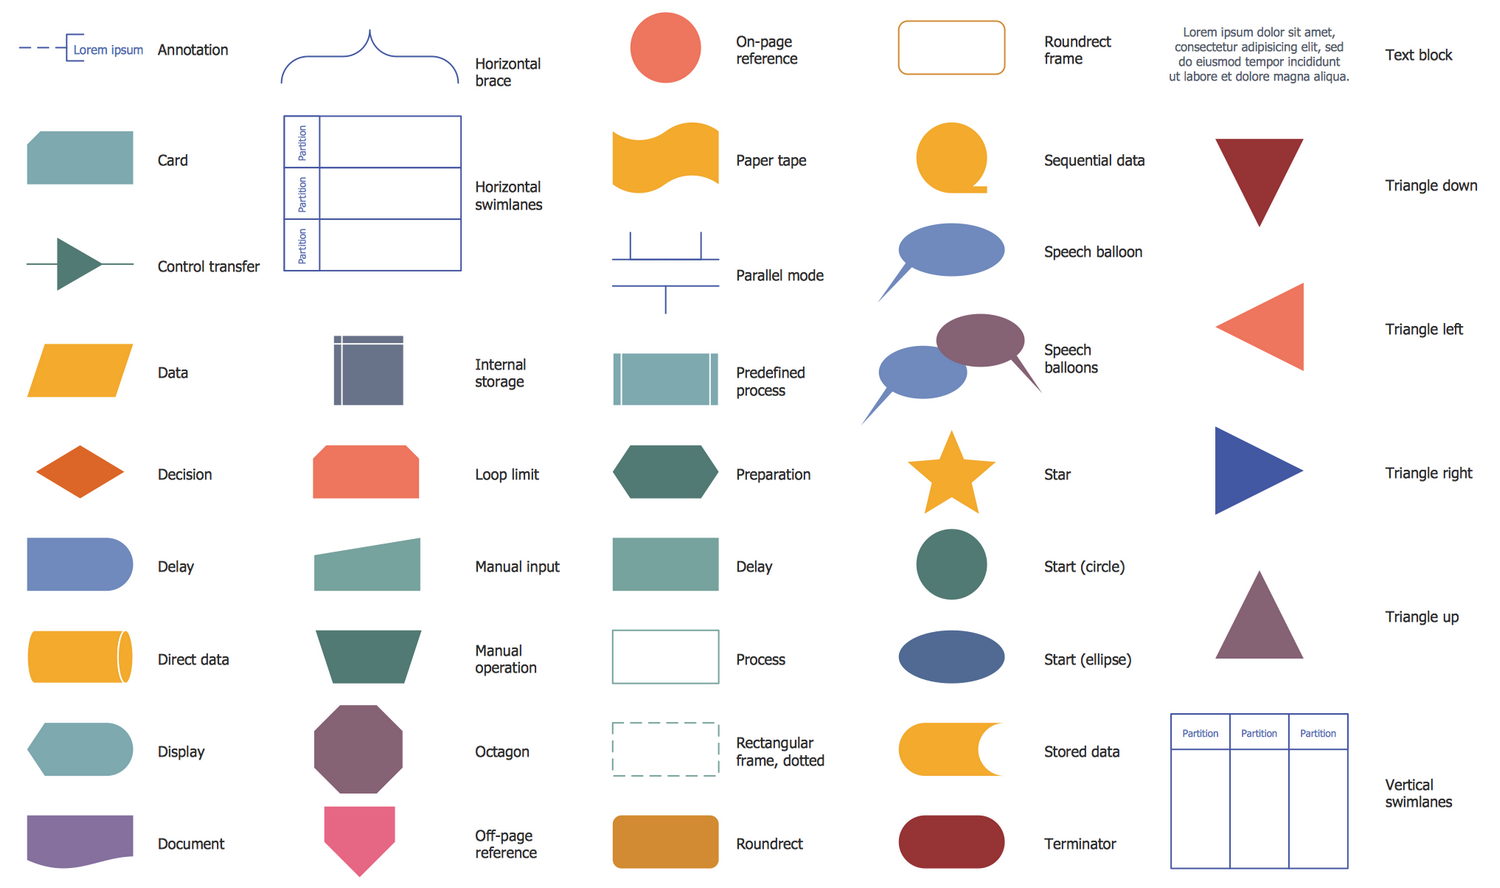
Design Elements — Workflow Charts
Design Elements — Workflow Connectors
Design Elements — Workflow Departments
Design Elements — Workflow Finance
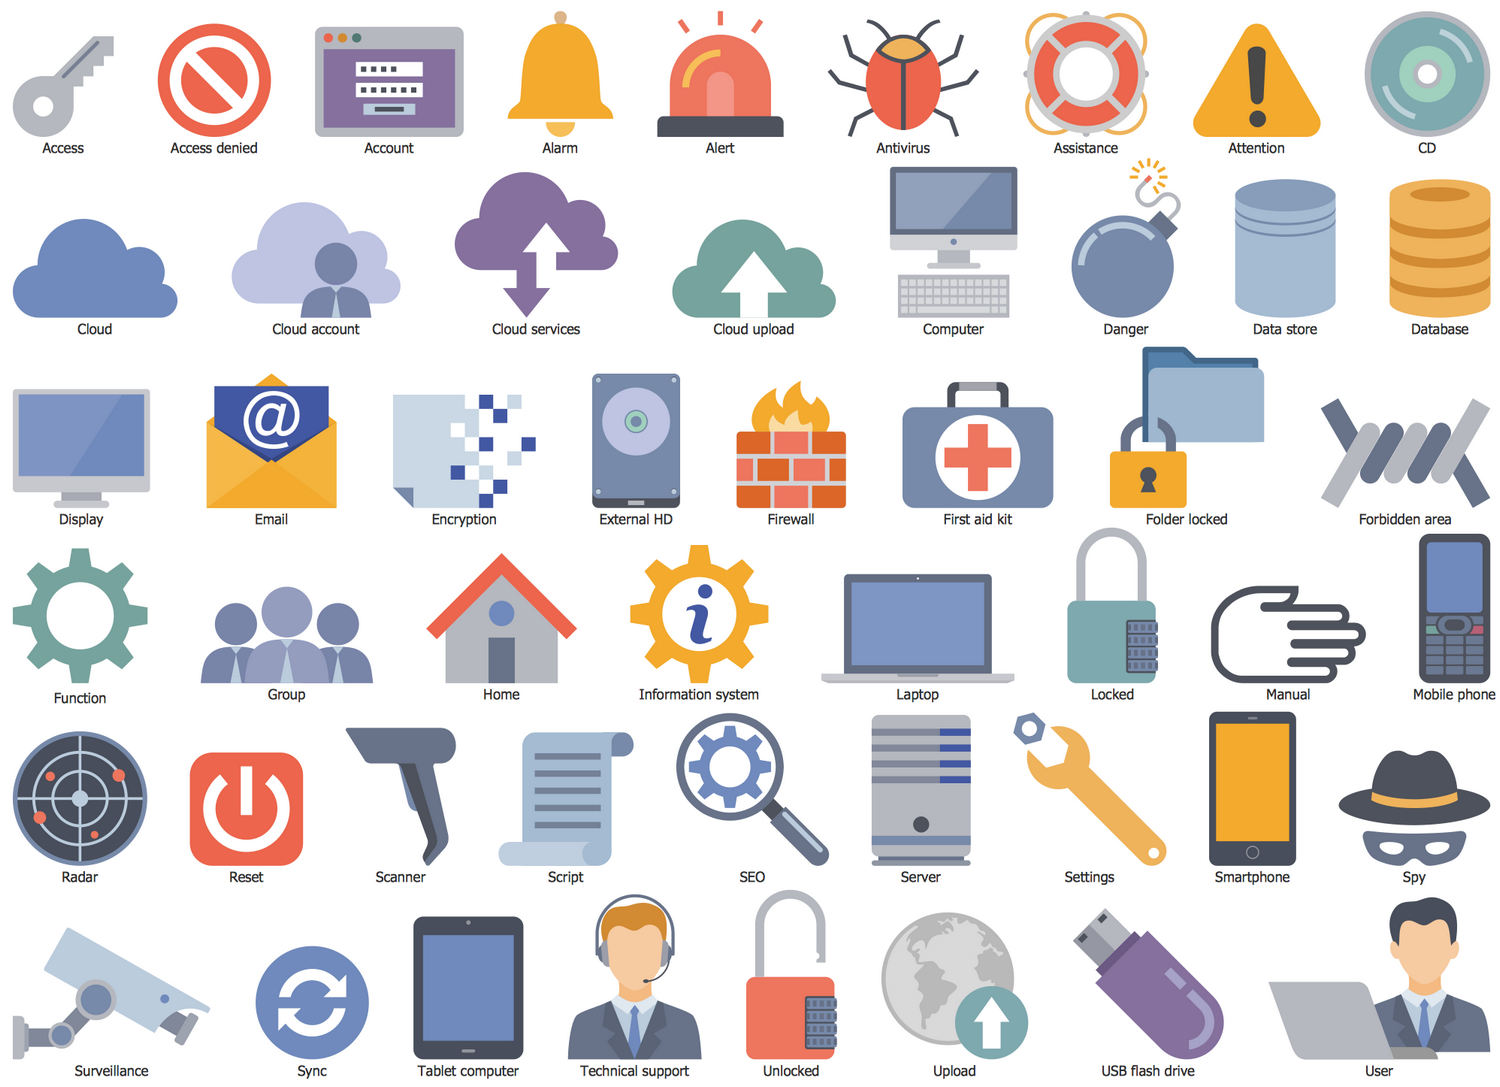
Design Elements — Workflow IT and Security
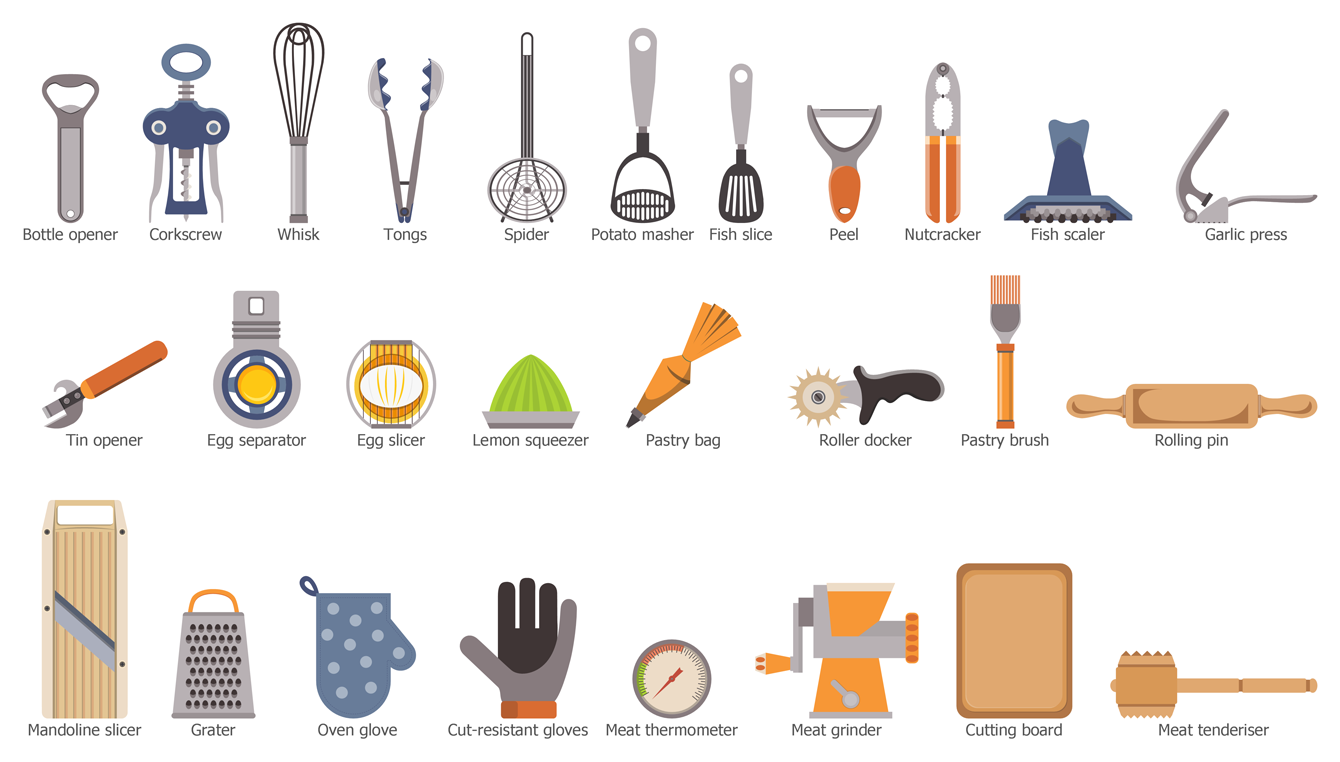
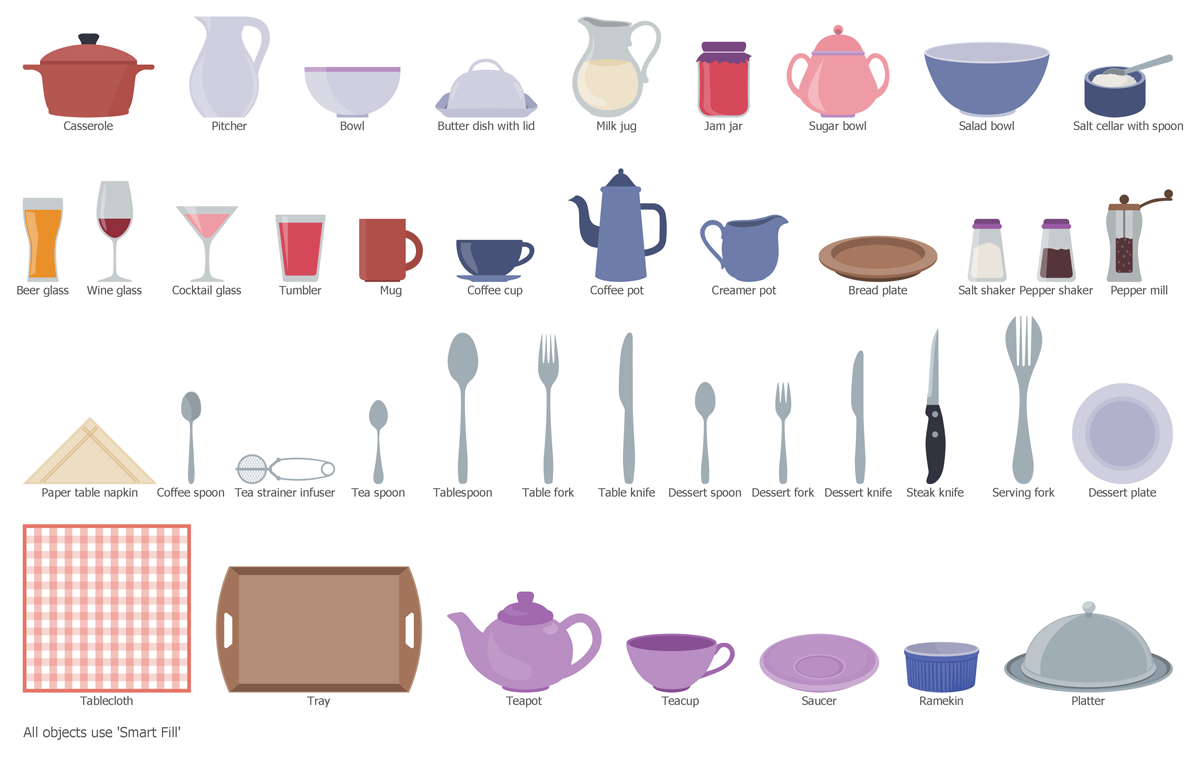
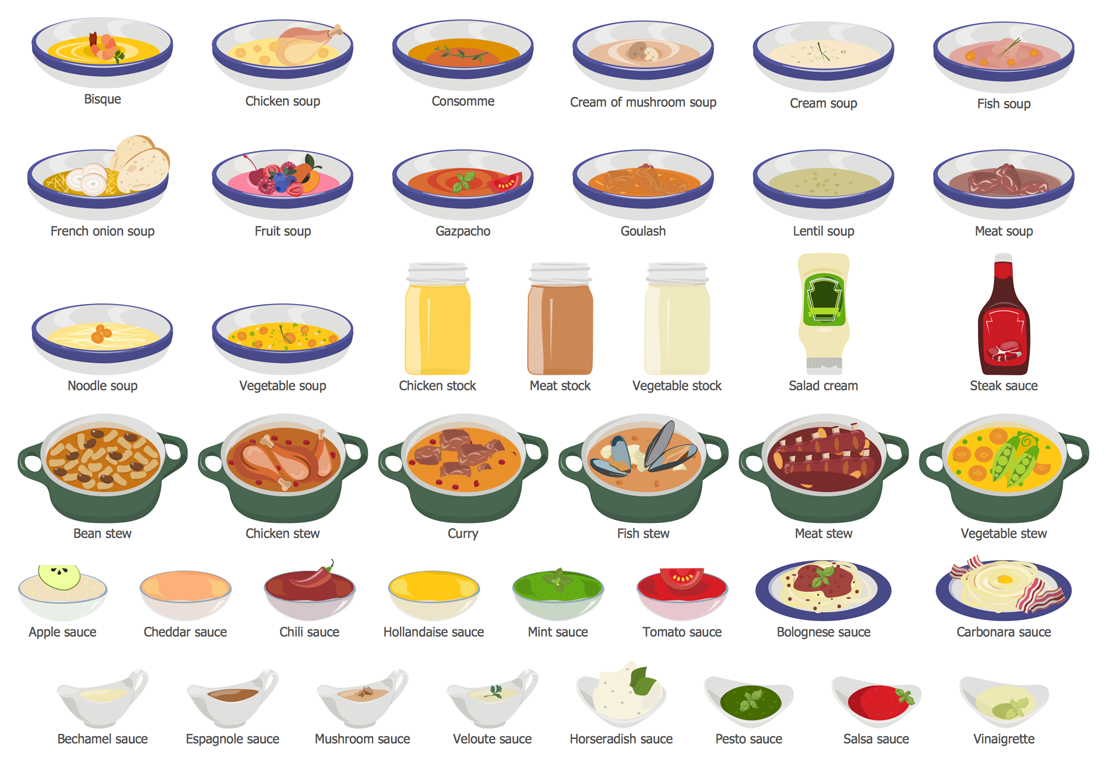
Cooking Recipes Solution
Decorate delectable diagrams with a feast of culinary clipart, and take inspiration from our tasty menu of pre-designed recipe samples and templates.
There are 14 libraries containing 565 vector objects and 10 examples in the Cooking Recipes solution.
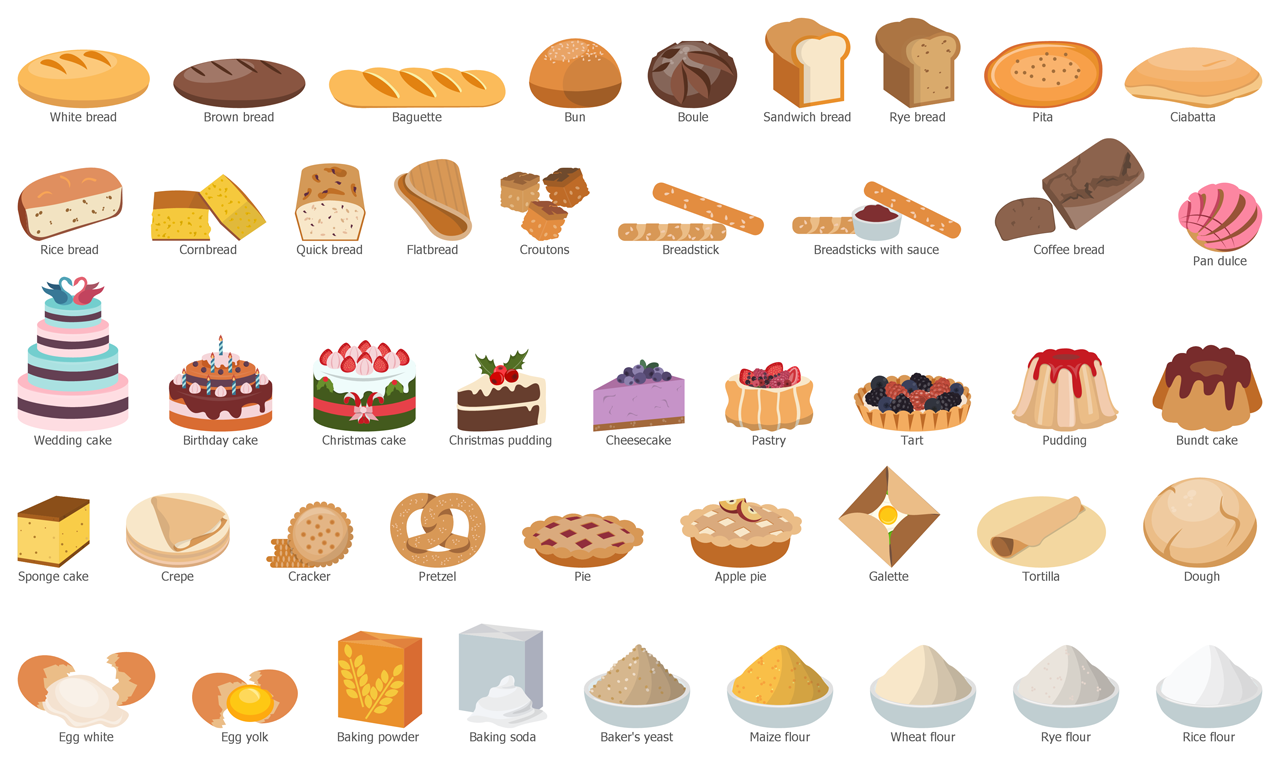
Design Elements — Bread and Baking
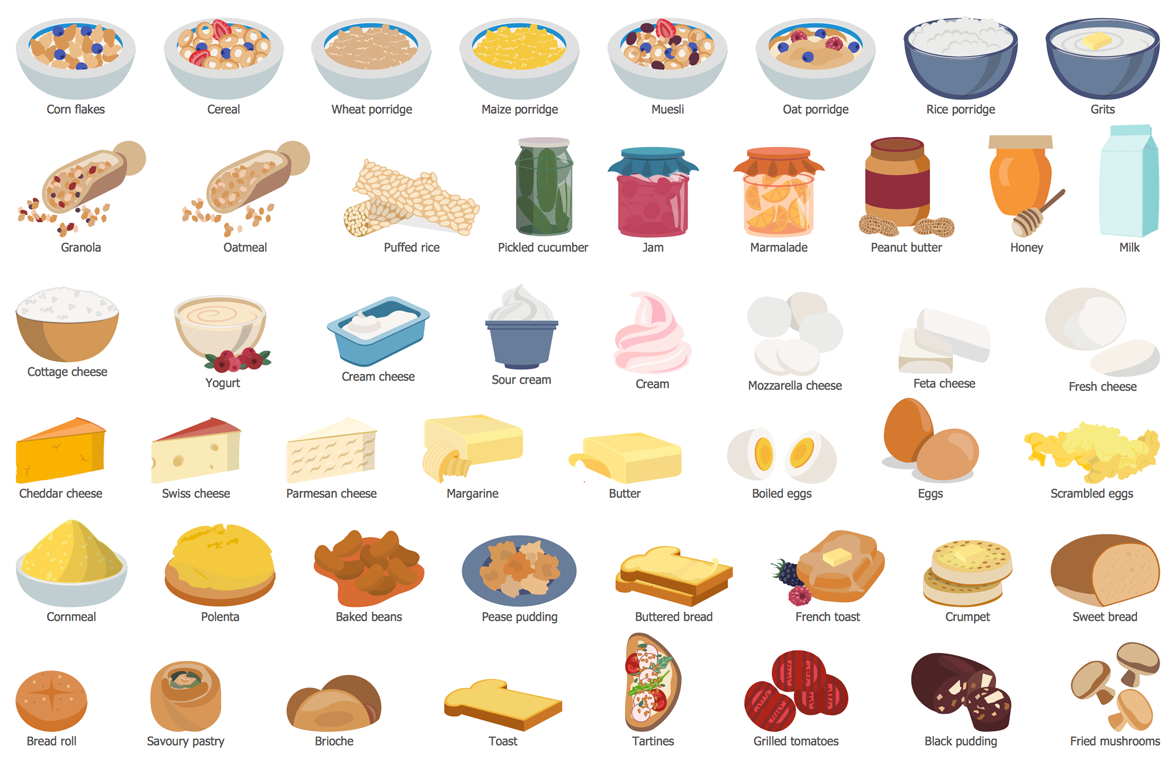
Design Elements — Breakfast
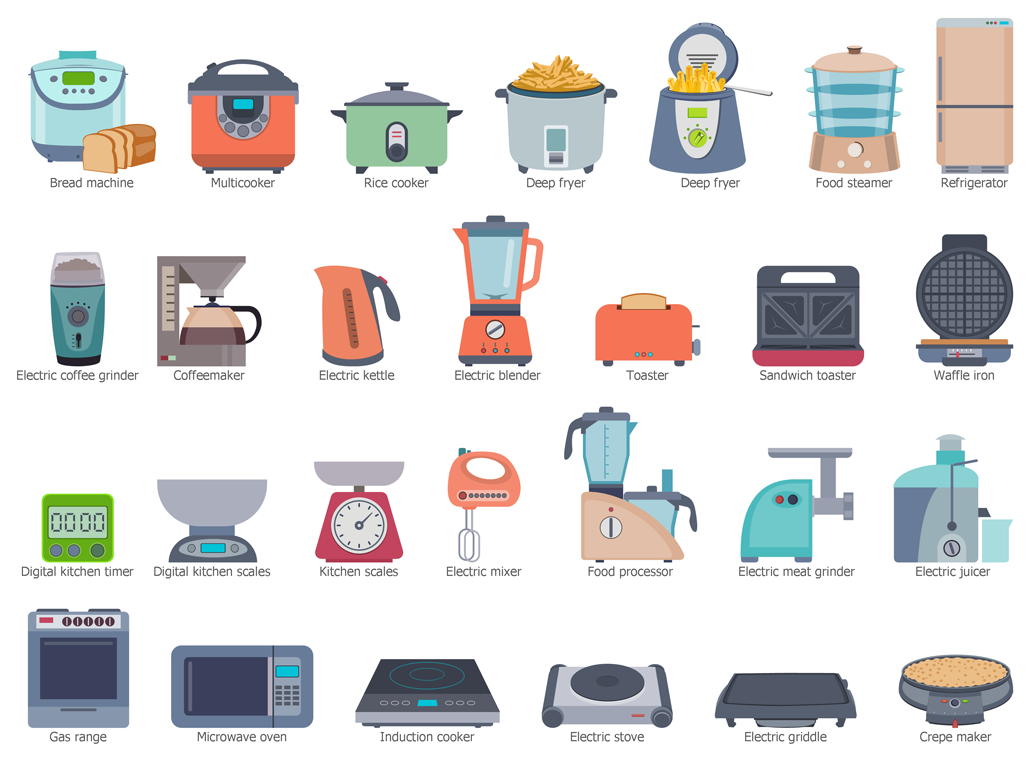
Design Elements — Cooking Appliances
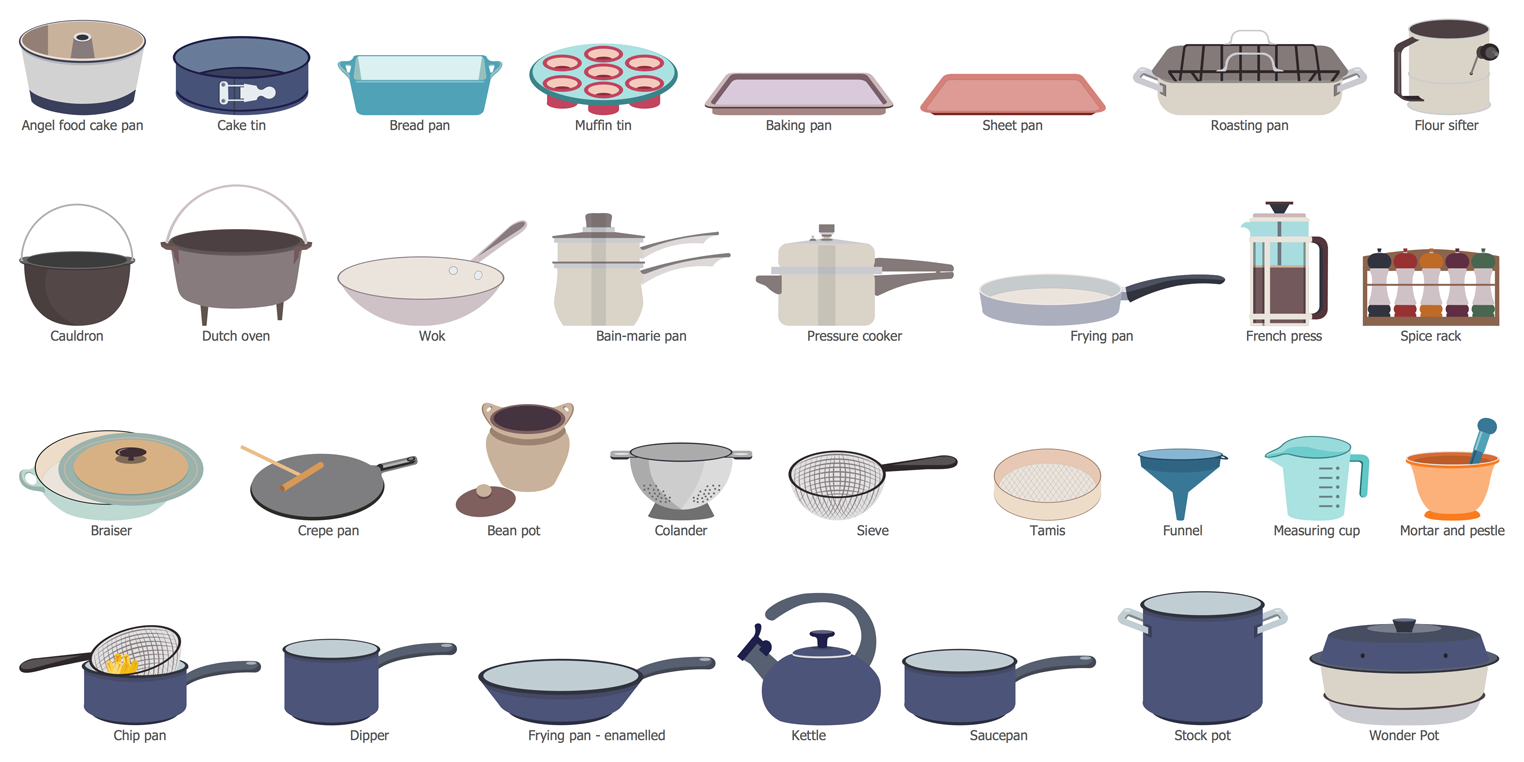
Design Elements — Cookware and Bakeware
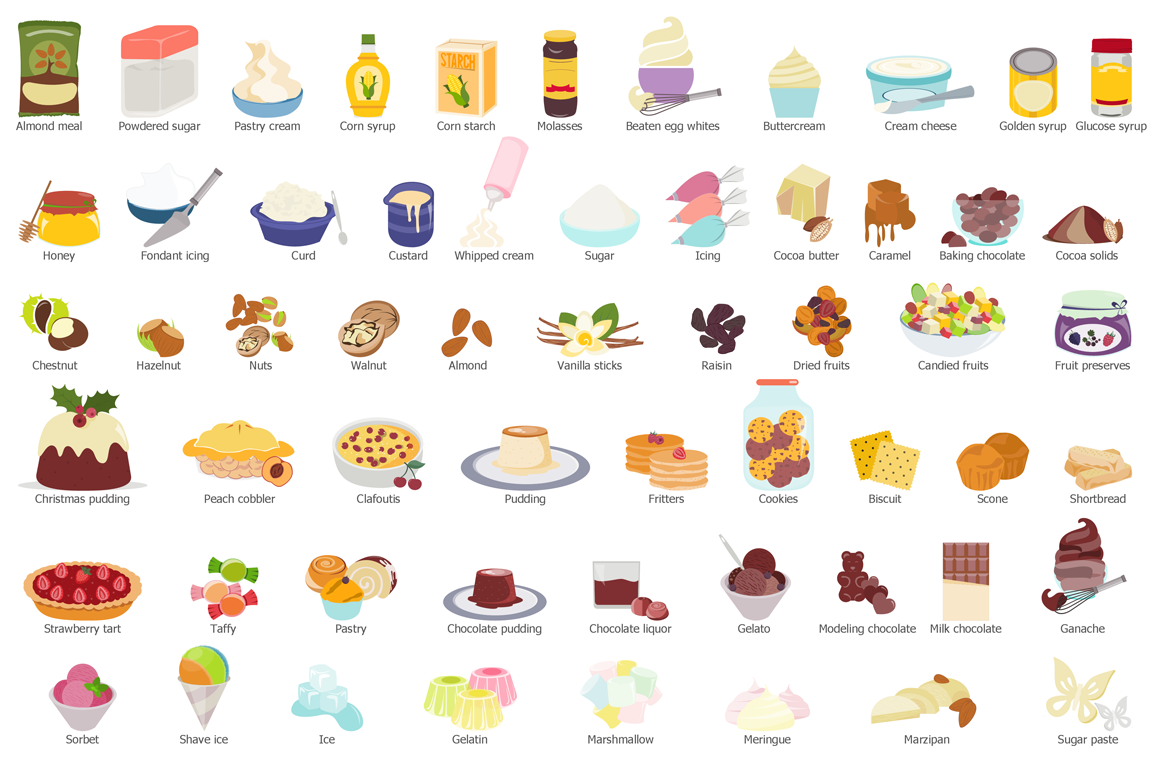
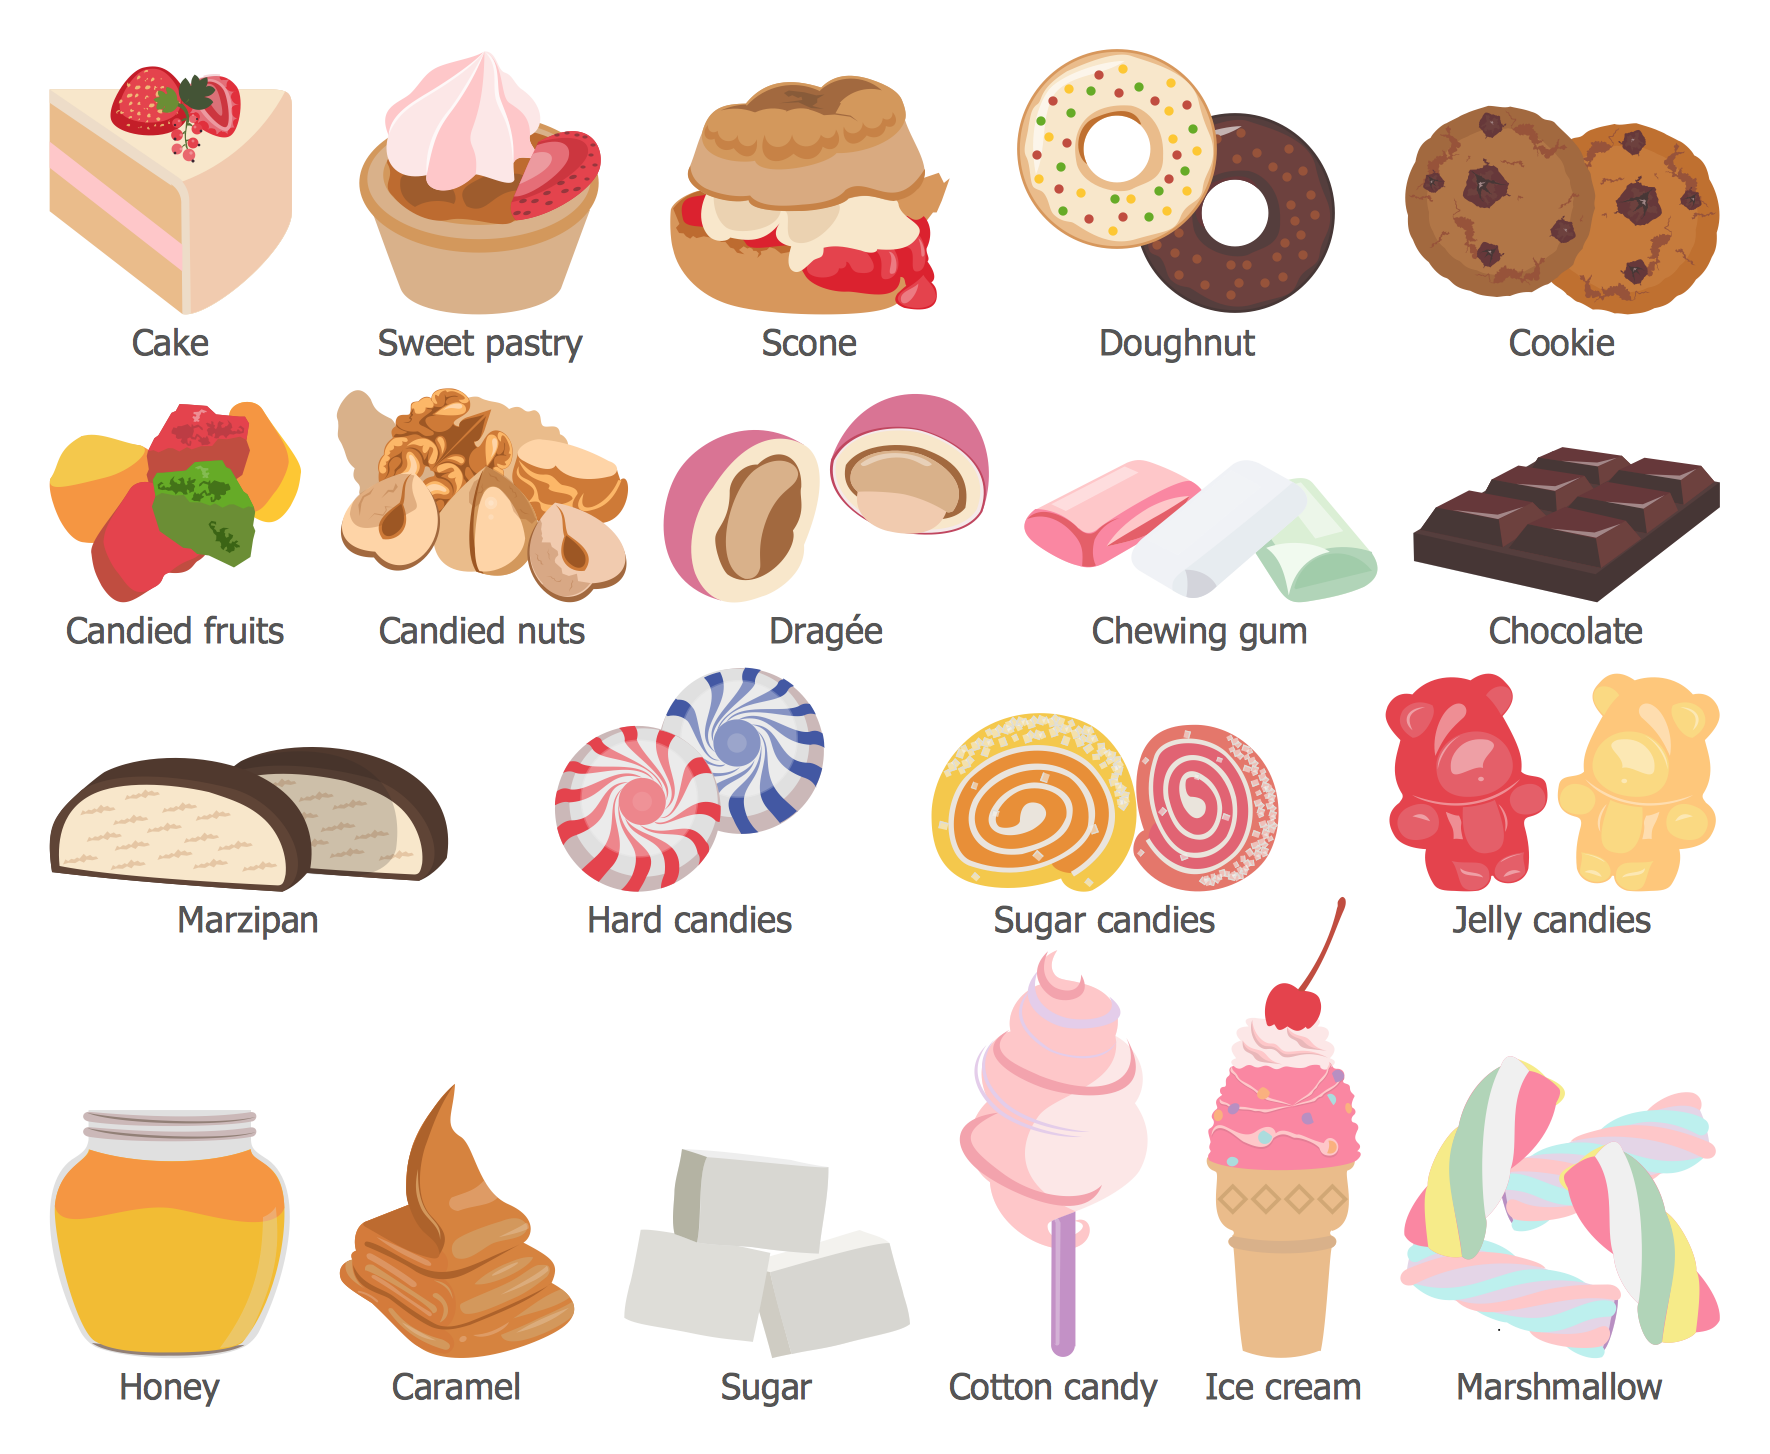
Design Elements — Desserts
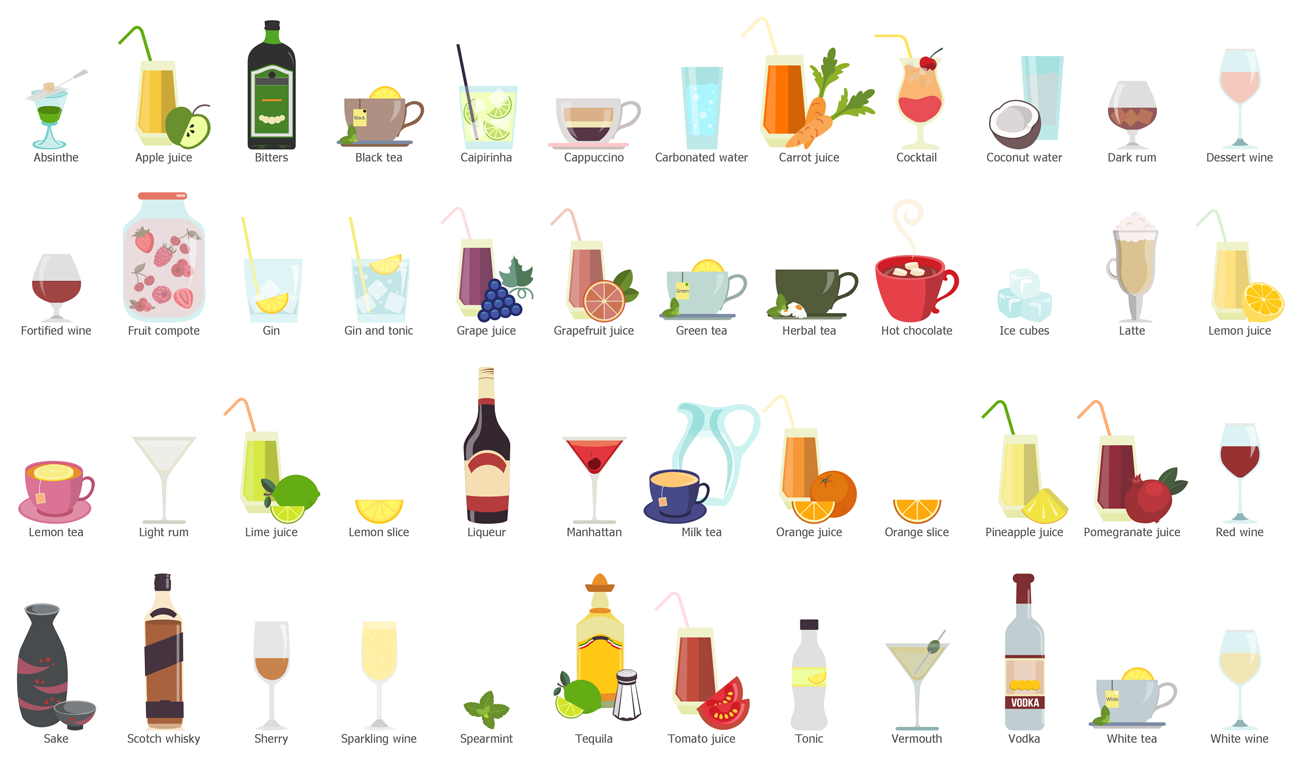
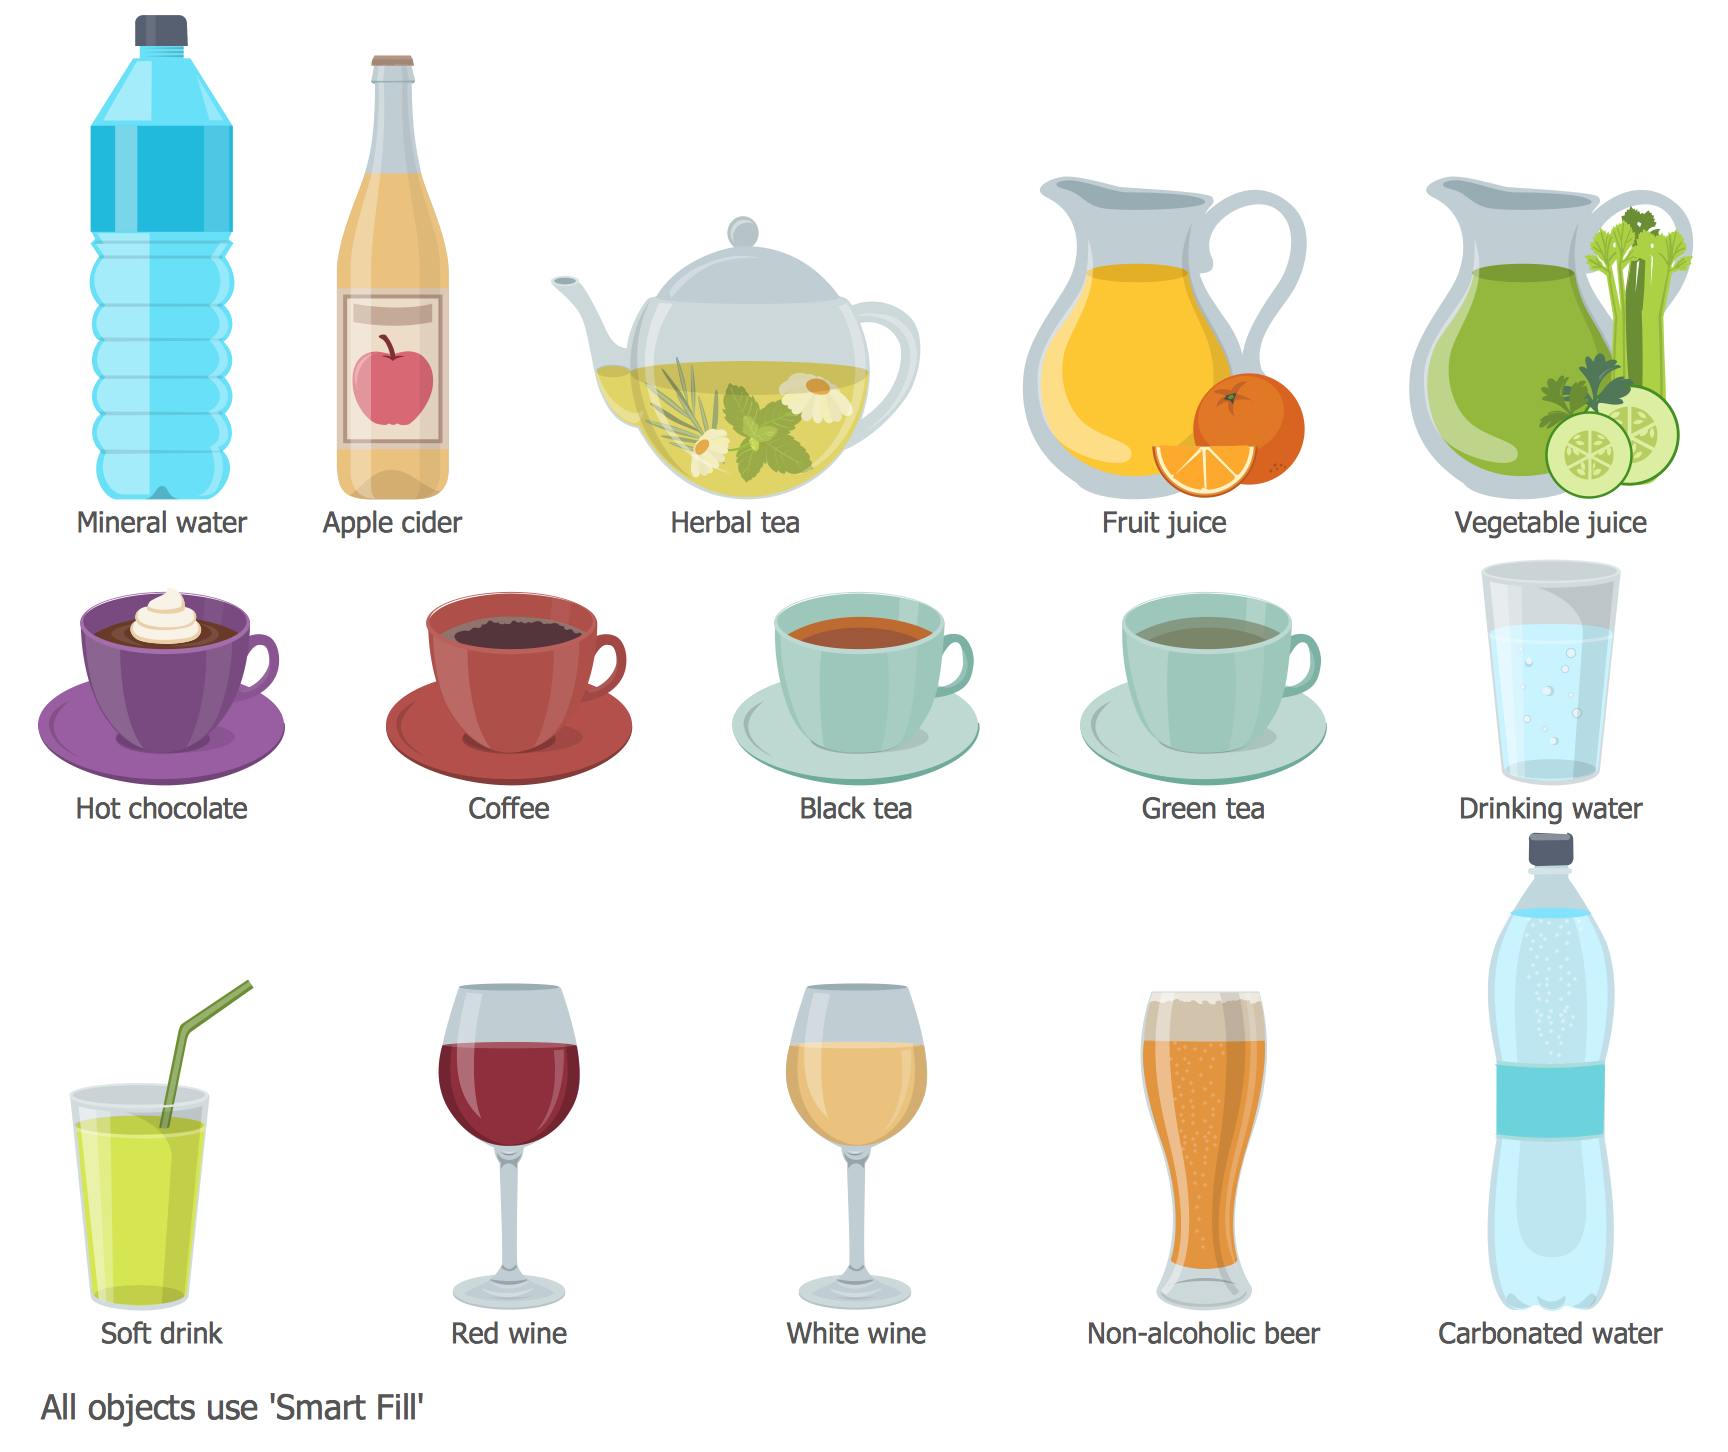
Design Elements — Drinks
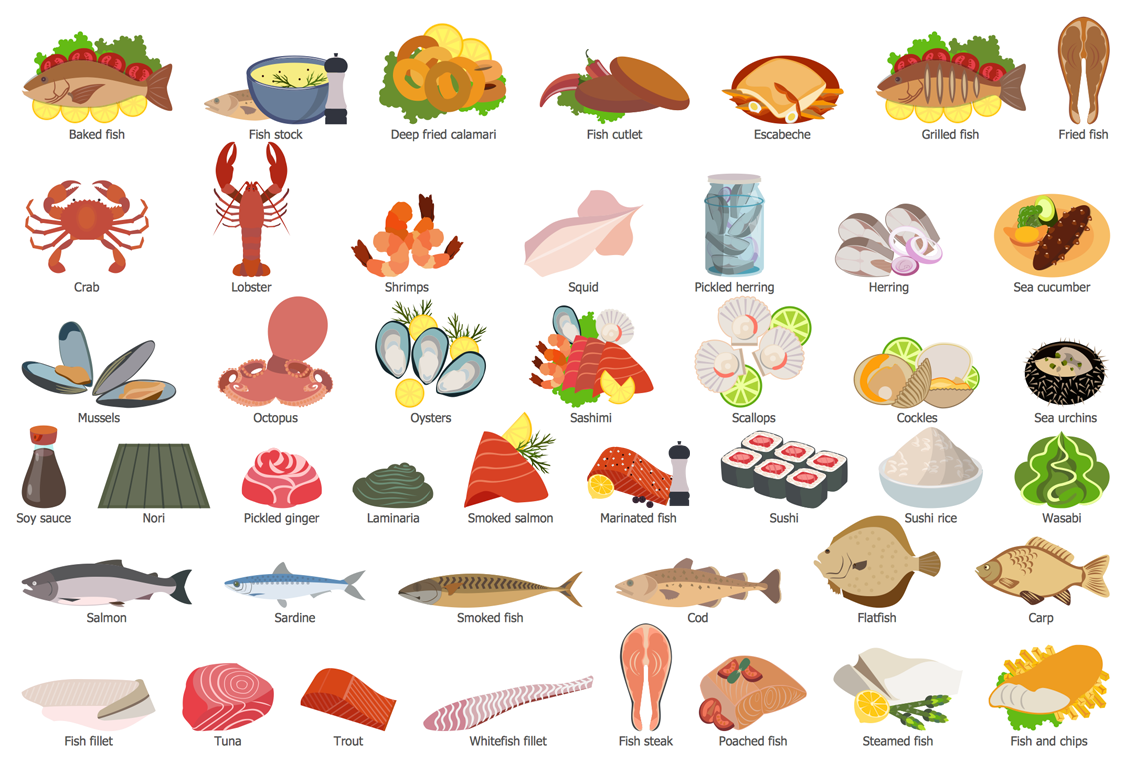
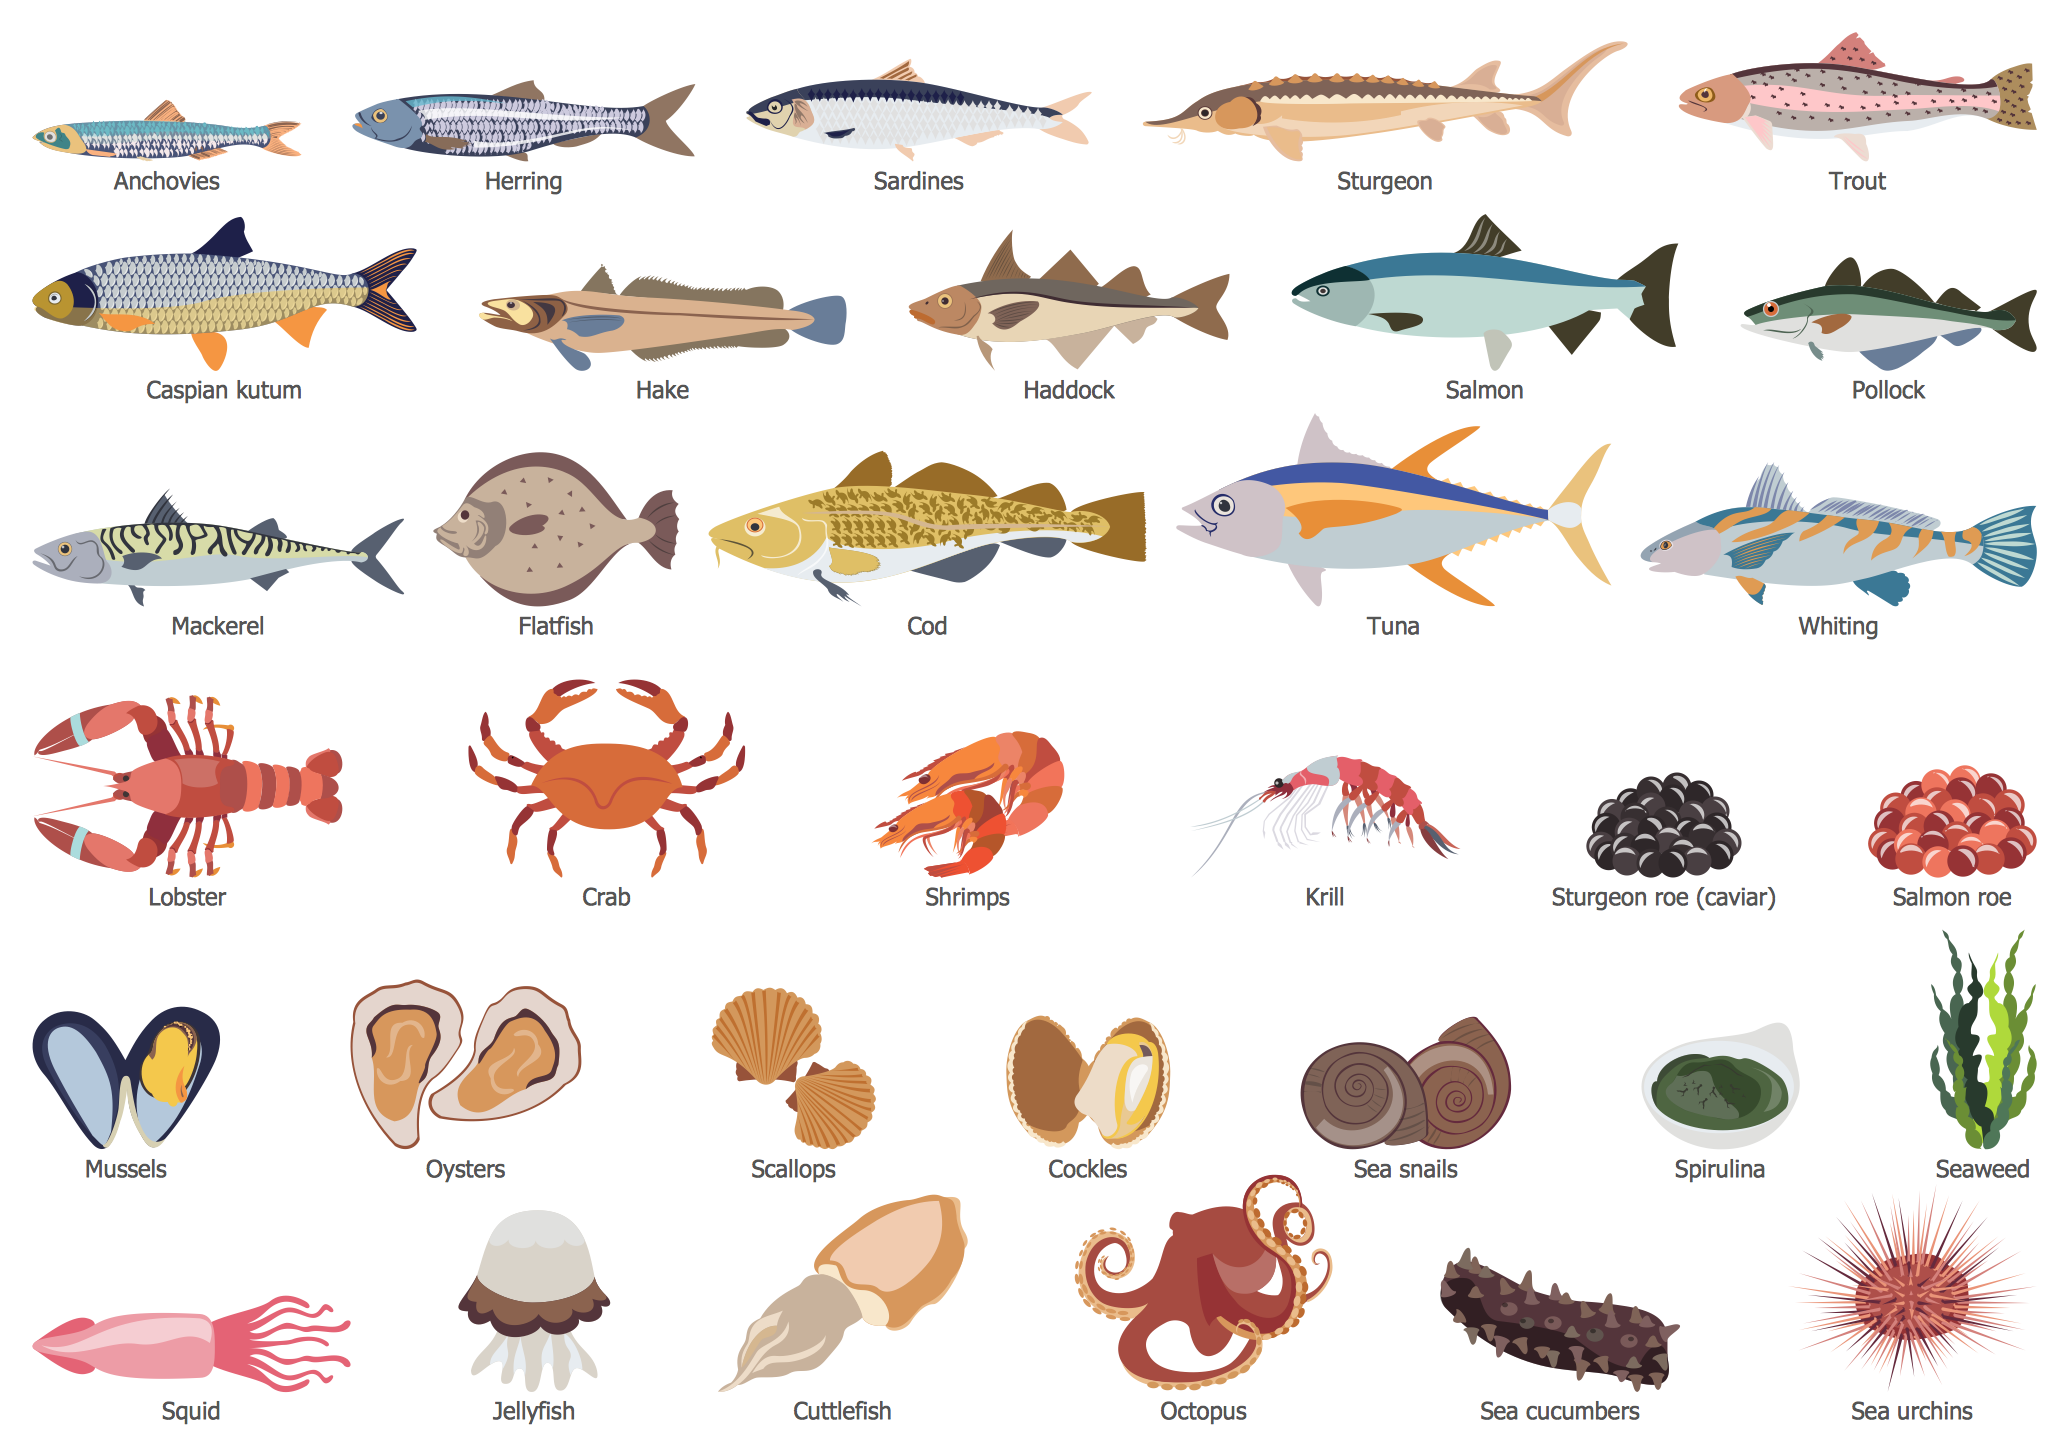
Design Elements — Fish, Seafood, Sushi
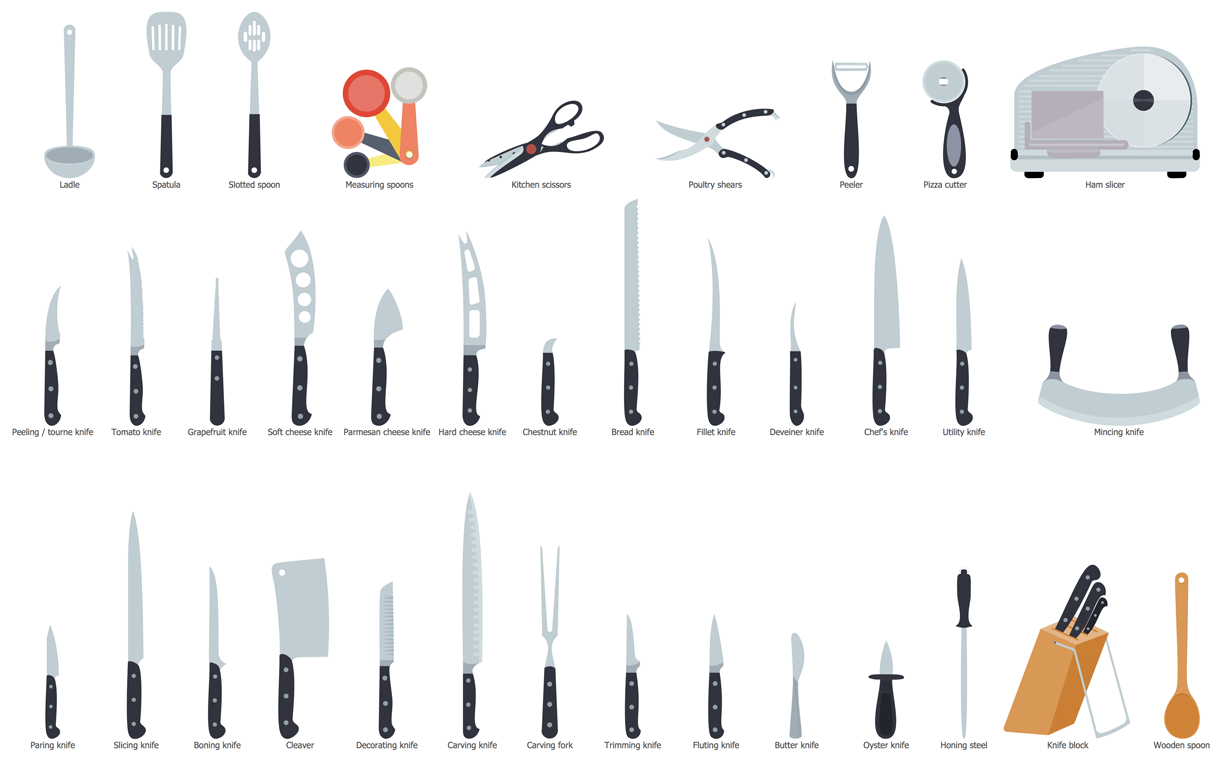
Design Elements — Kitchen Knifes, Spoons and Forks
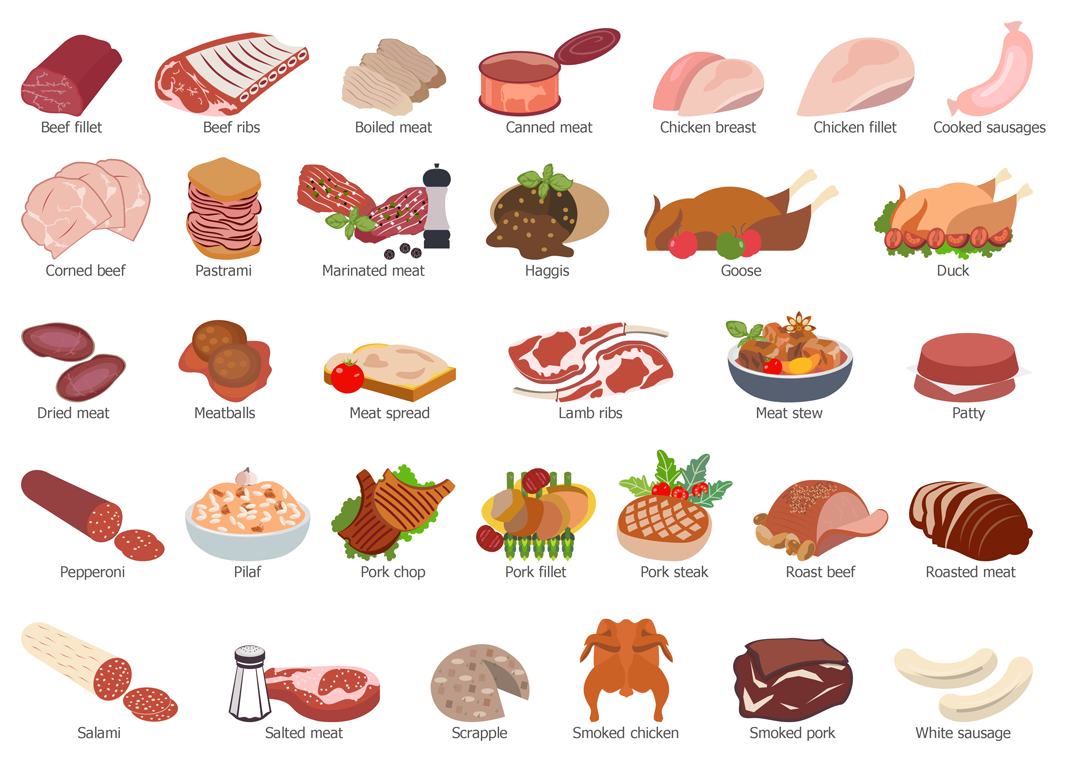

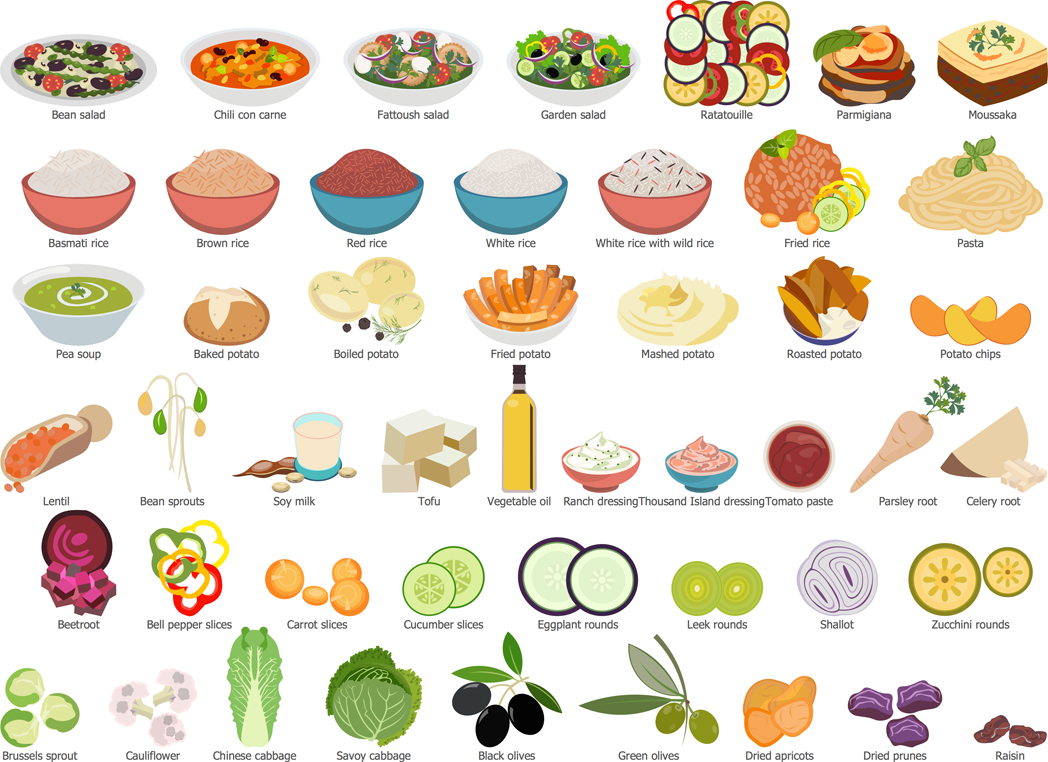
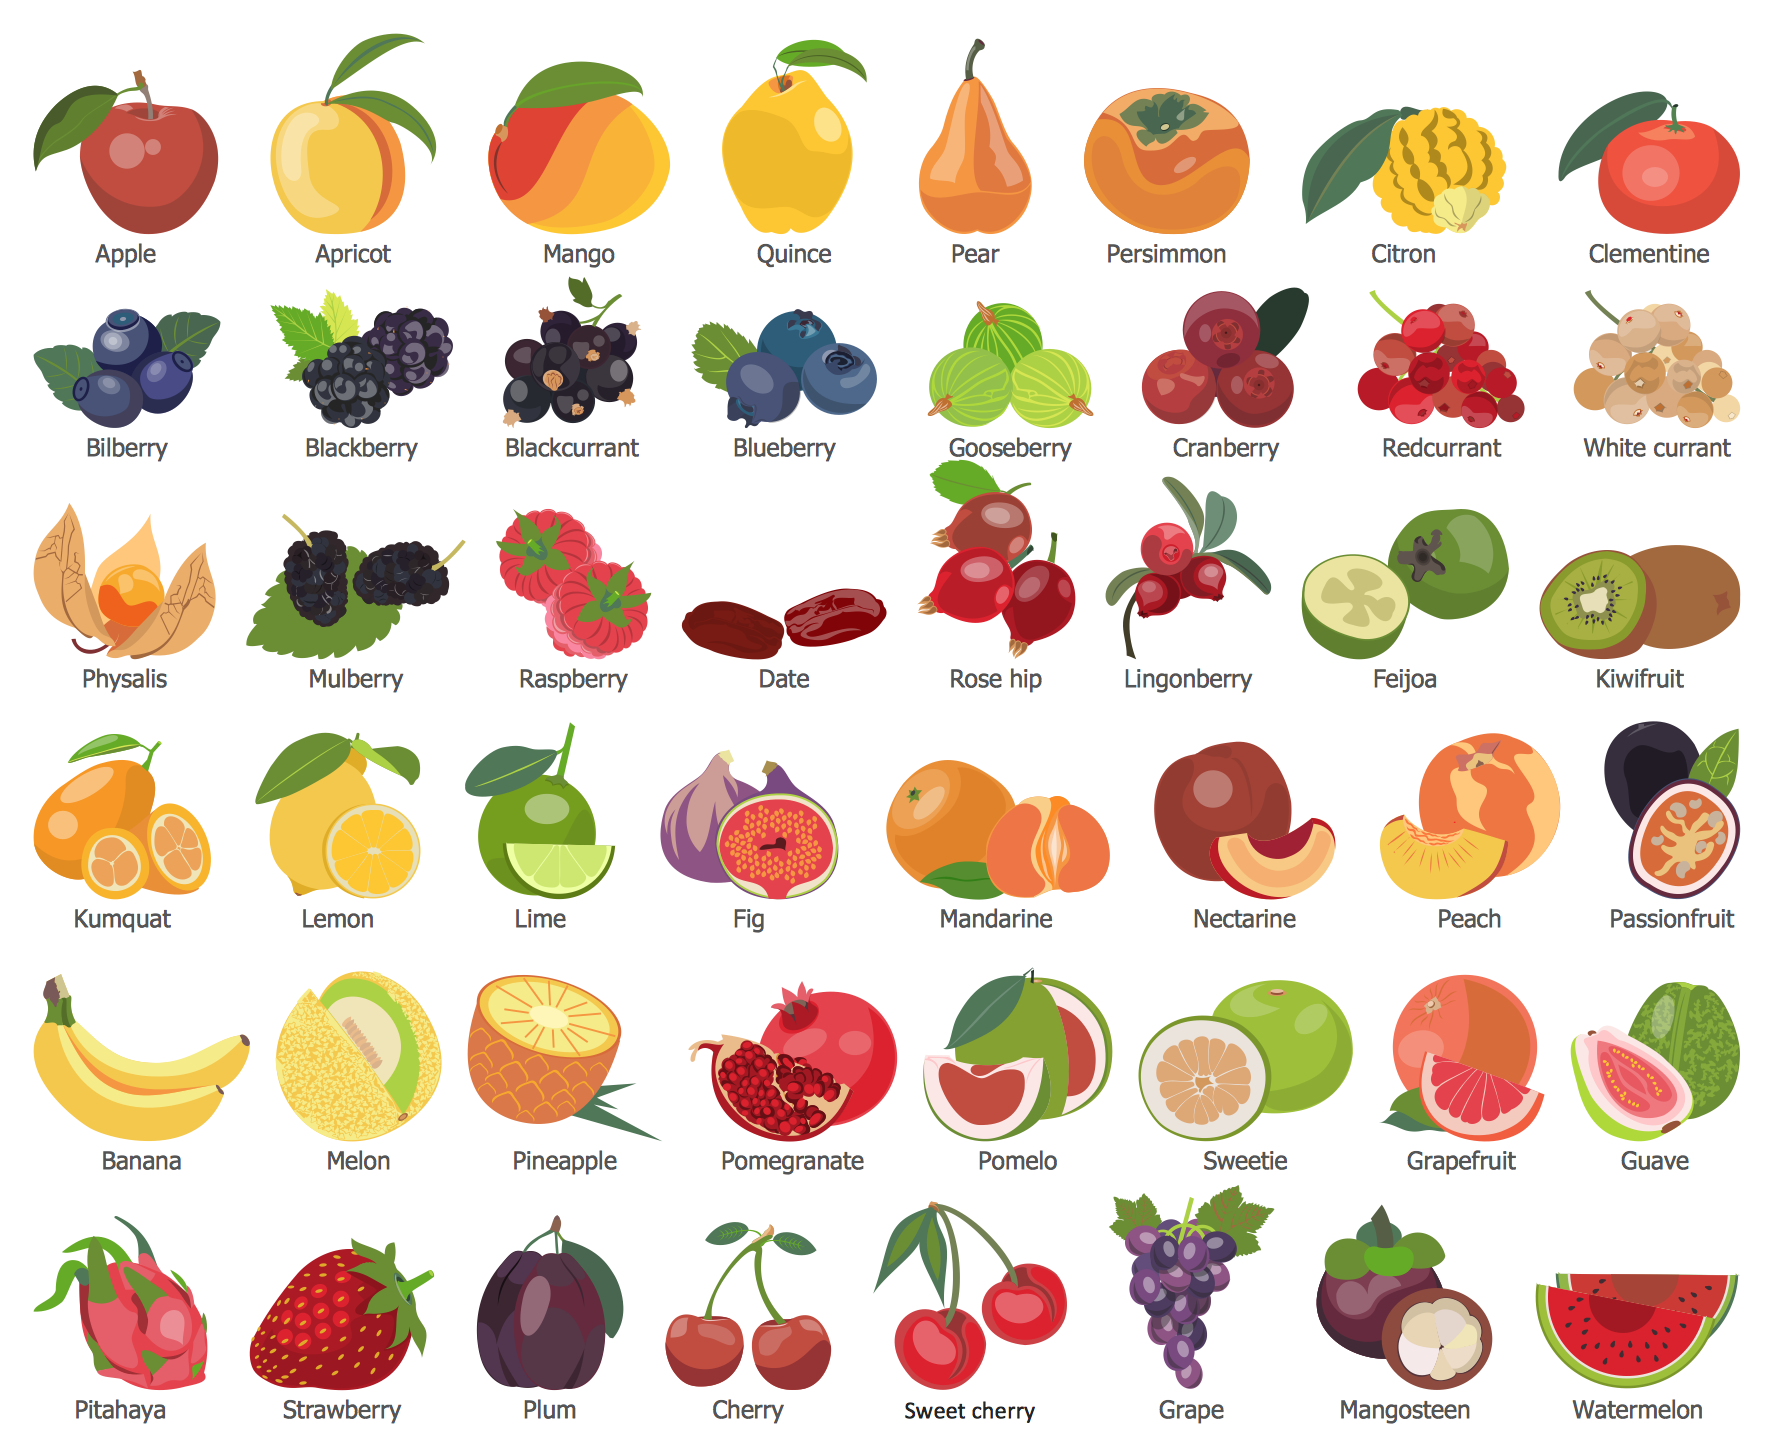
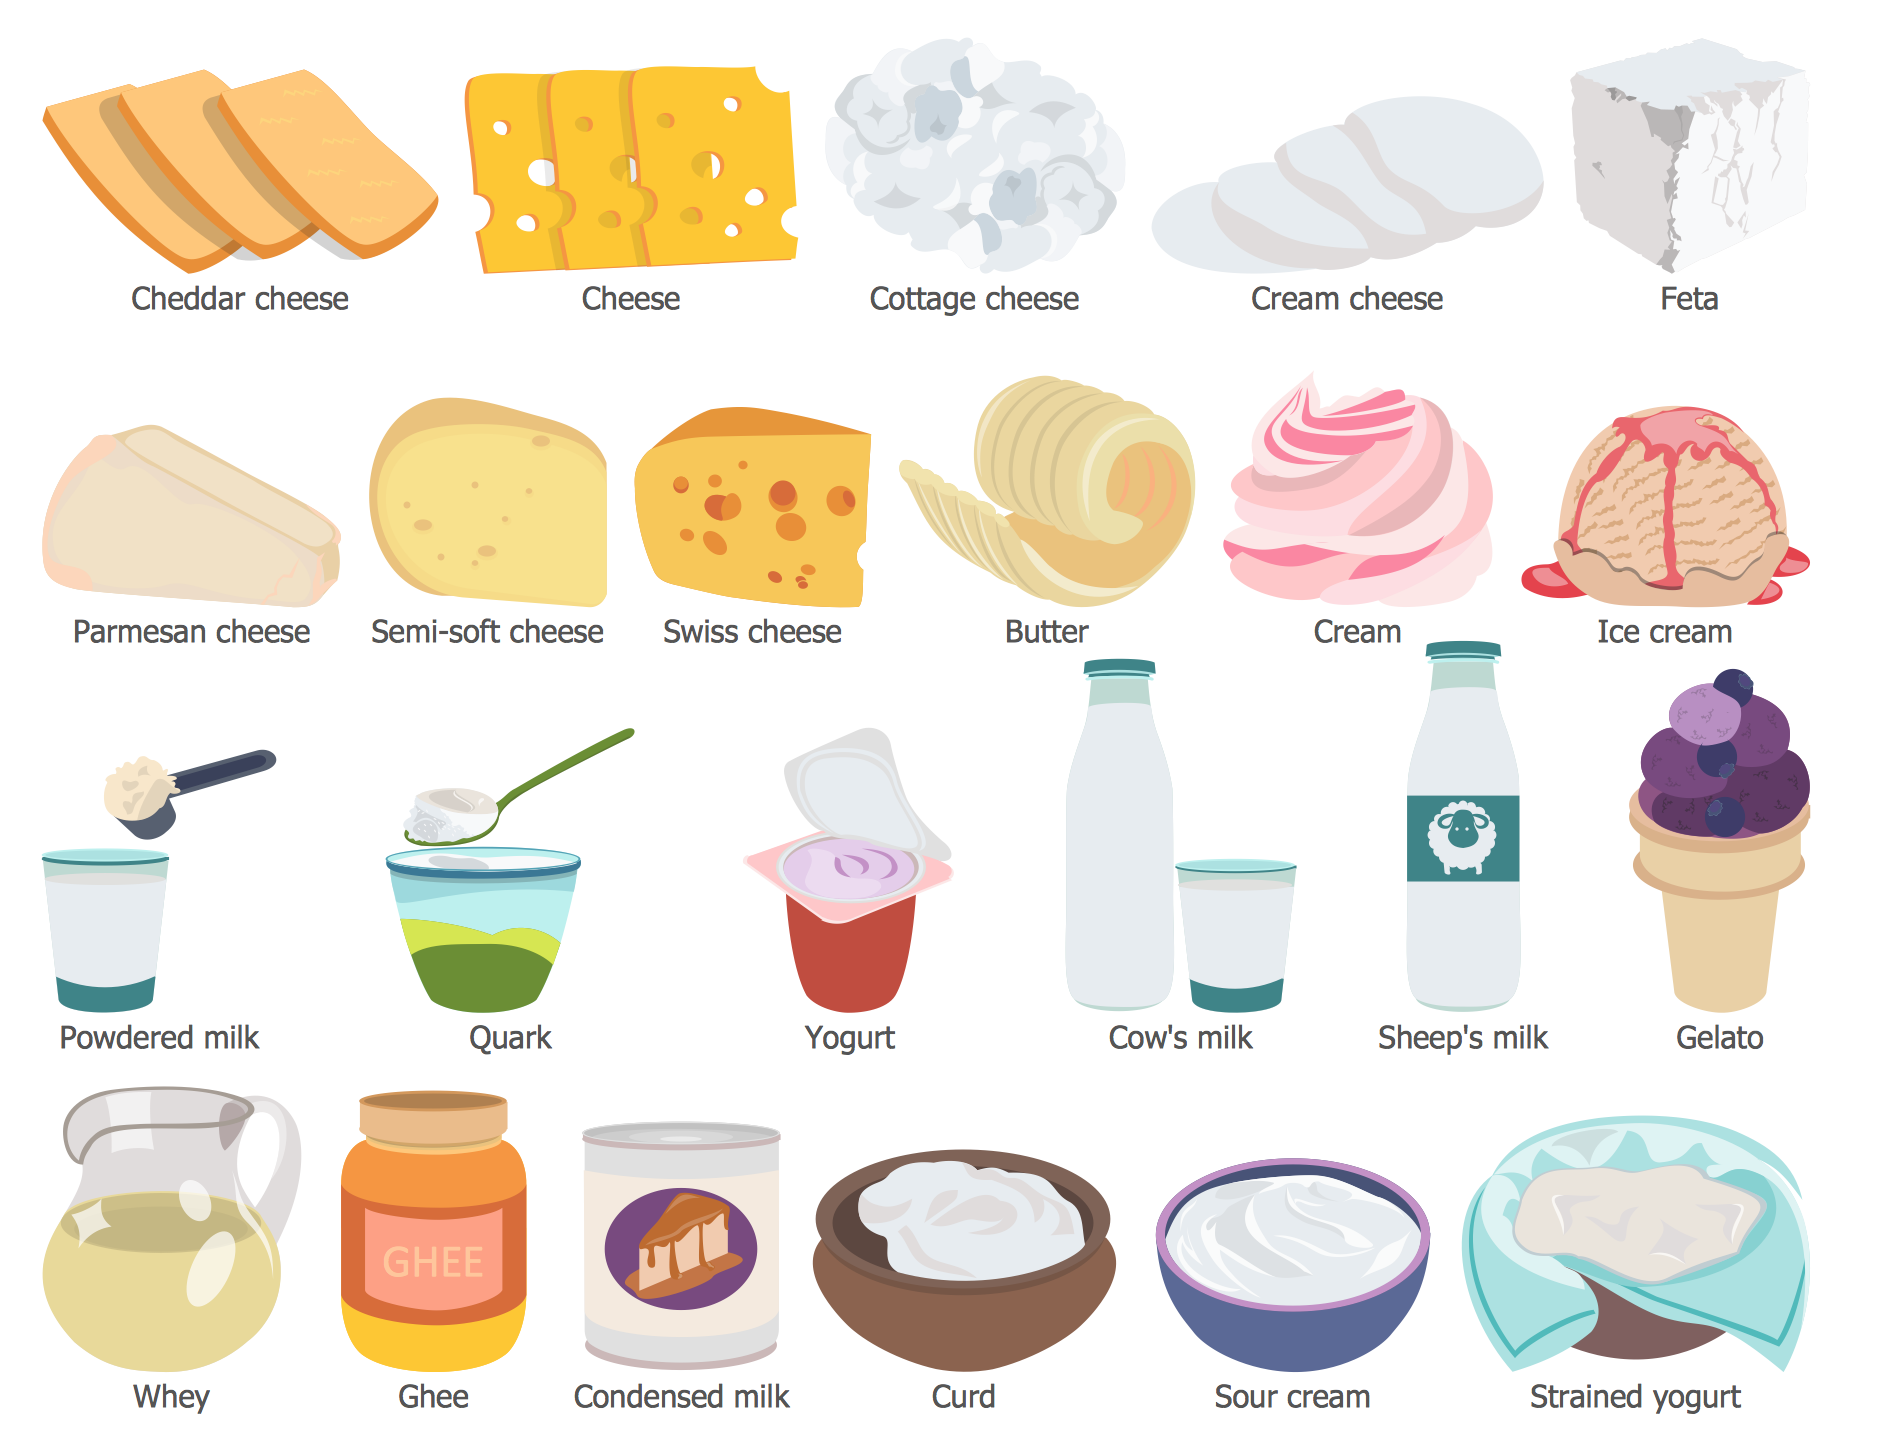
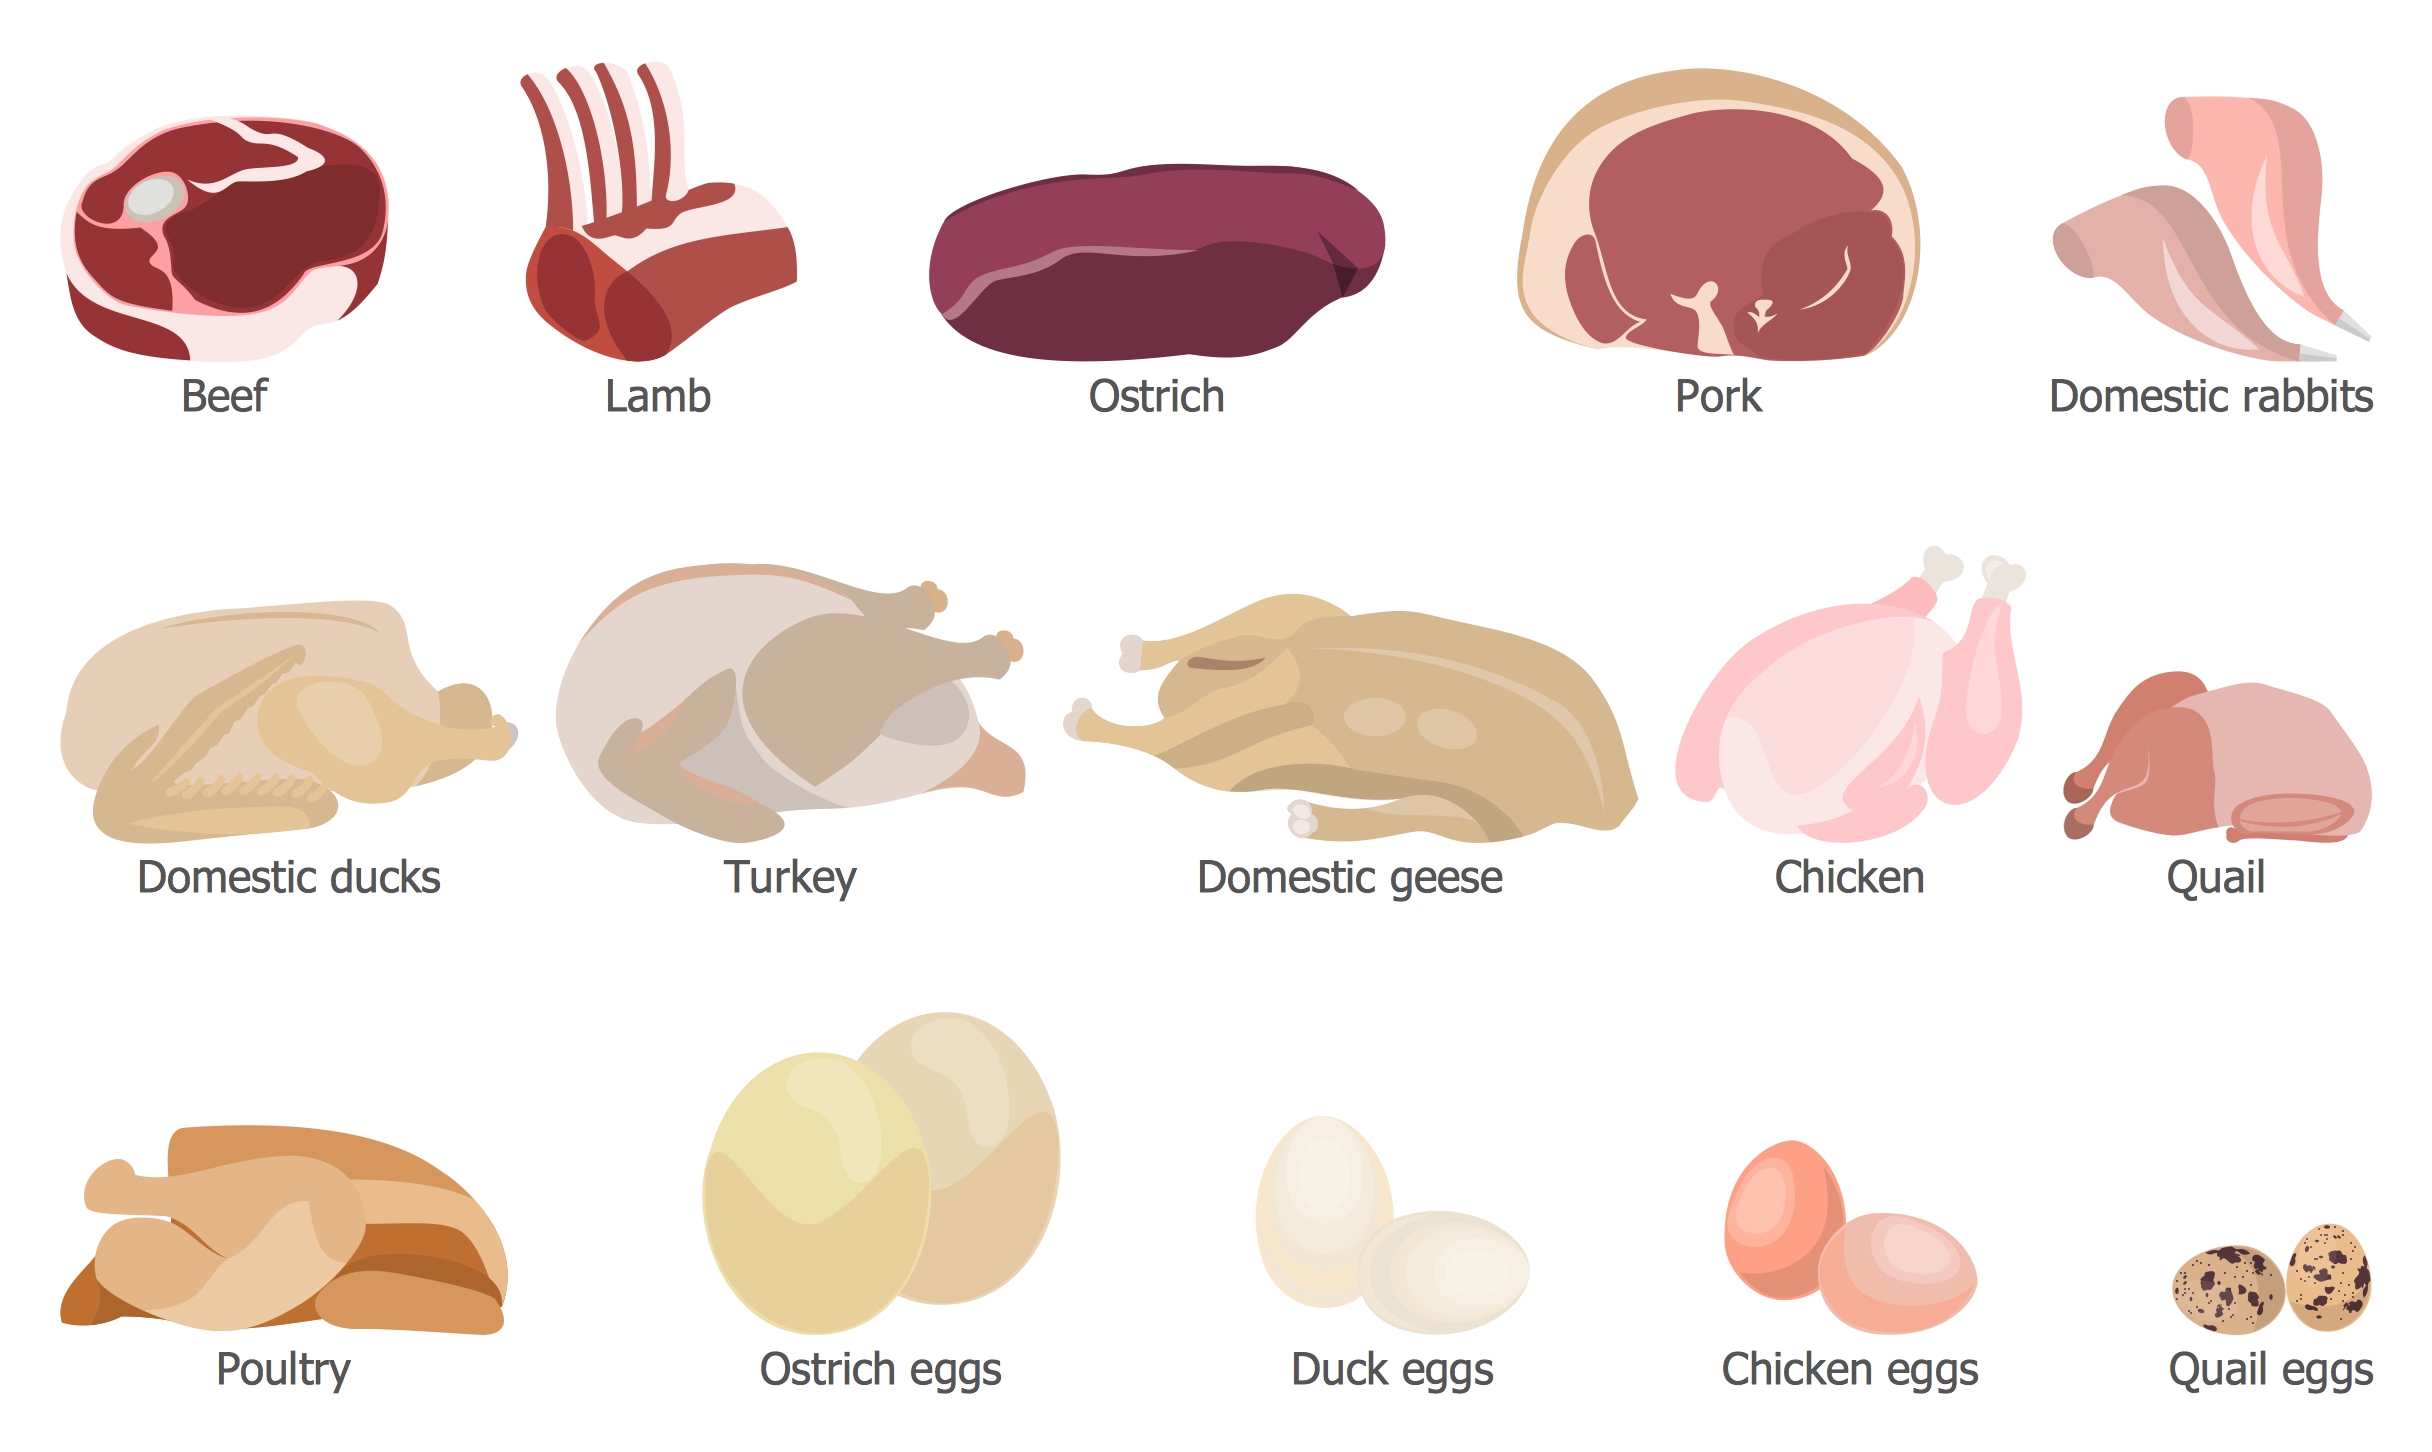
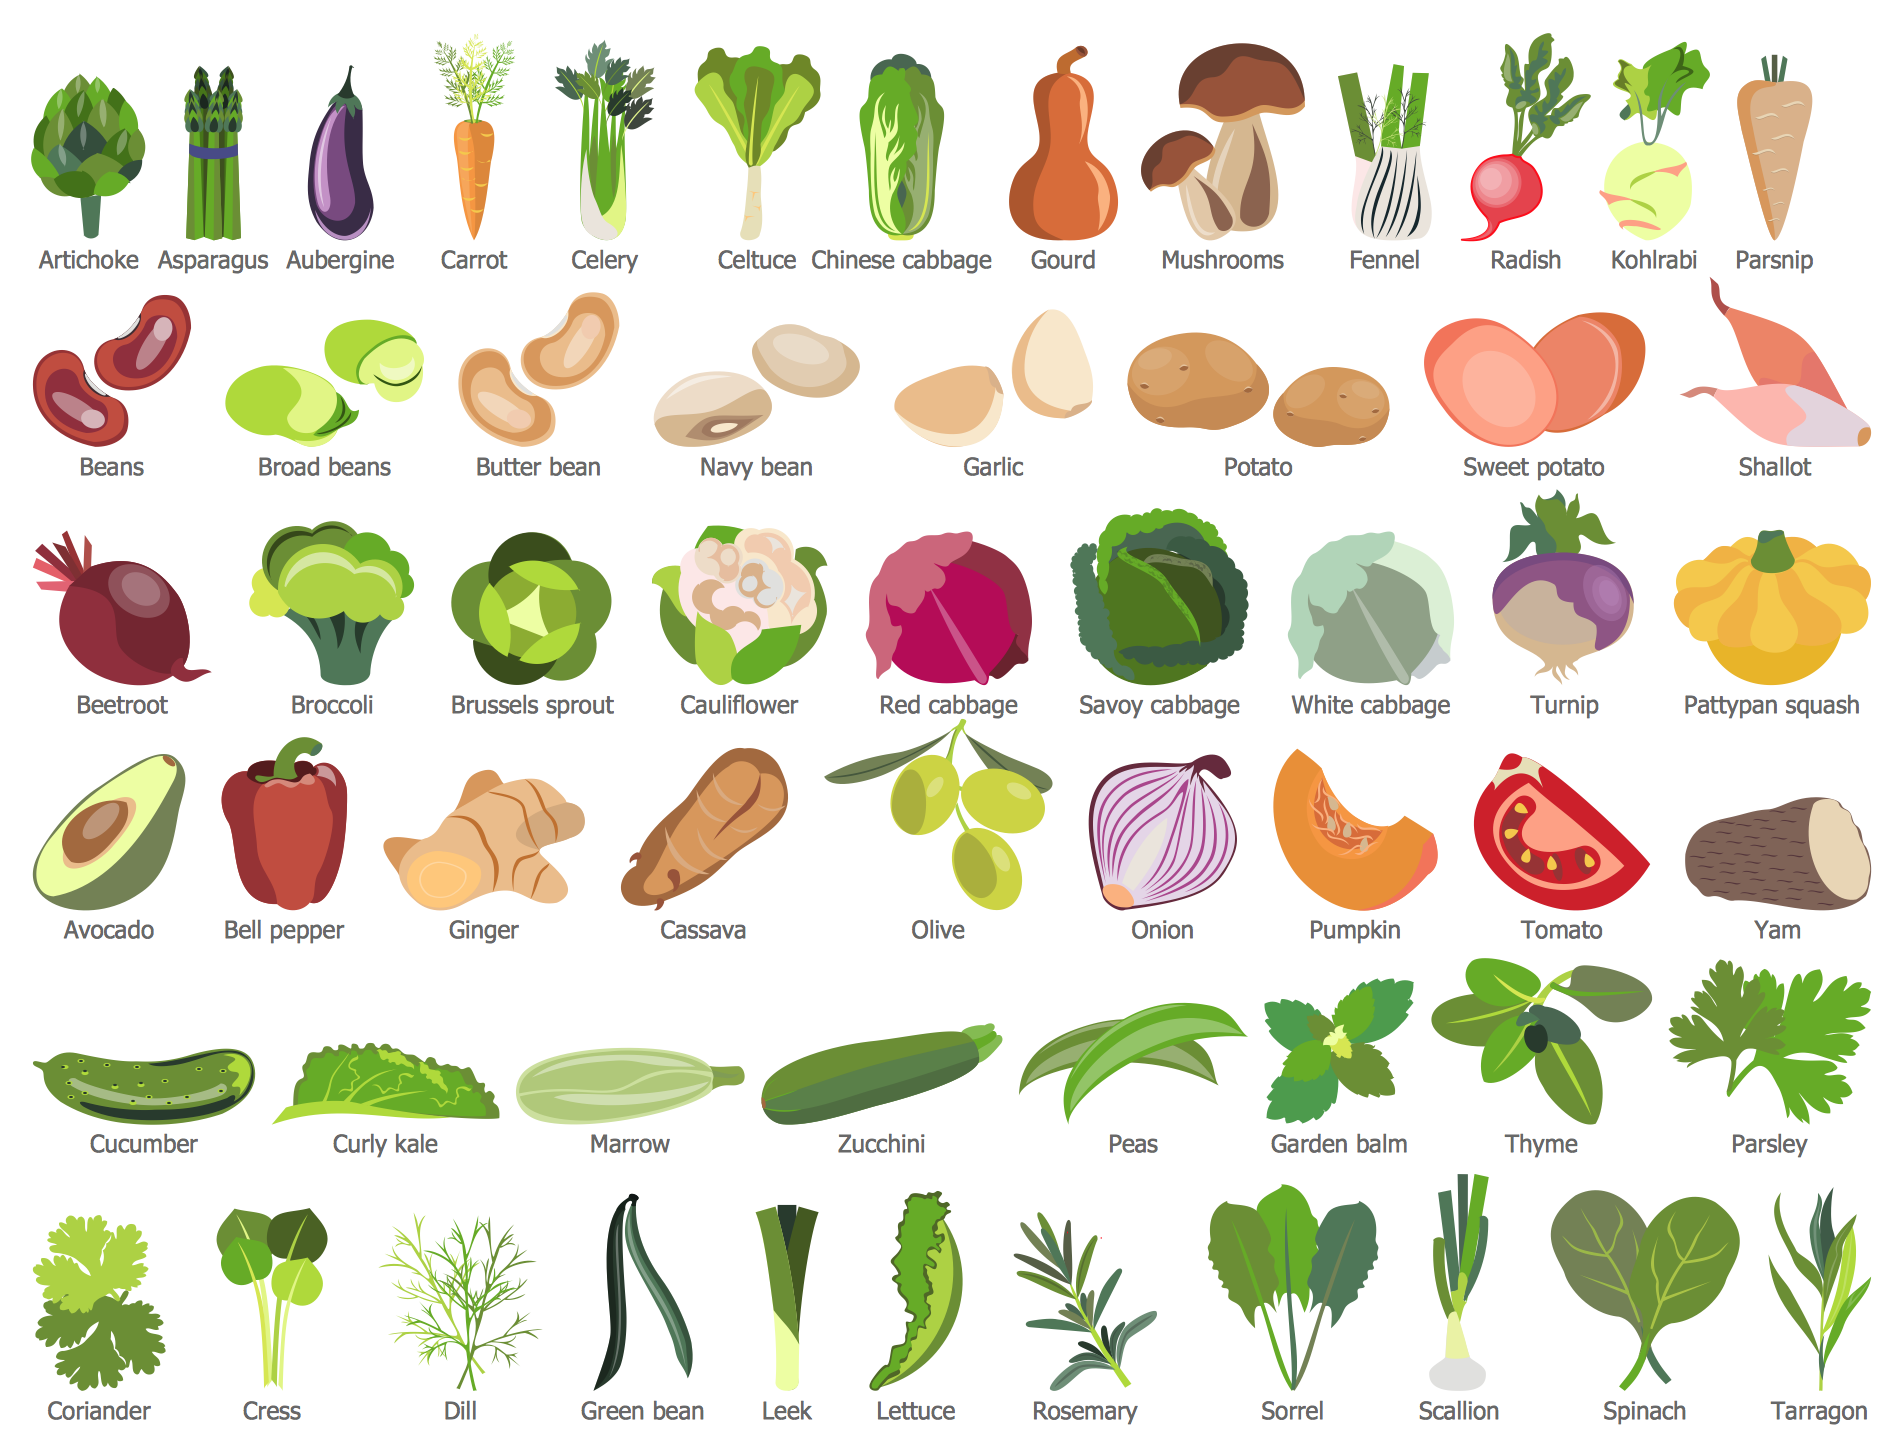
Health Food Solution
Design eye-catching health food illustrations and decorate healthy food recipes with help of predesigned bright and appetizing healthy foods clipart.
There are 8 libraries containing 238 objects and 10 examples in the Health Food solution.

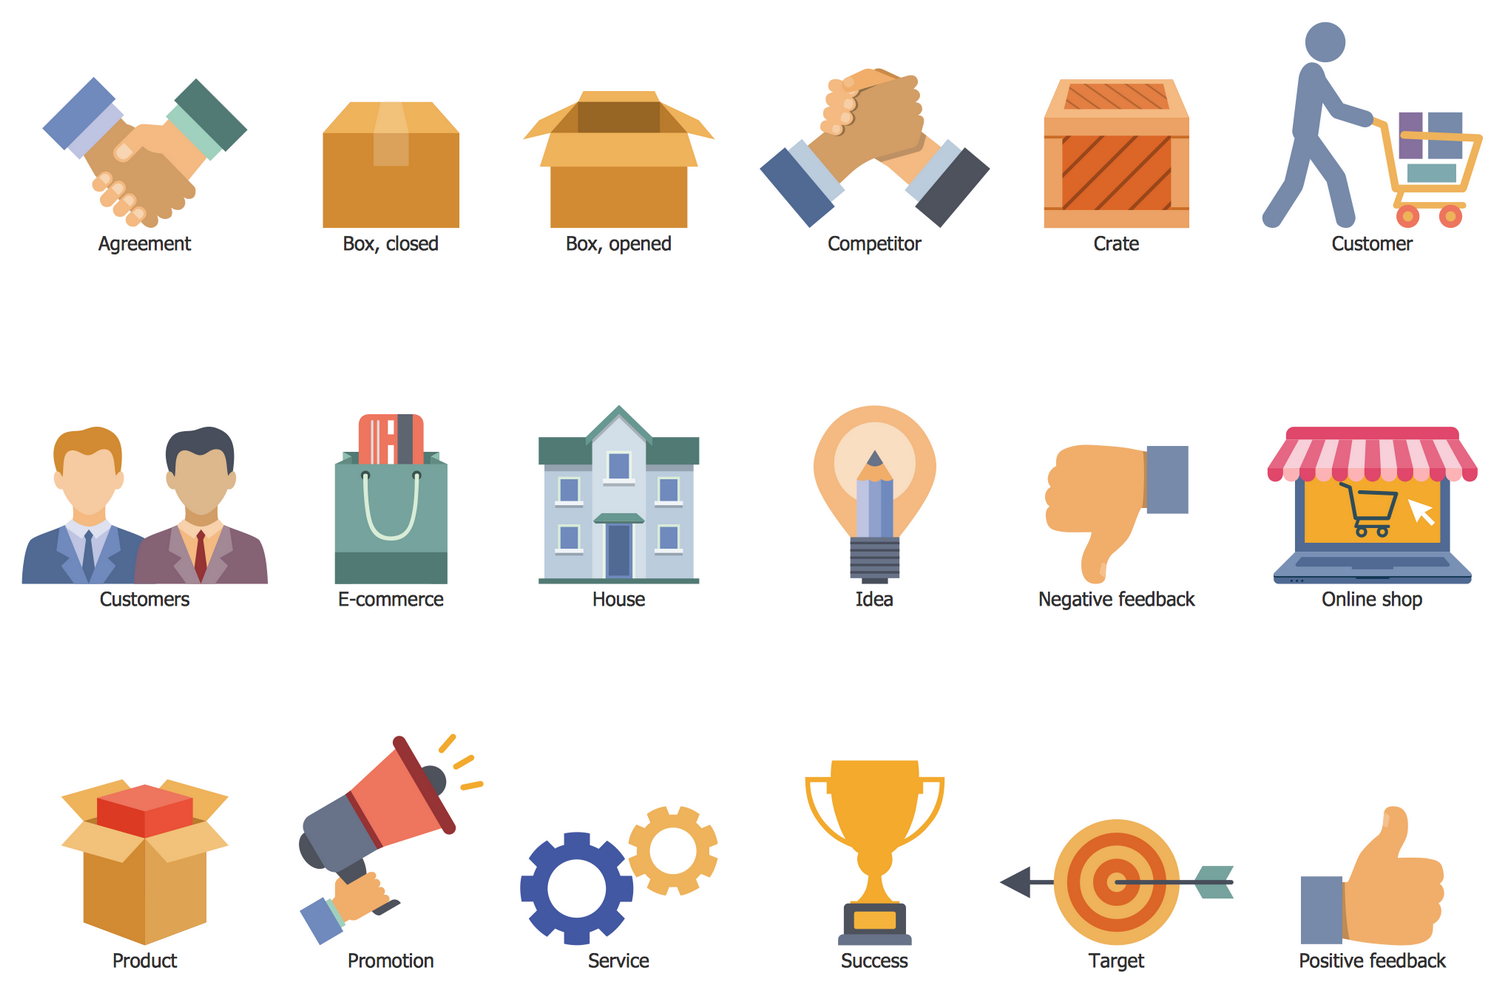
Marketing Infographics Solution
Marketing strategies and results can be displayed in infographic form; data can be shown using various forms of charts and graphs.
There are 14 stencil libraries containing 327 vector objects and 14 examples in the Marketing Infographics solution.
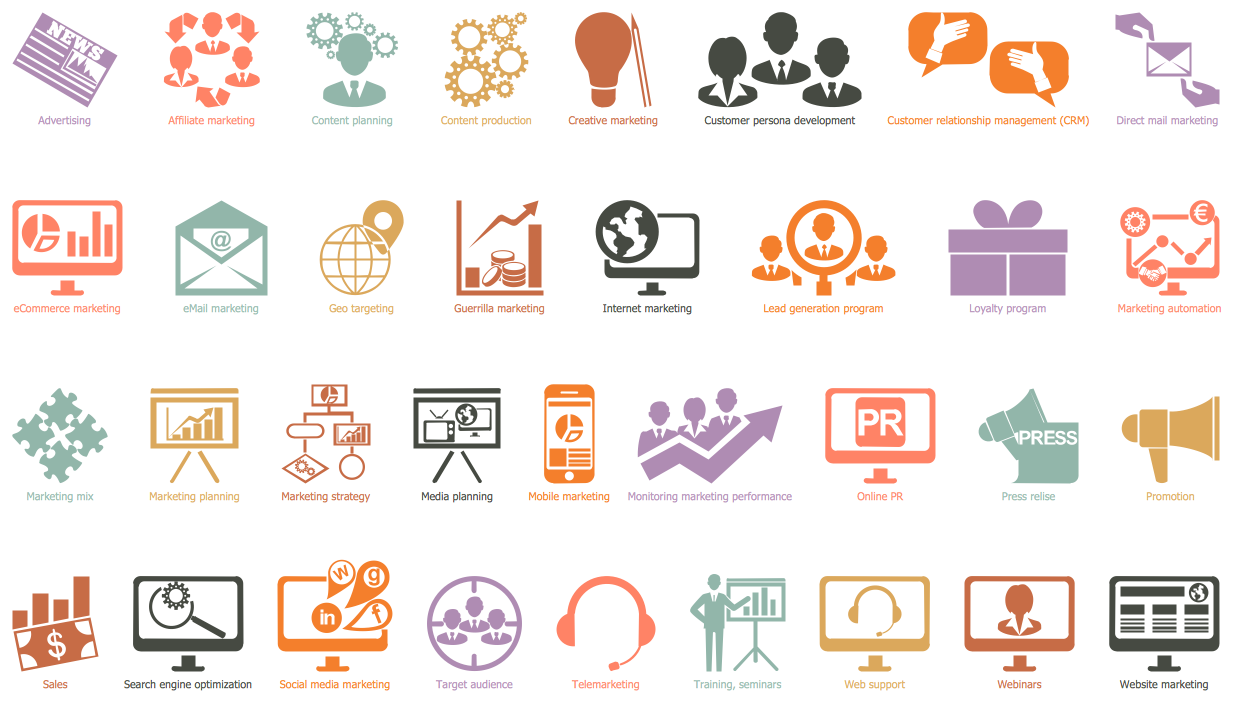
Design Elements — Marketing Pictograms
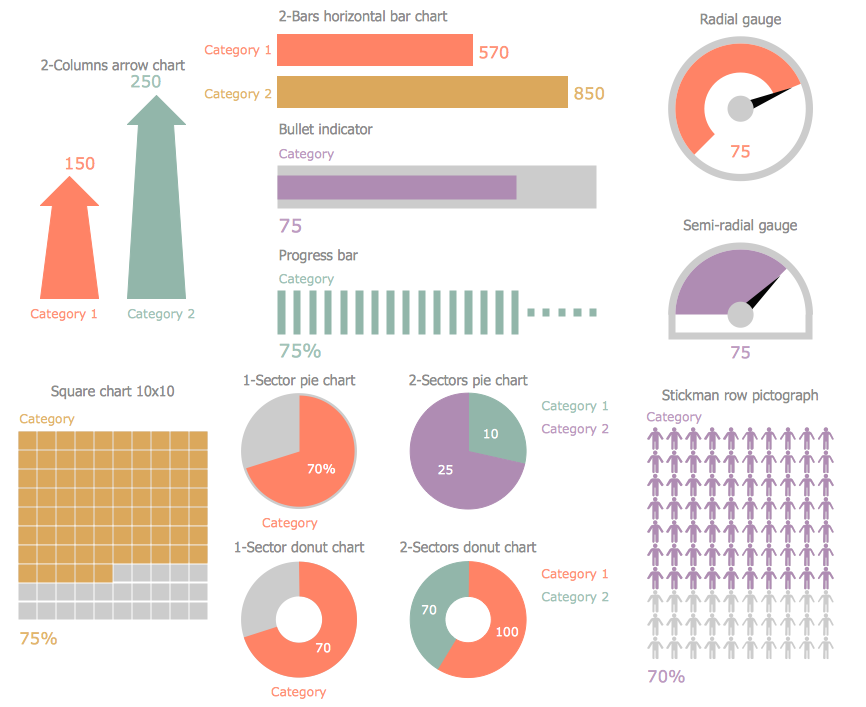
Design Elements — Marketing Indicators
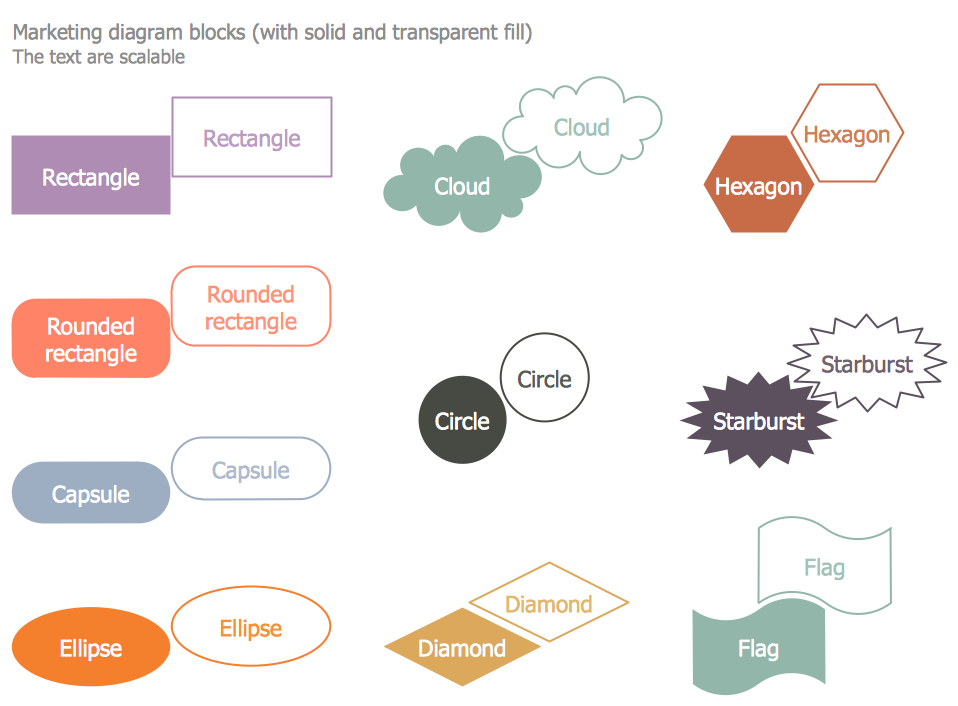
Design Elements — Marketing Diagram
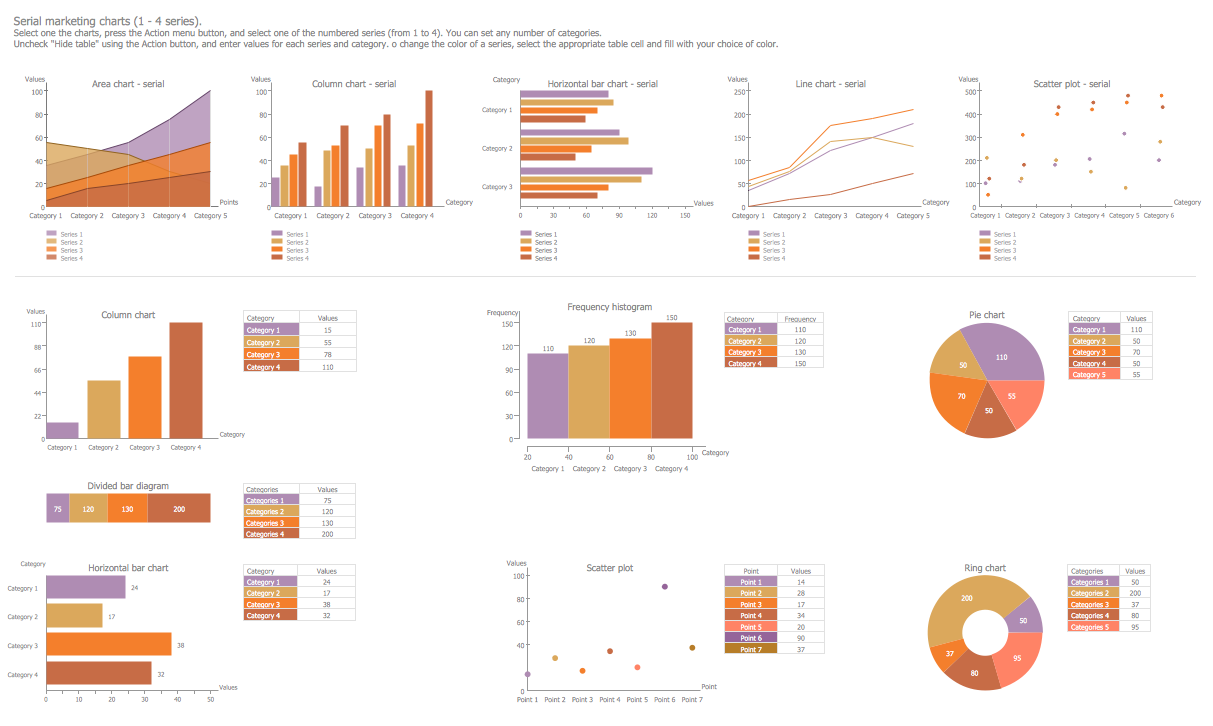
Design Elements — Marketing Charts
Design Elements — Marketing List Blocks

Design Elements — Management Title Blocks
Design Elements — Marketin World Map
Design Elements — Marketing Titled Callouts
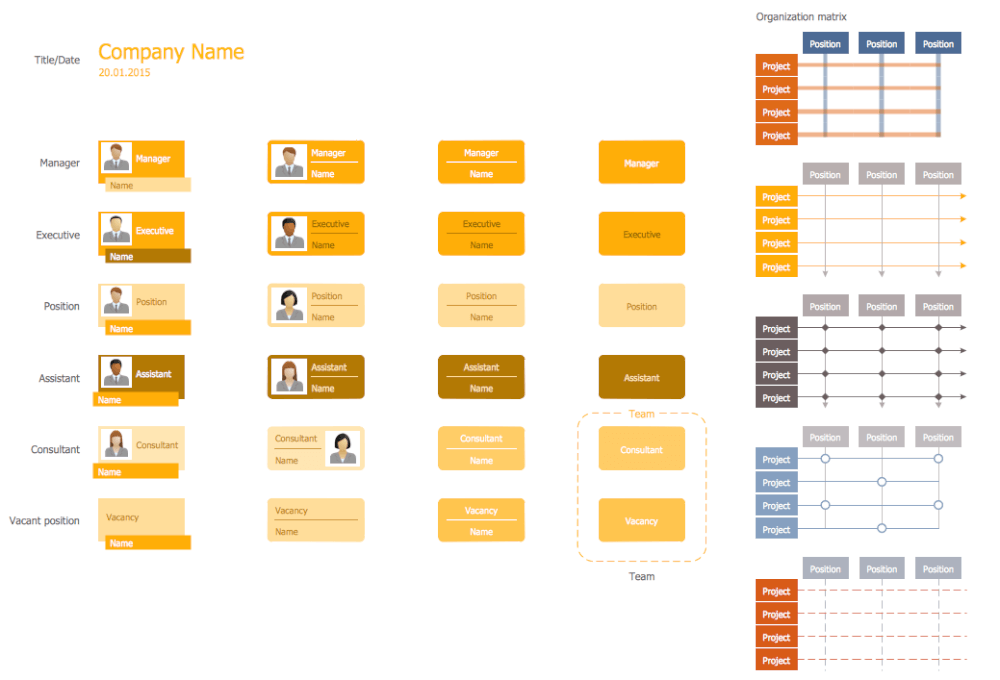
25 Typical Orgcharts Solution
Whatever the size, scope or structure of your business, the 25 Typical Orgcharts solution gives you the tools to professionally chart an organization's hierarchy. 25 distinct templates means you won't be lacking for inspiration.
This solution contains 25 templates and 2 libraries containing 40 vector graphics and icons, to allow you to create professional looking documents.
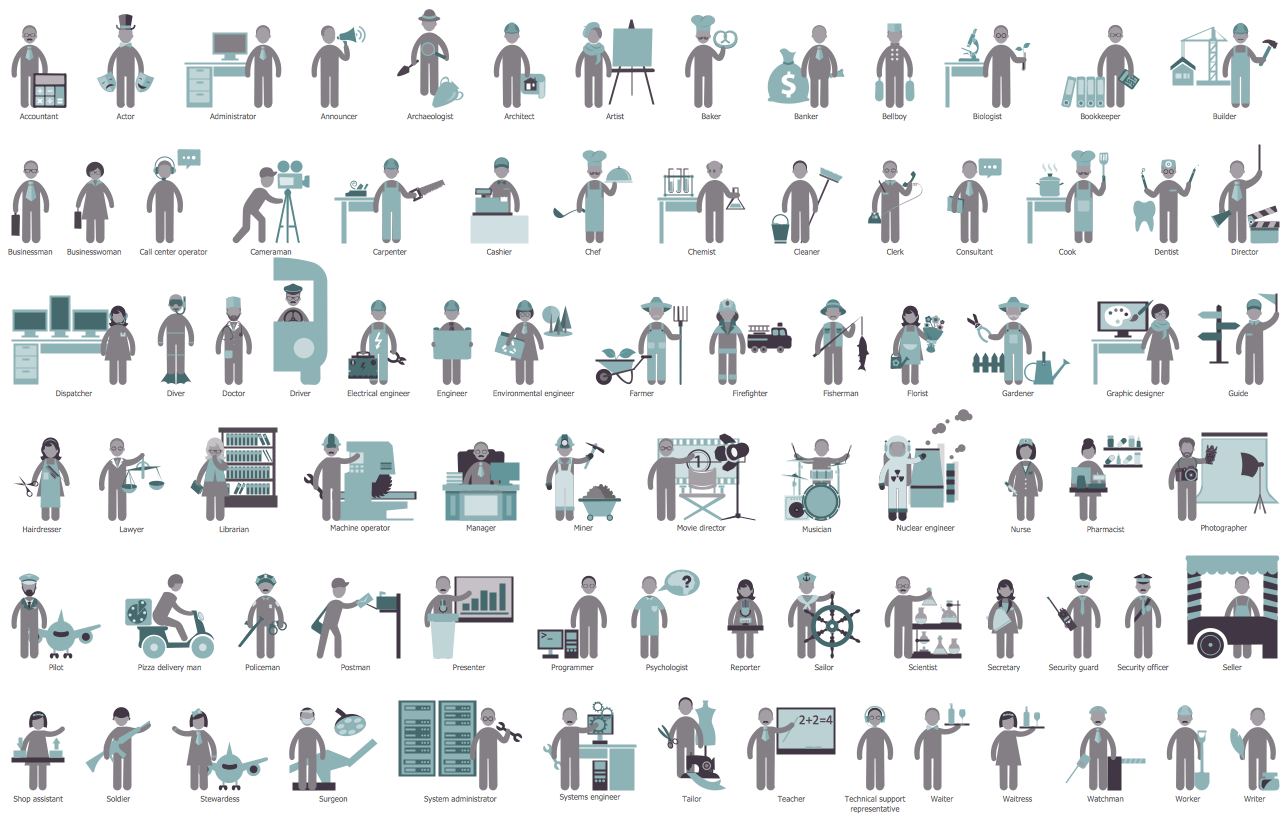
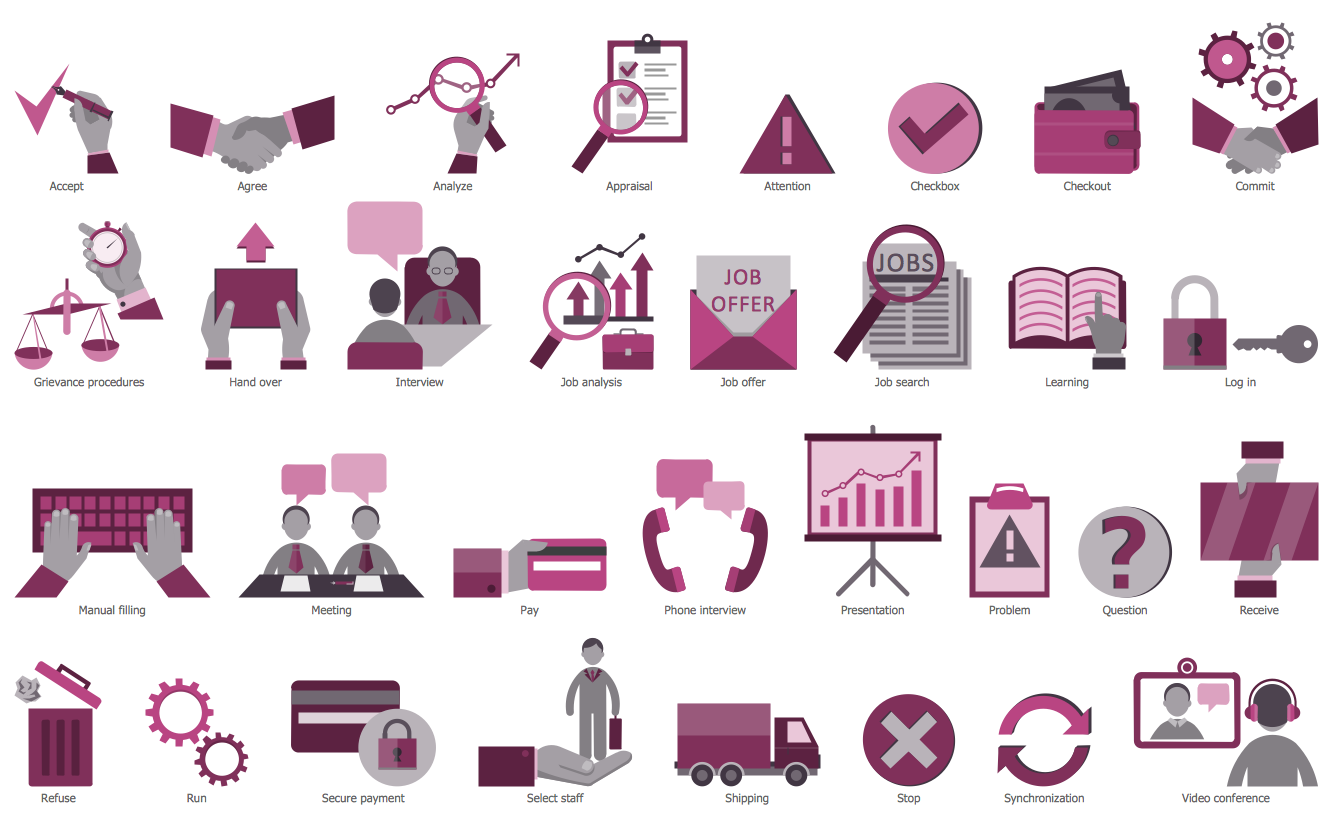
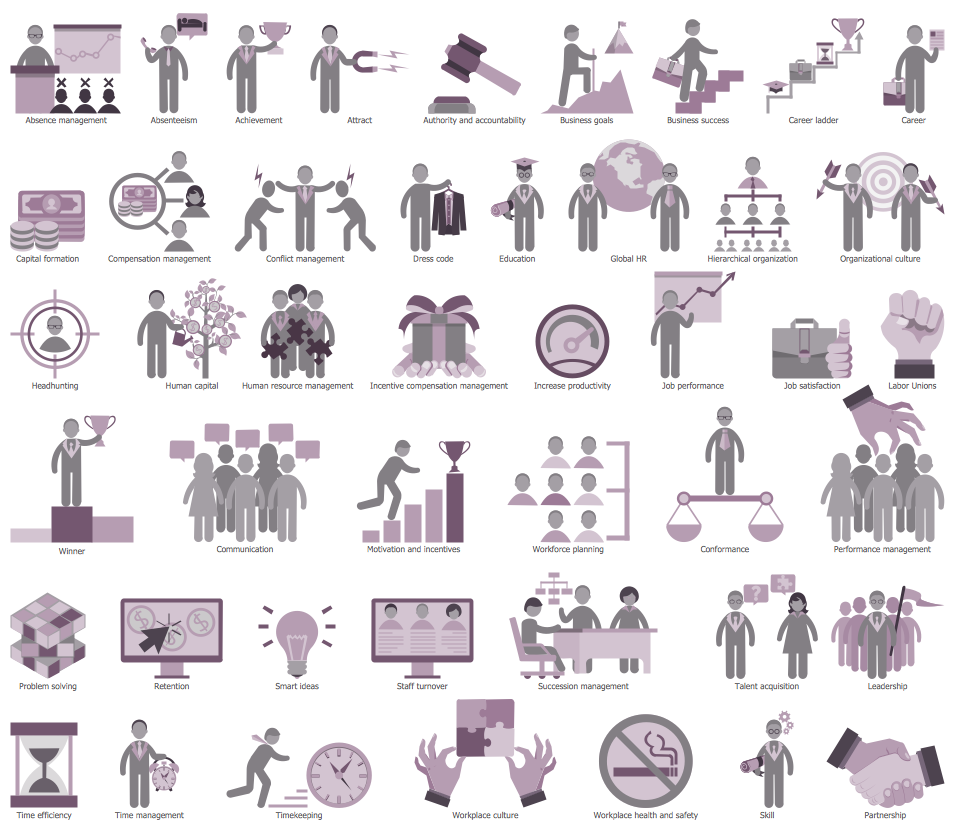
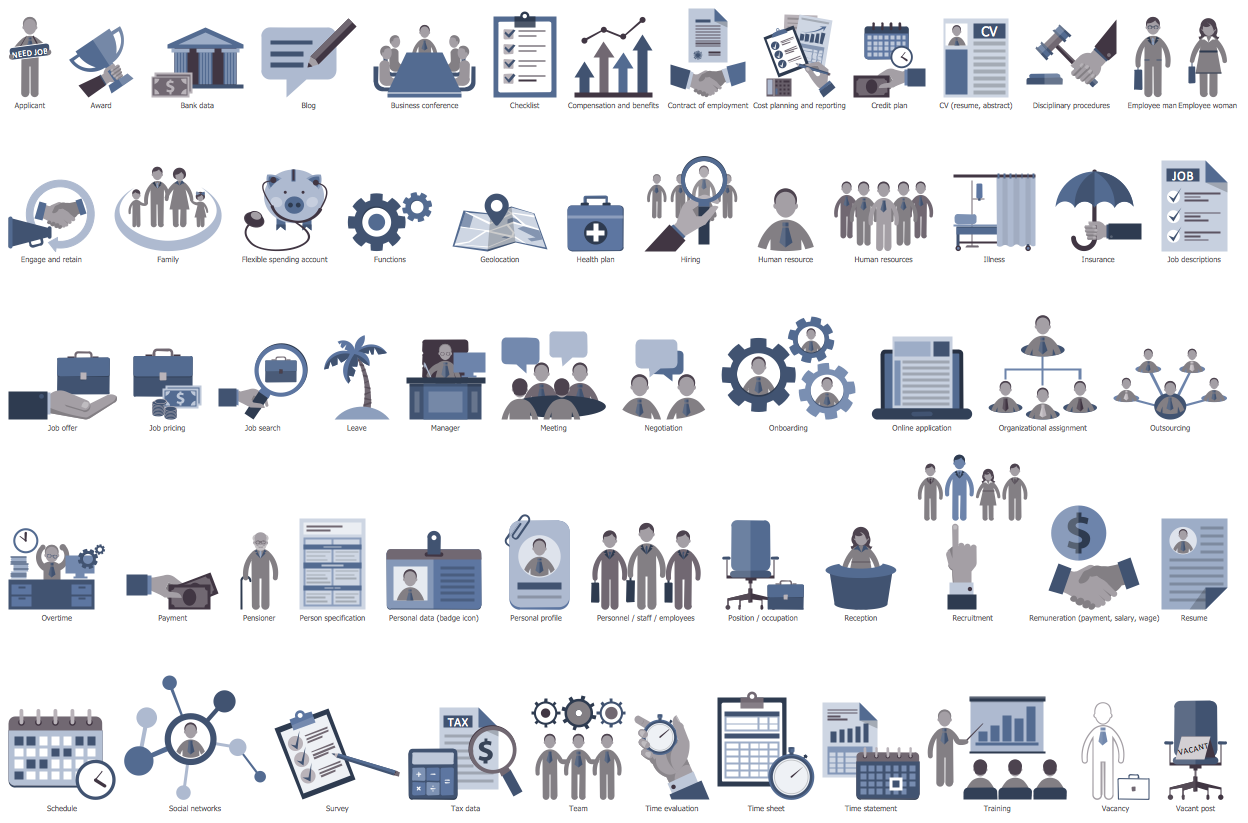
HR Flowcharts Solution
The HR Flowcharts solution is an incredibly powerful tool for those who need to analyze or present human resource process flows in a visually effective manner.
There are 7 libraries containing 387 objects and 10 examples in the HR Flowcharts solution.
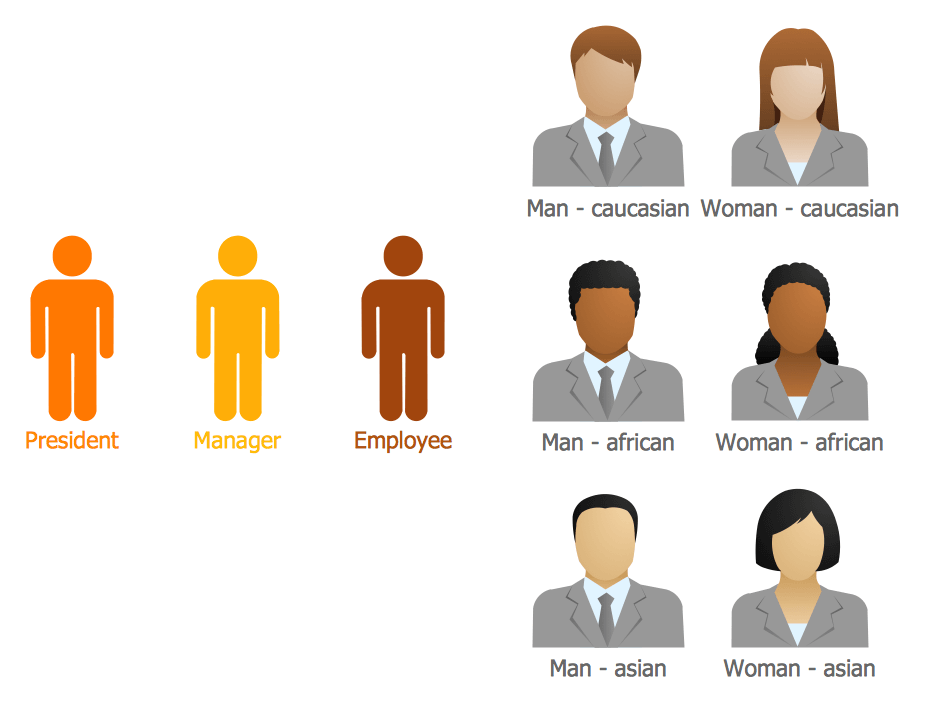
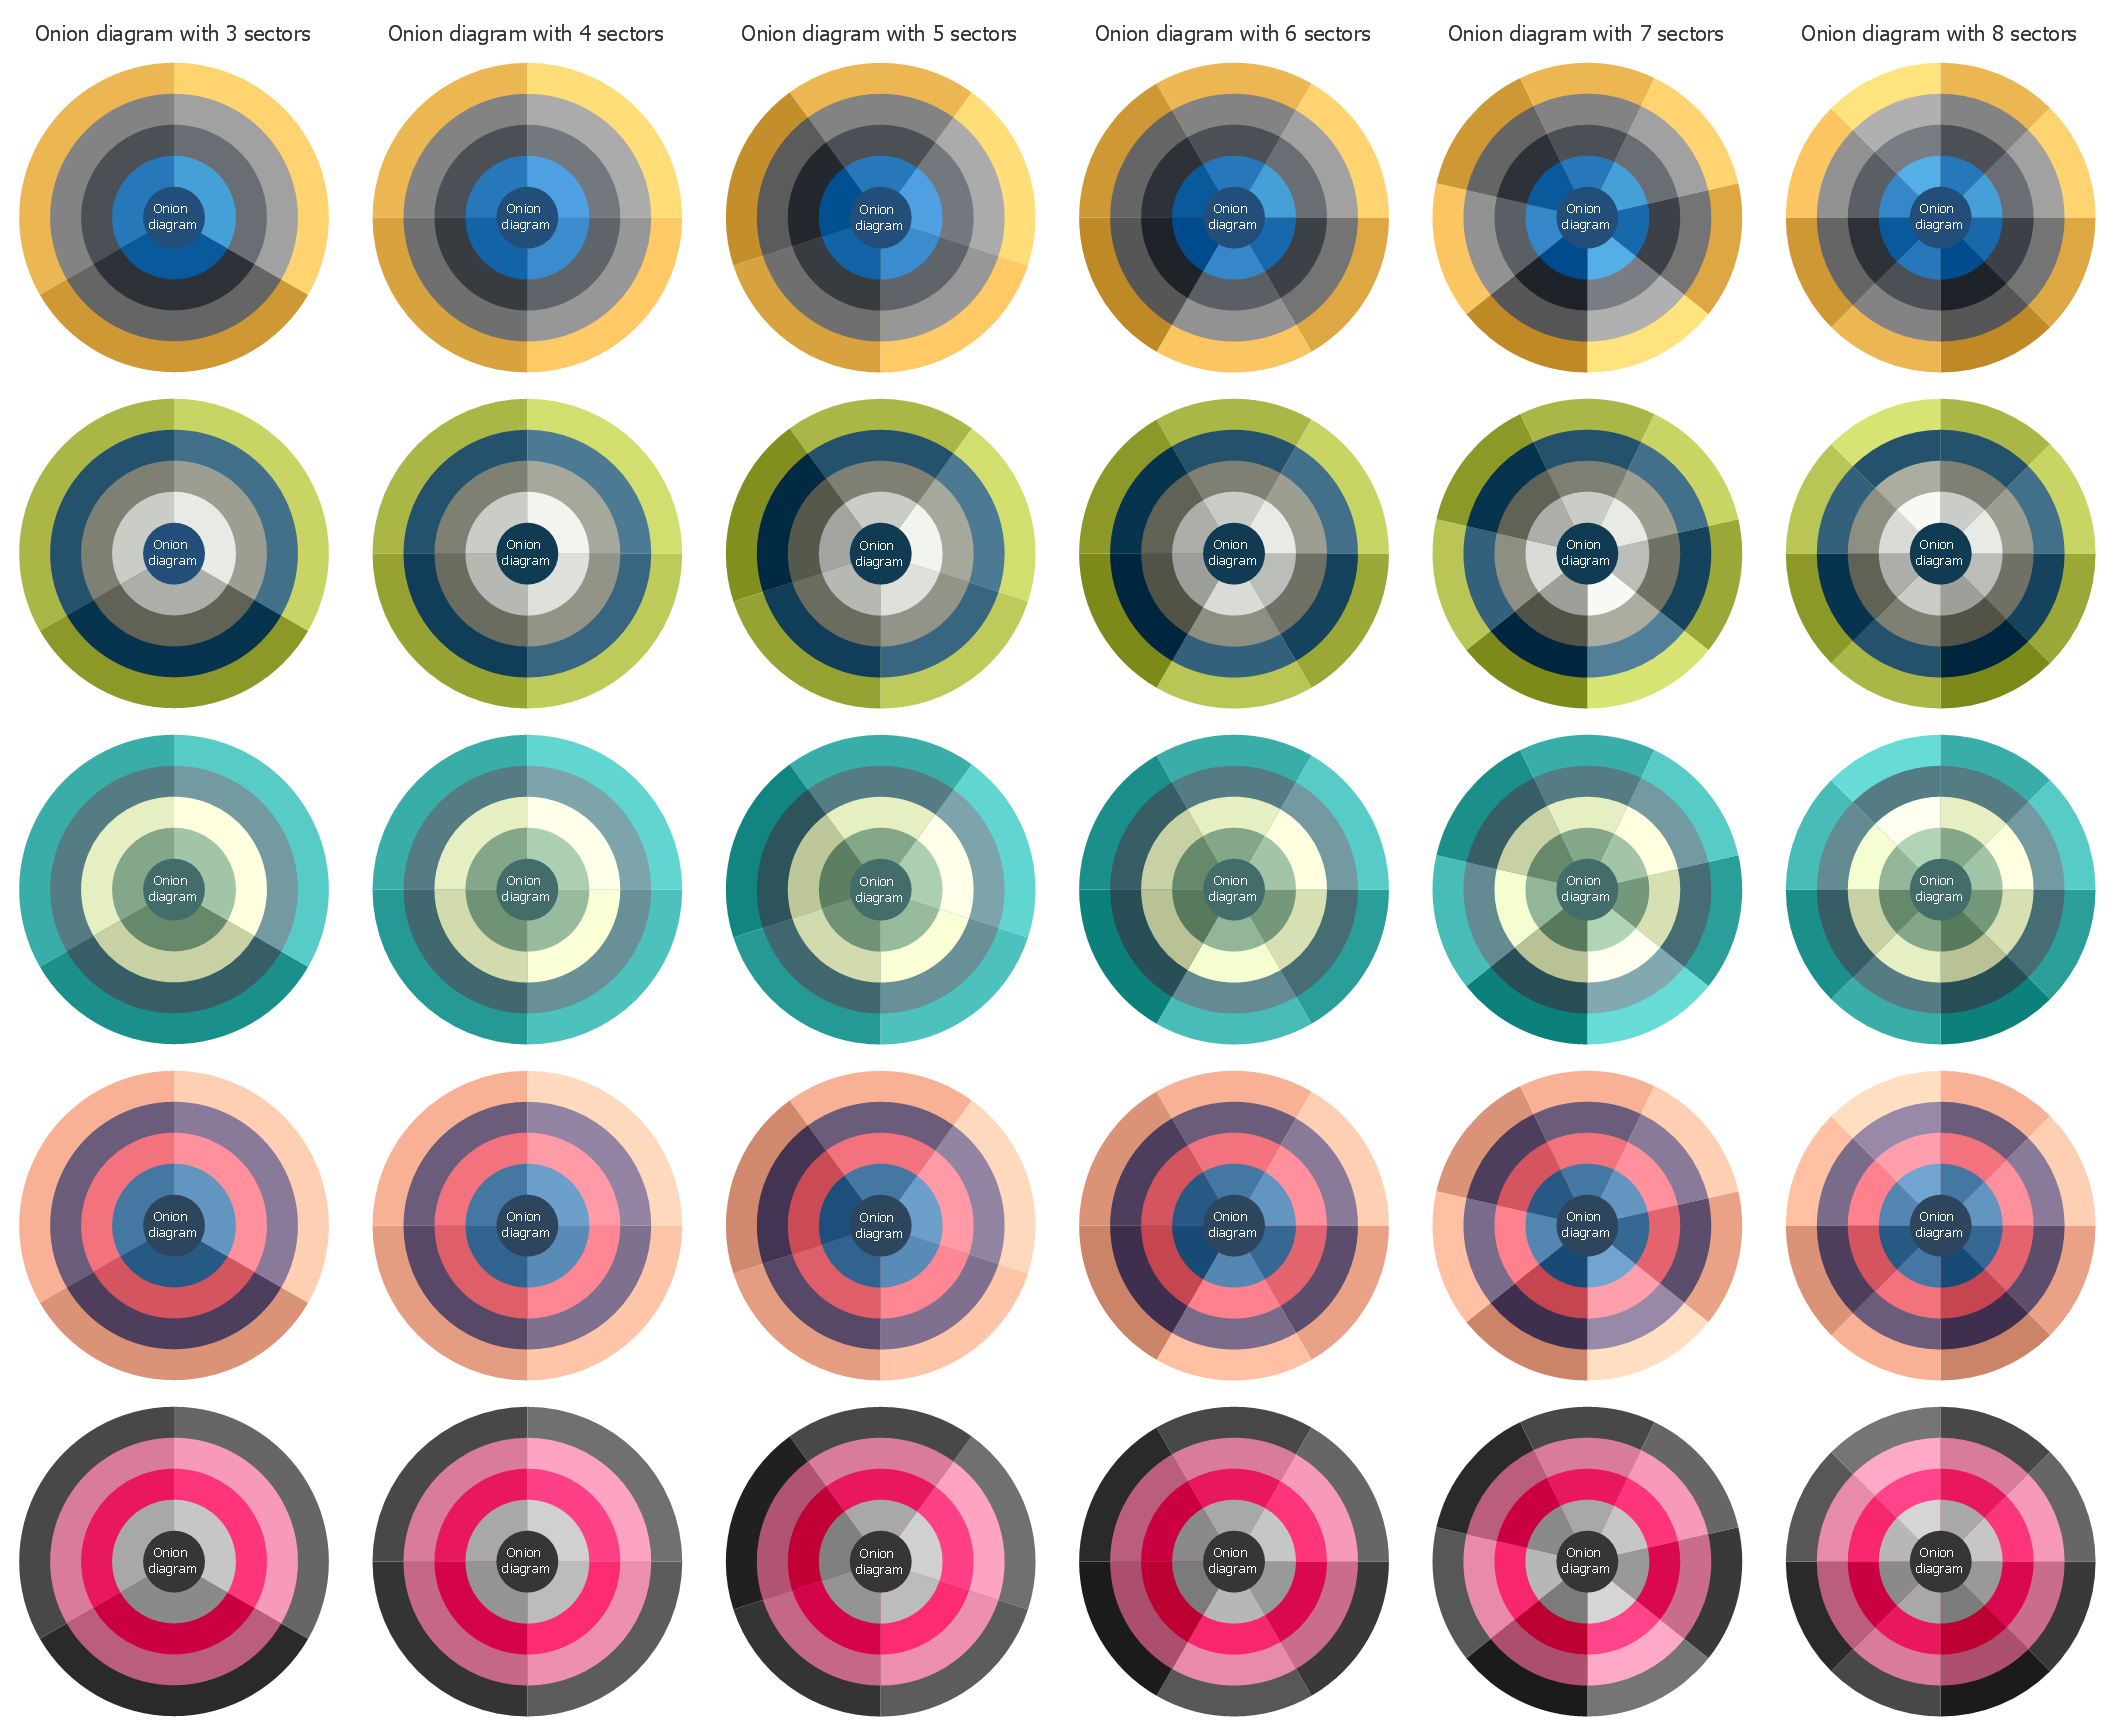
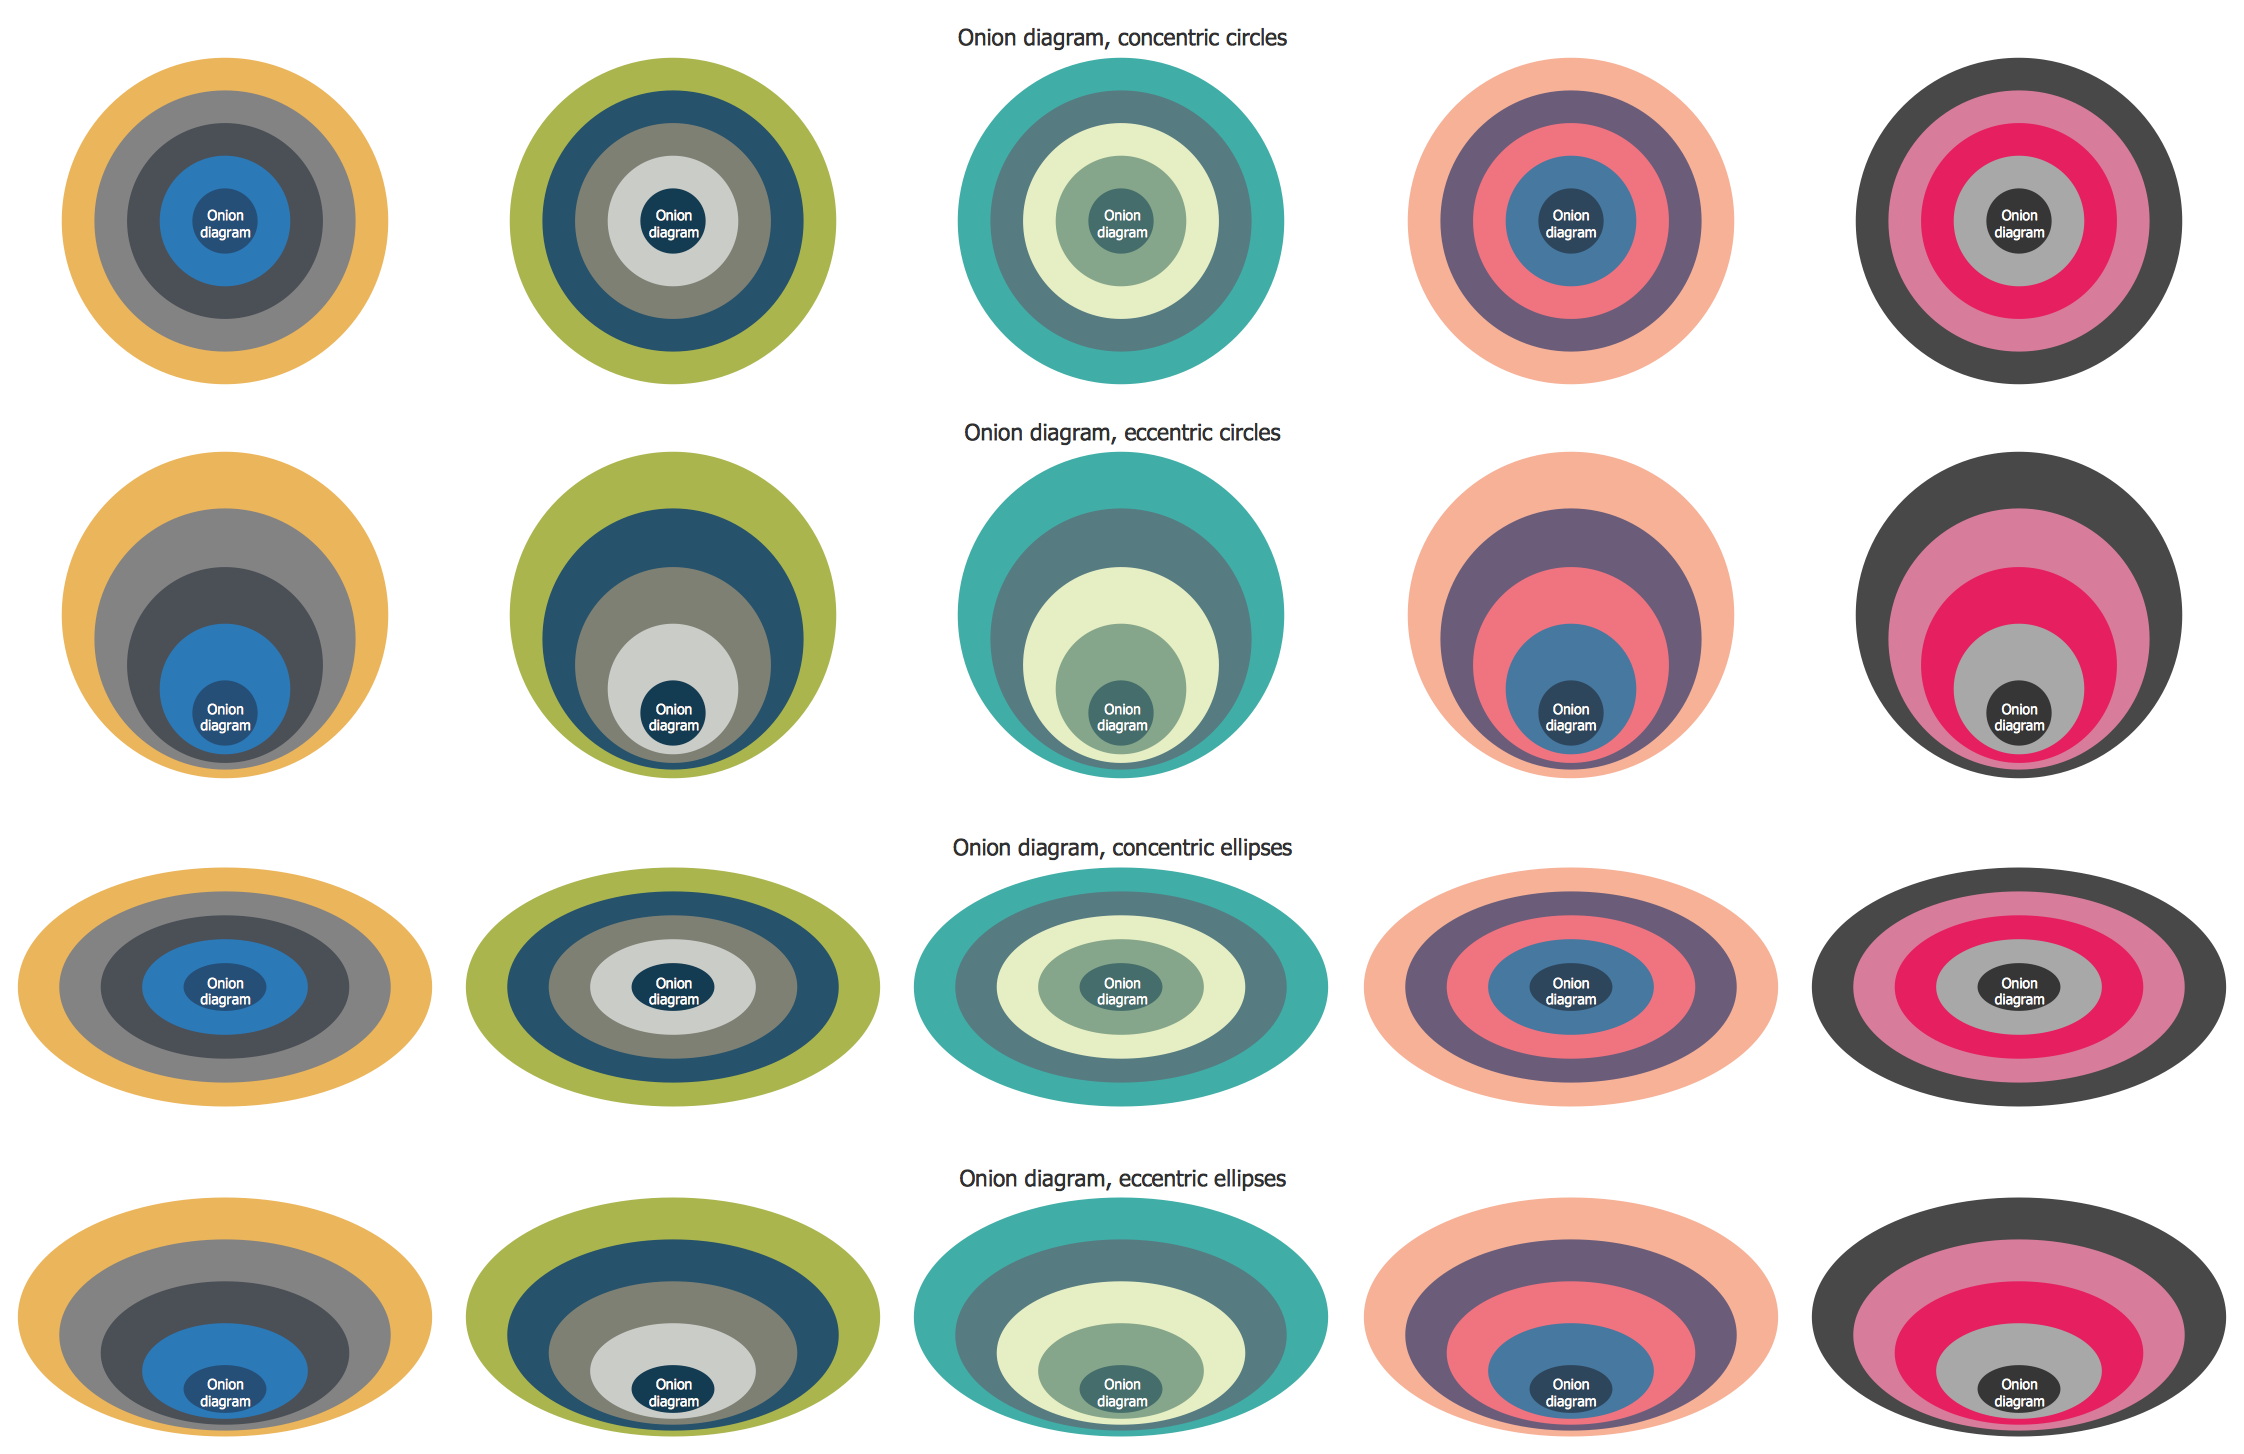
Stakeholder Onion Diagrams Solution
This solution with colorful stakeholder icons and stakeholder onion diagrams vector objects helps in the field of stakeholder management and allows effectively realize the onion diagram process design, easily create informative and vivid Stakeholder Diagrams, Onion Diagrams on the base of stakeholder onion diagram template.
There are 3 libraries containing 91 objects and 13 examples in the Stakeholder Onion Diagrams solution.
CRM Center Dashboard Solution
Succeed in drawing the CRM Dashboards and CRM Center Dashboards depicting current and actual companies information and data with ConceptDraw DIAGRAM CRM software supplied with CRM Center Dashboard solution.
There are 5 stencil libraries containing 192 vector objects and pictograms and 10 examples in the CRM Center Dashboard solution.
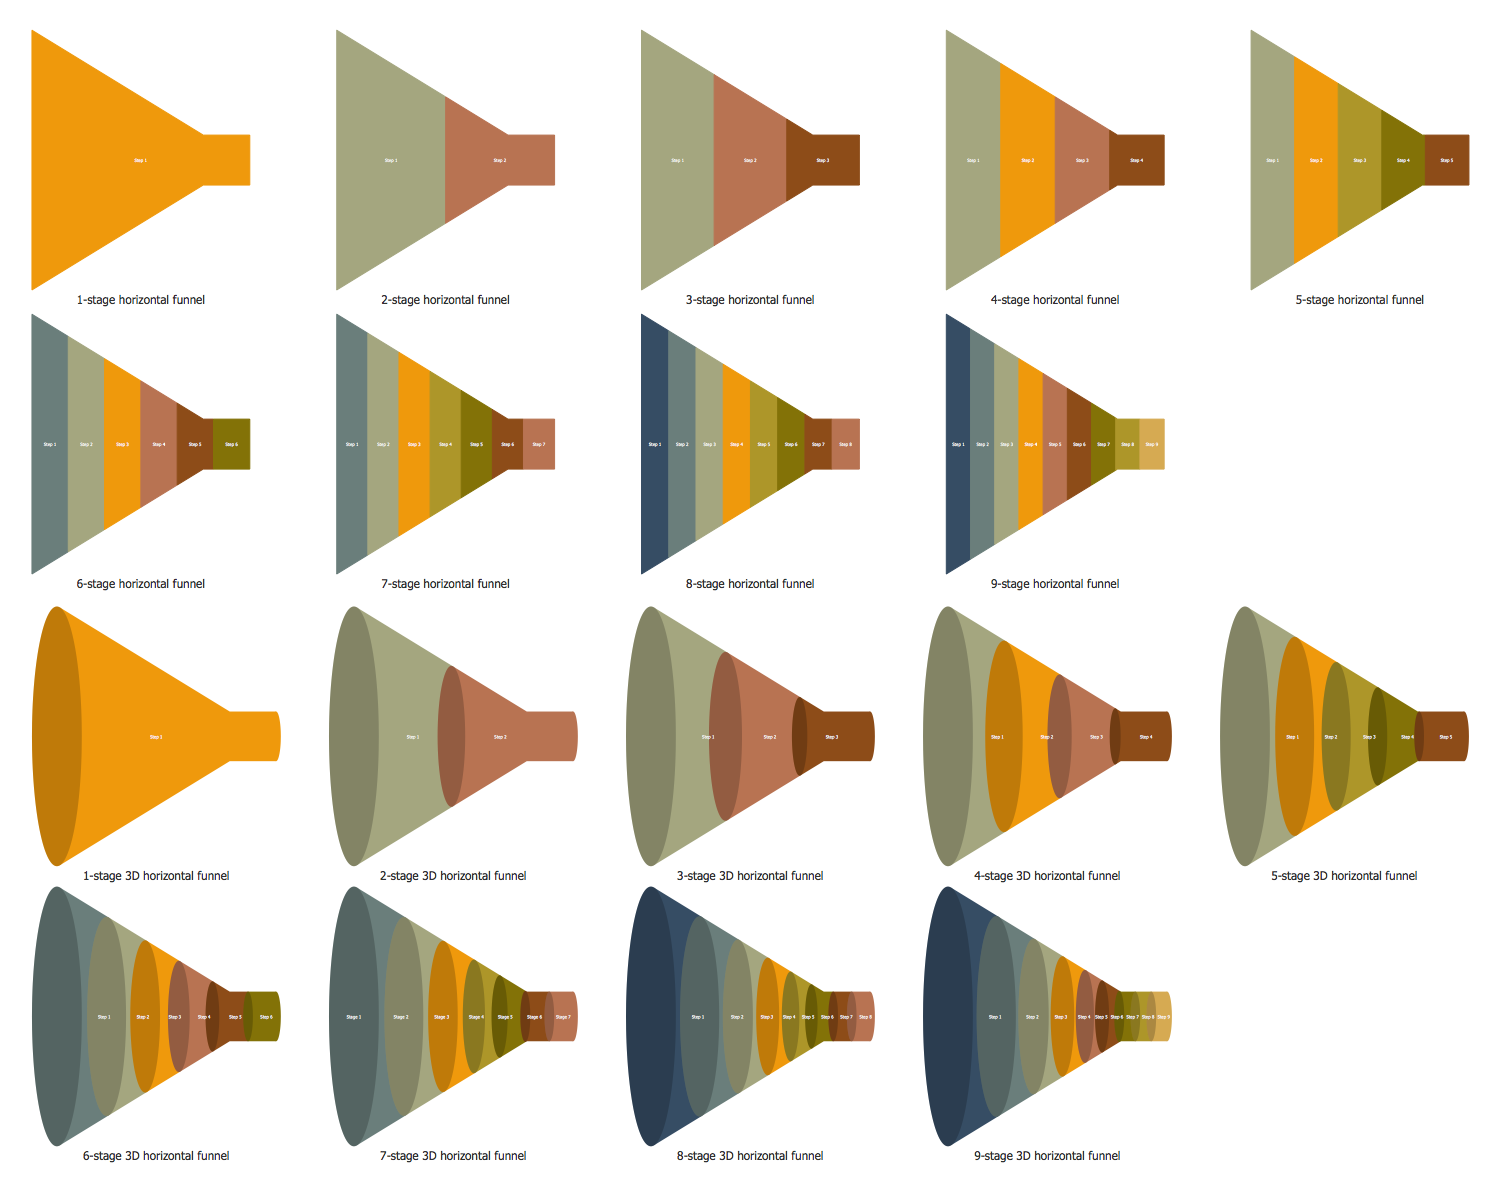
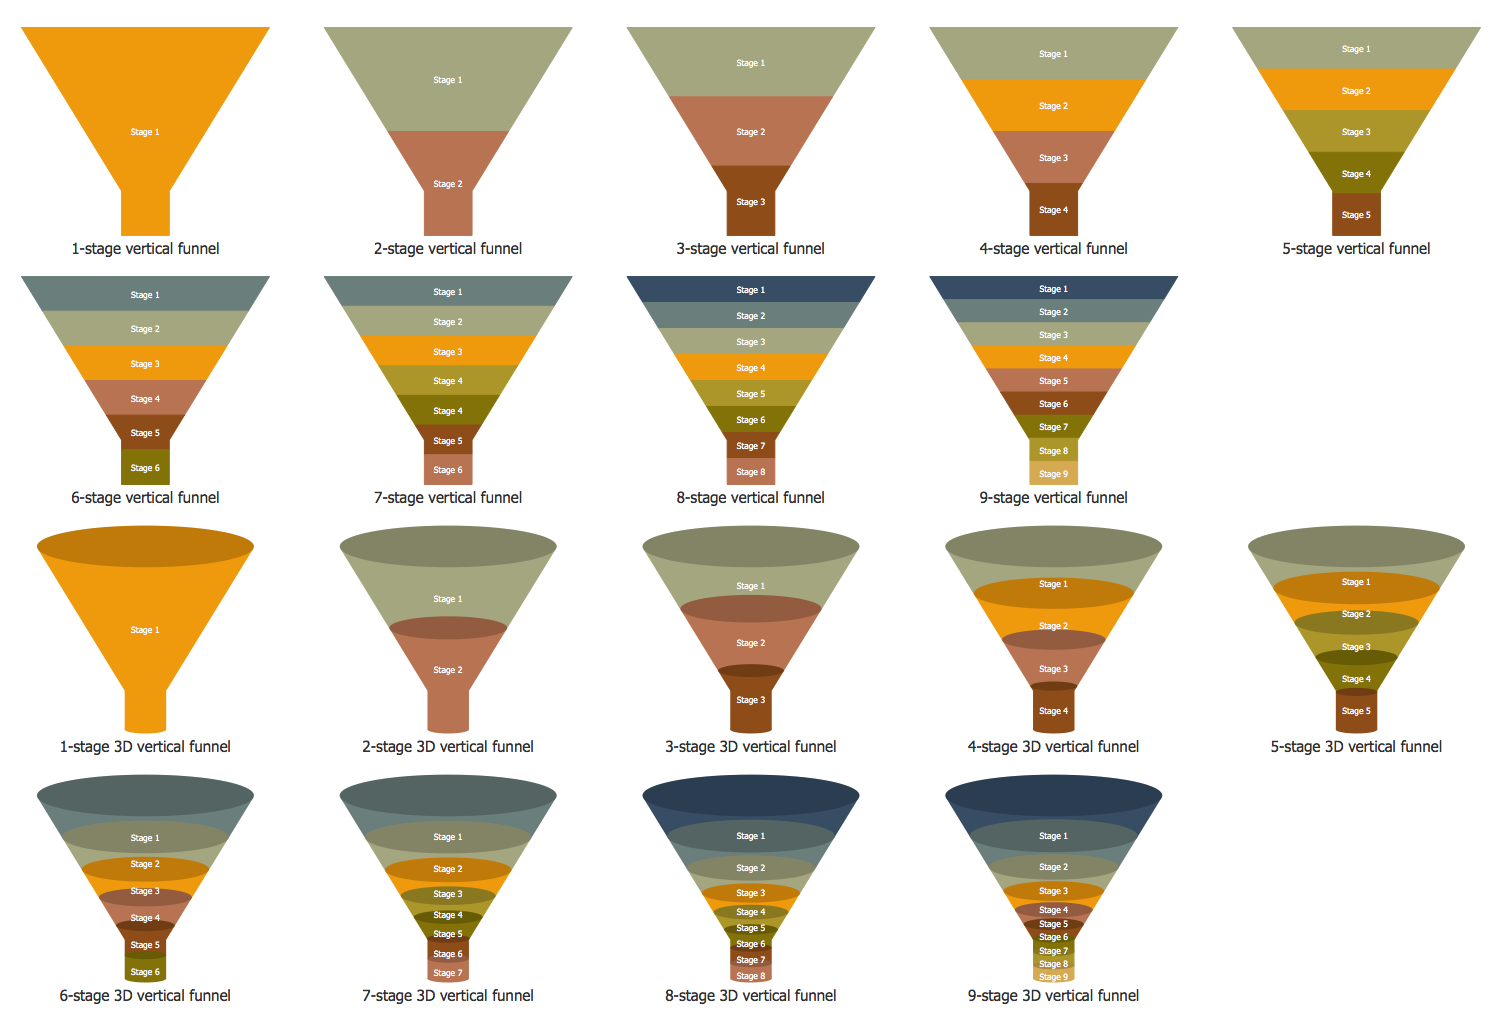
Funnel Diagrams Solution
This solution offers the best tools for designing the funnel diagrams of different types, designs, and orientation, which are able to help you achieve excellent results in development your marketing strategy and in selling your products or services.
There are 5 stencil libraries containing 145 vector objects and pictograms and 57 examples in the Funnel Diagrams solution.
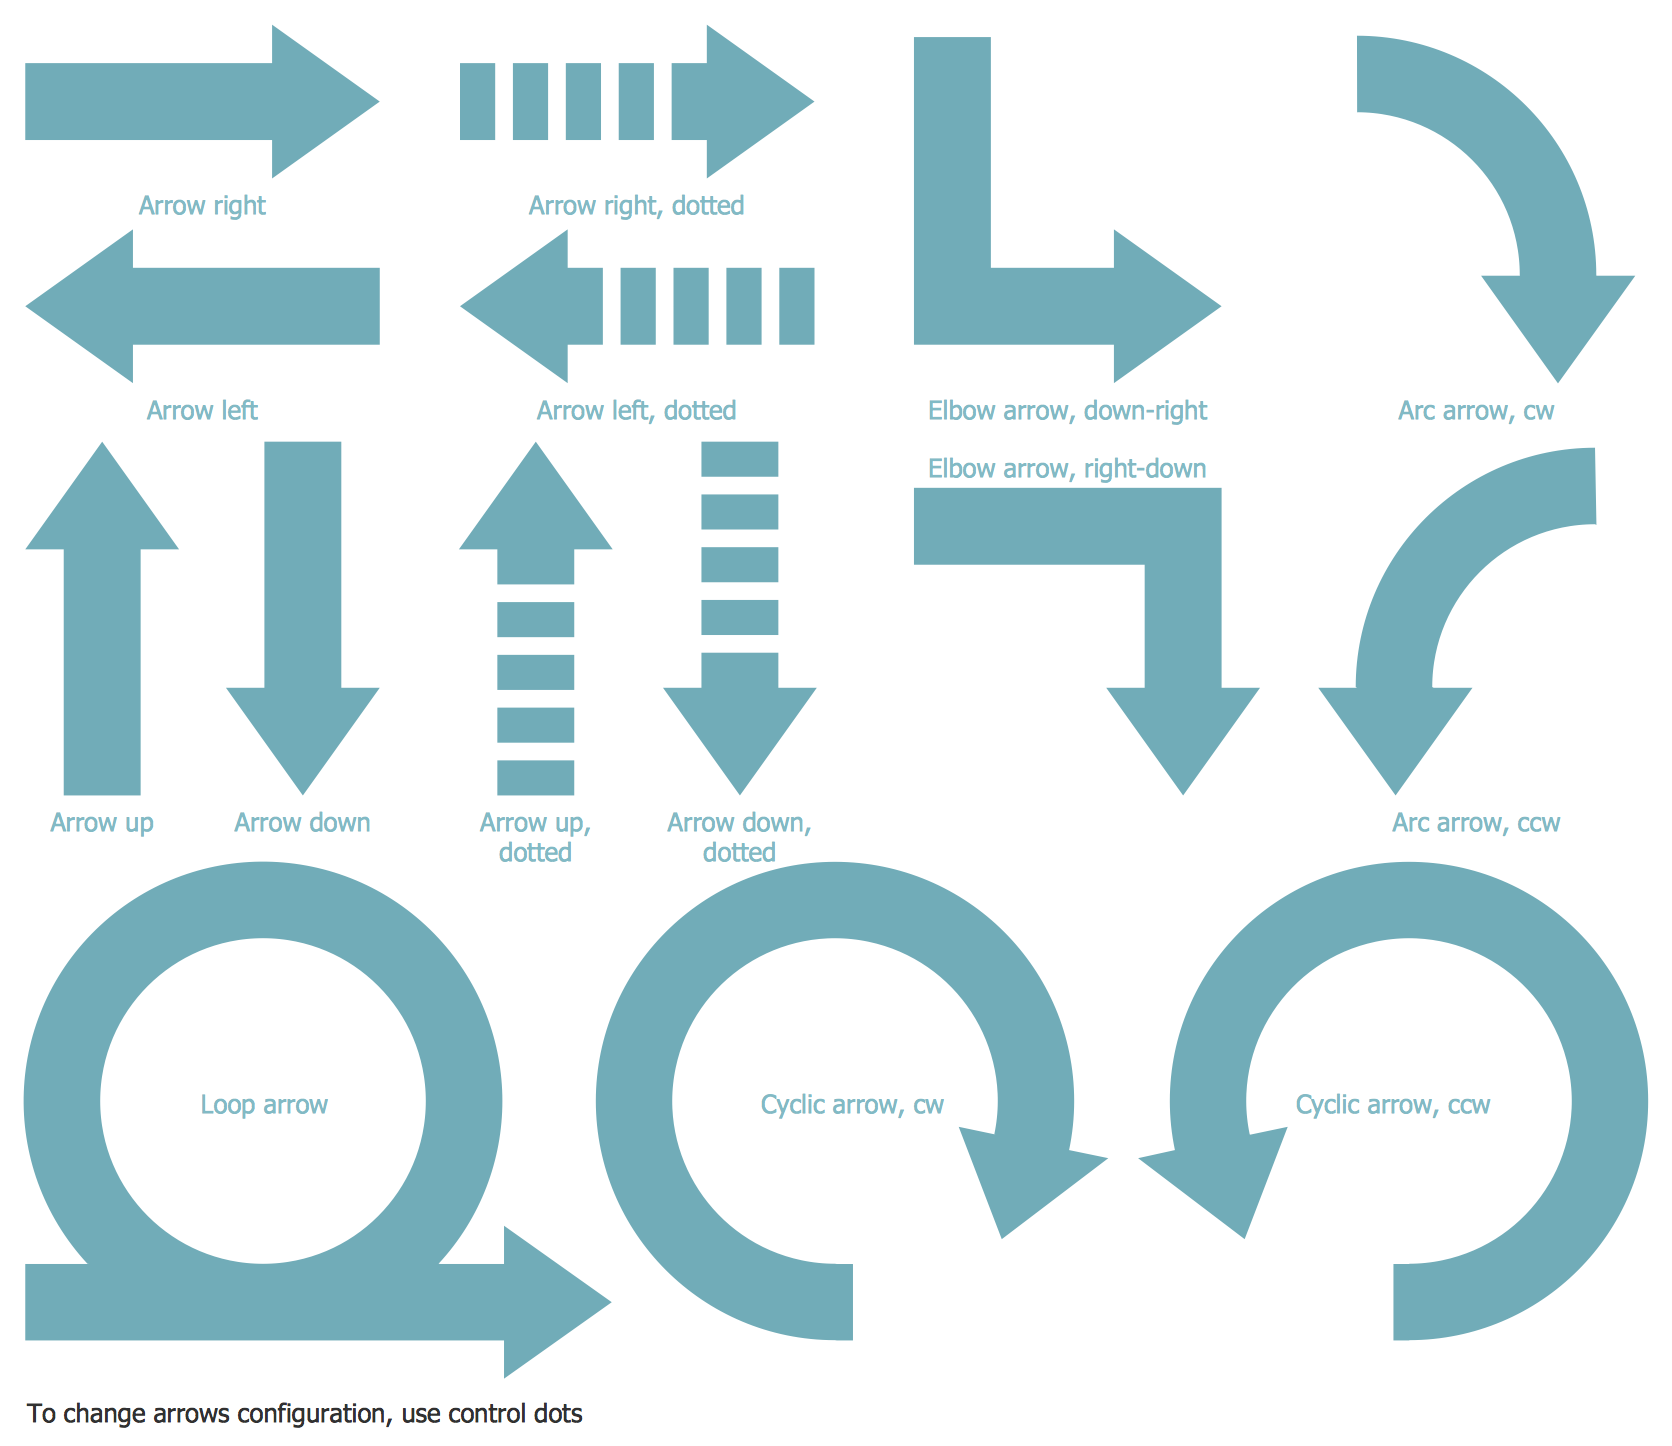
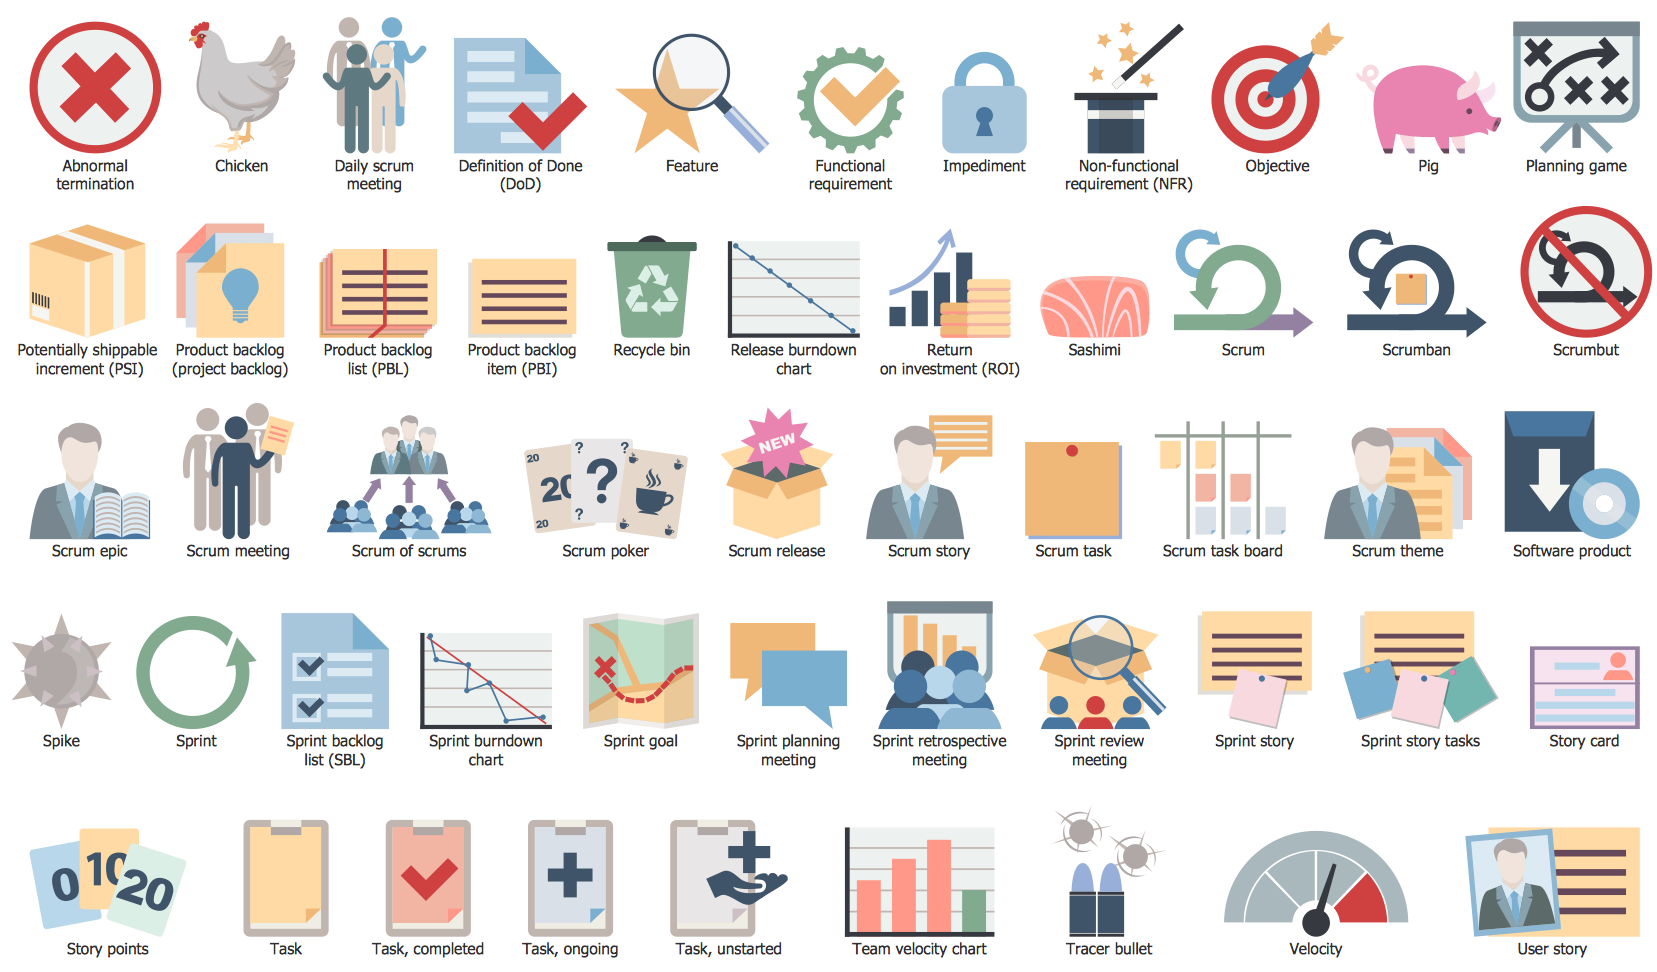
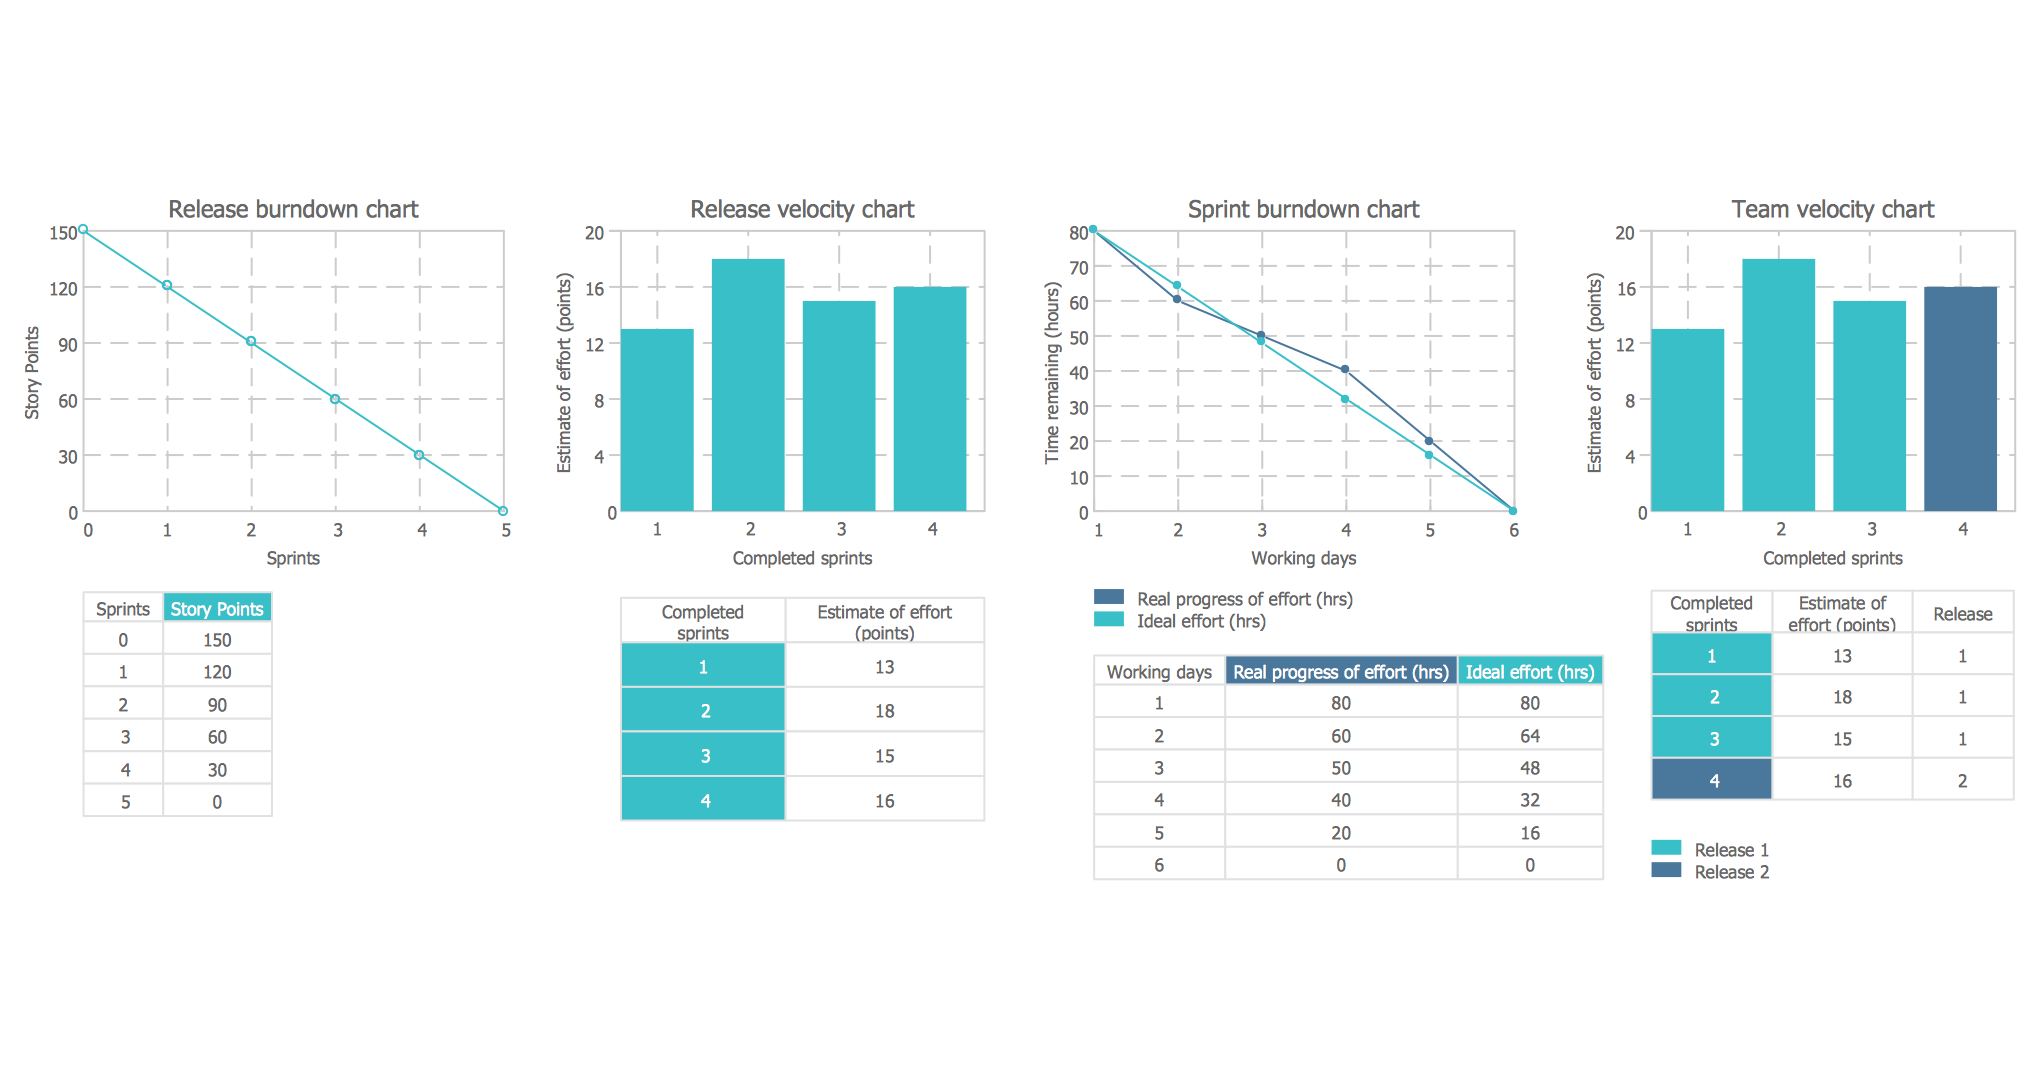
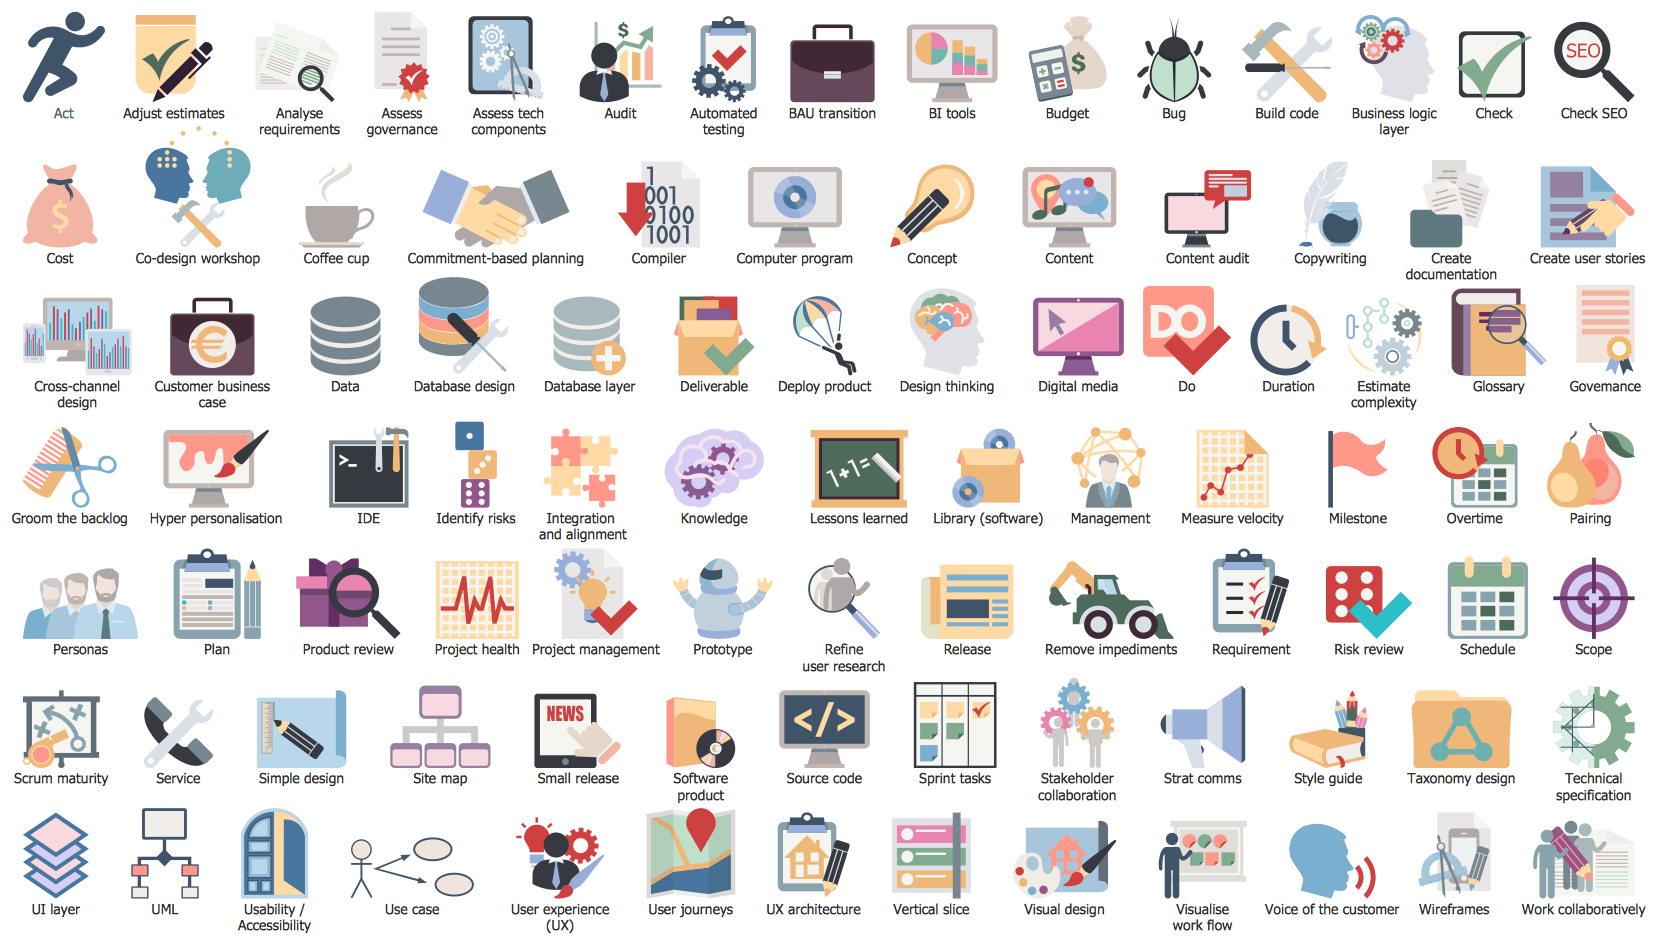
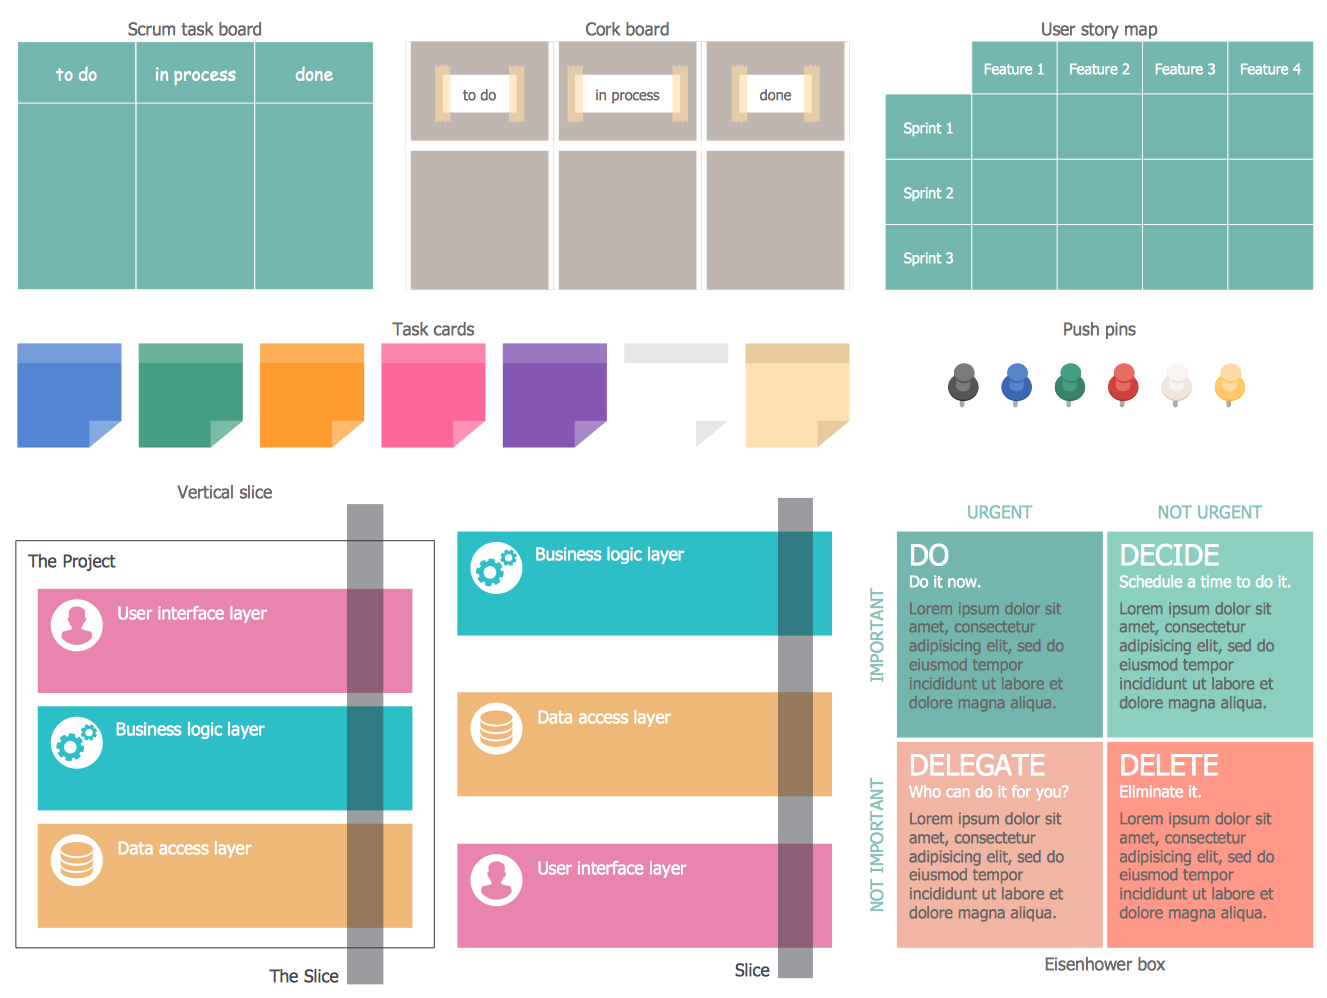
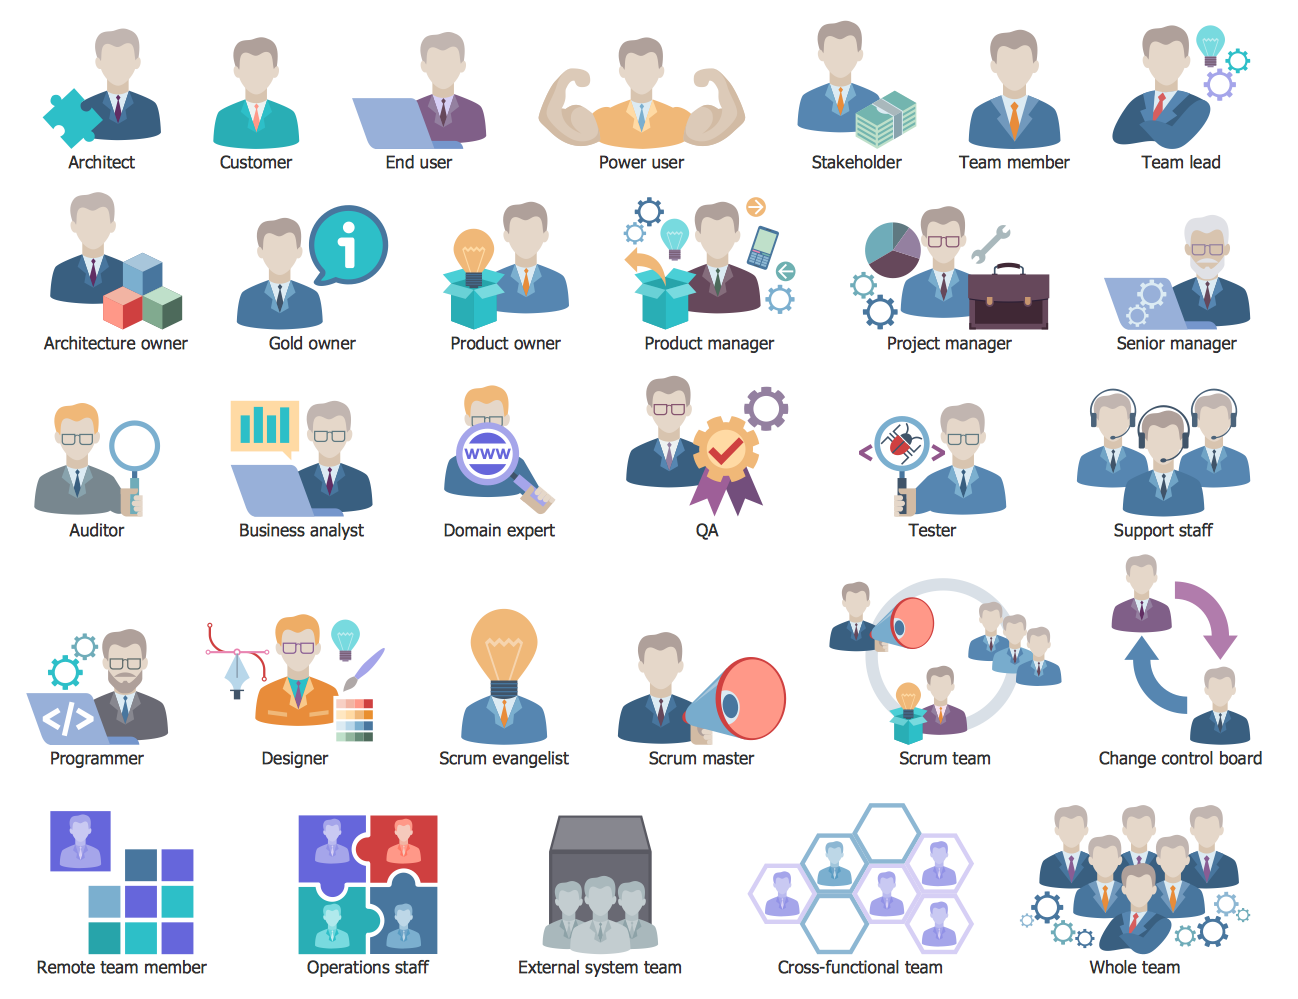
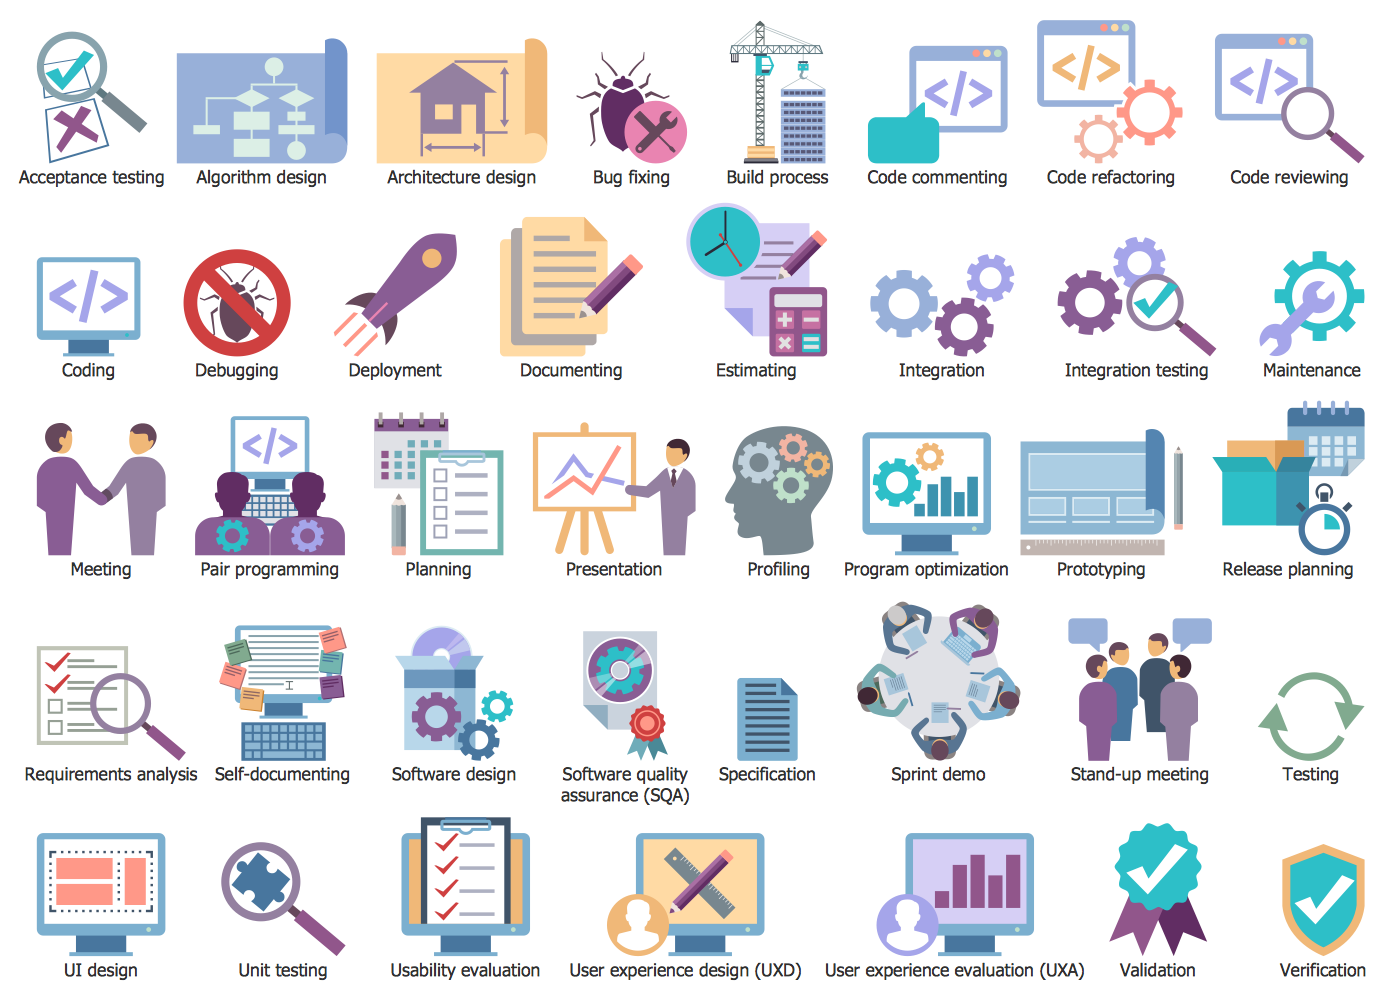
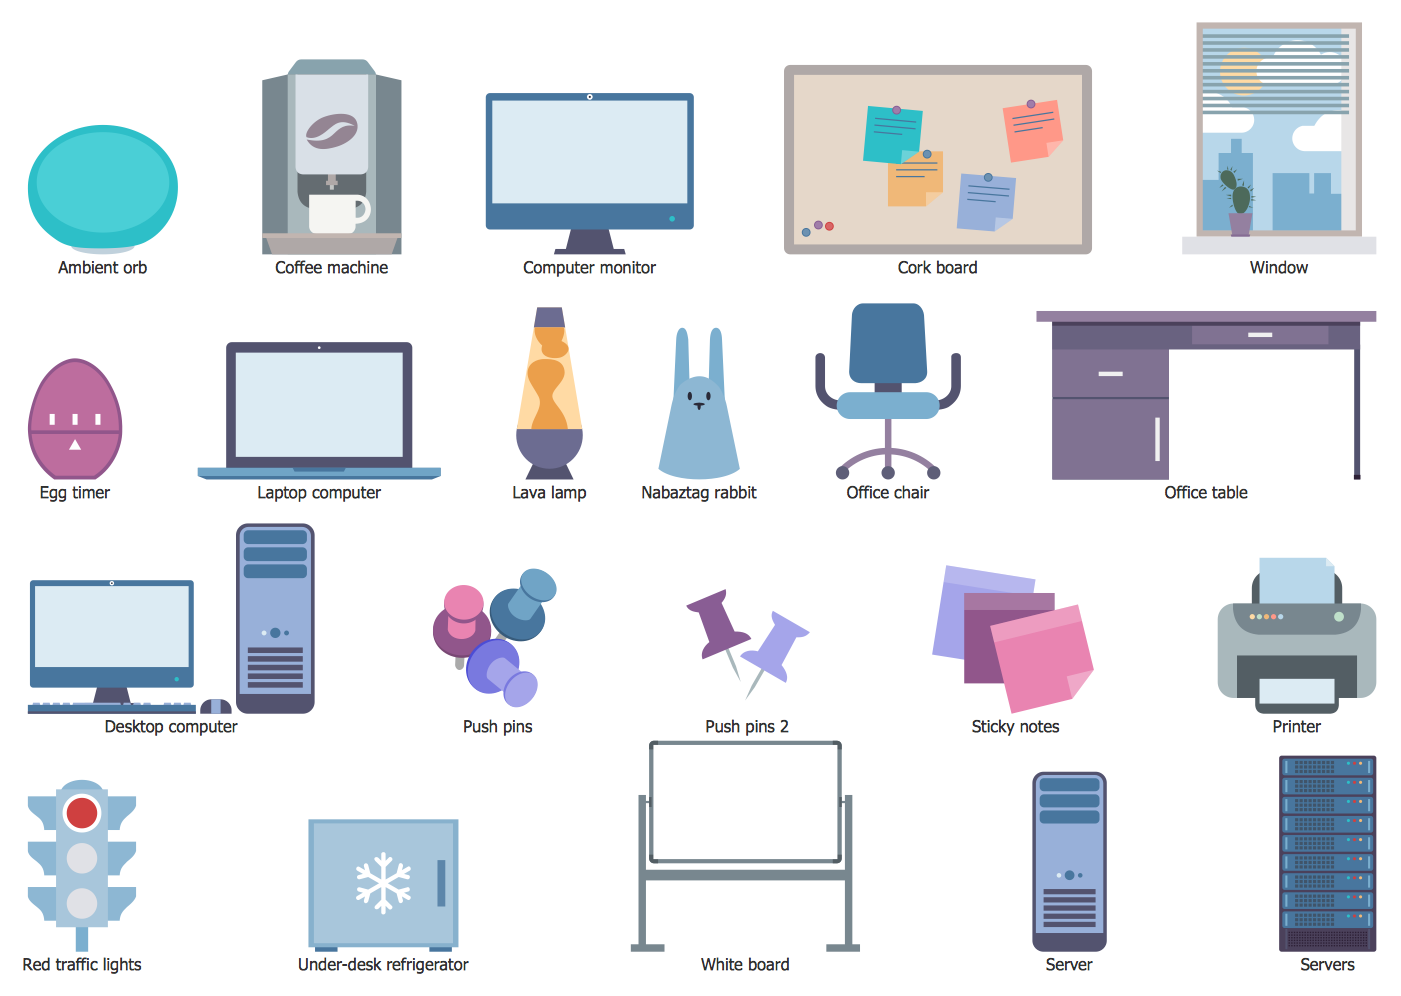
Scrum Workflow Solution
Succeed in applying Agile methodology and Scrum methodology for software development, and effectively design pictorial and attractive Scrum Charts, Scrum Workflow Diagrams, Scrum Infographics, Scrum Mind Maps, Scrum board with Scrum Workflow solution.
There are 8 stencil libraries containing 276 vector graphics and 23 examples in the Scrum Workflow solution.
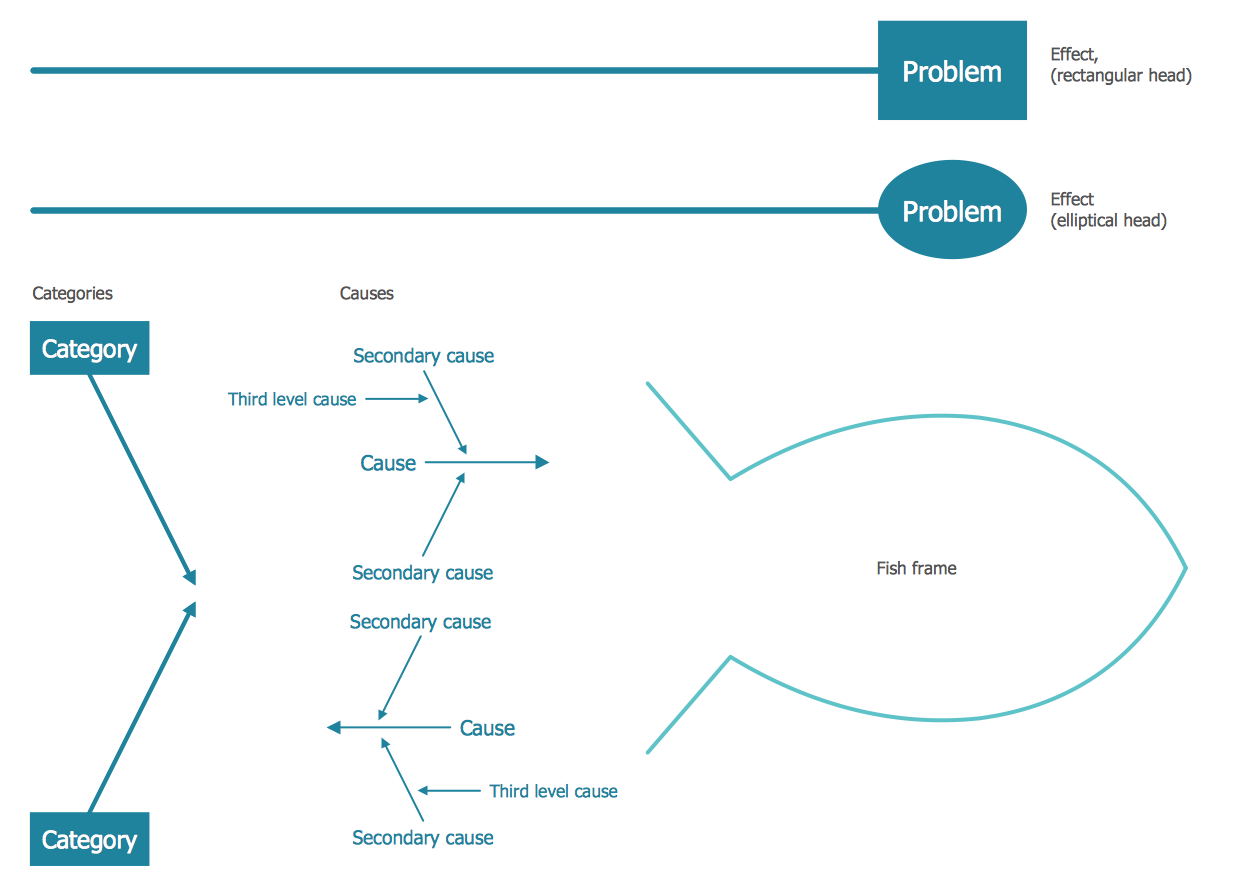
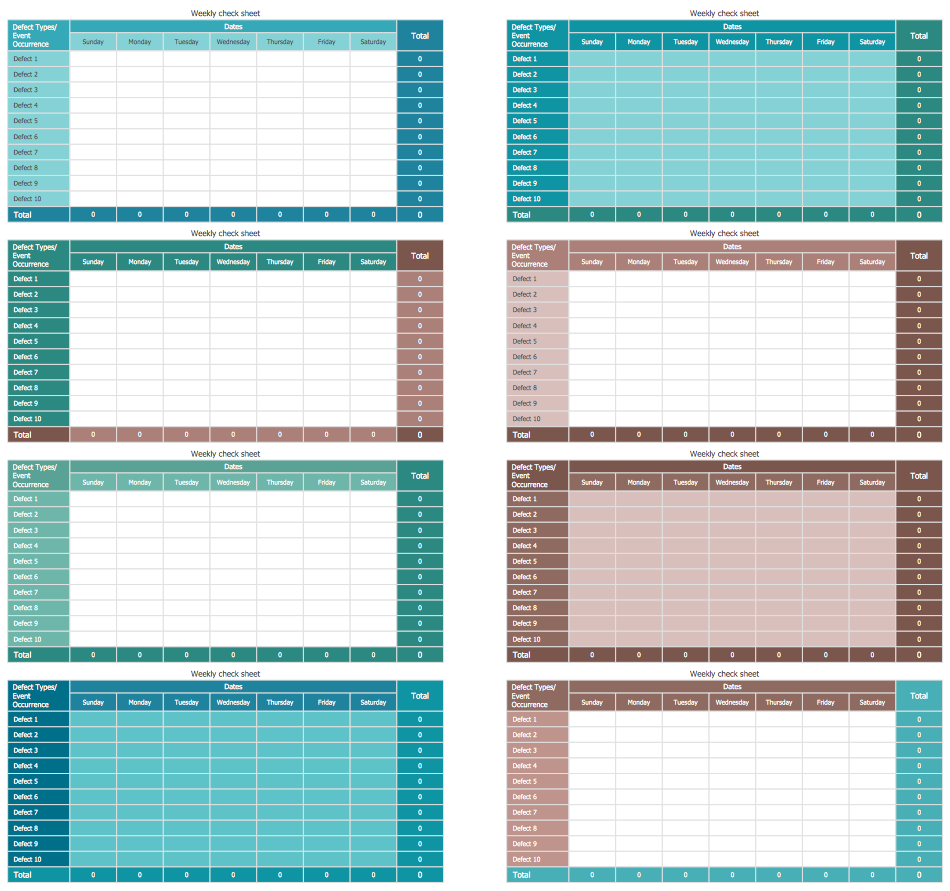
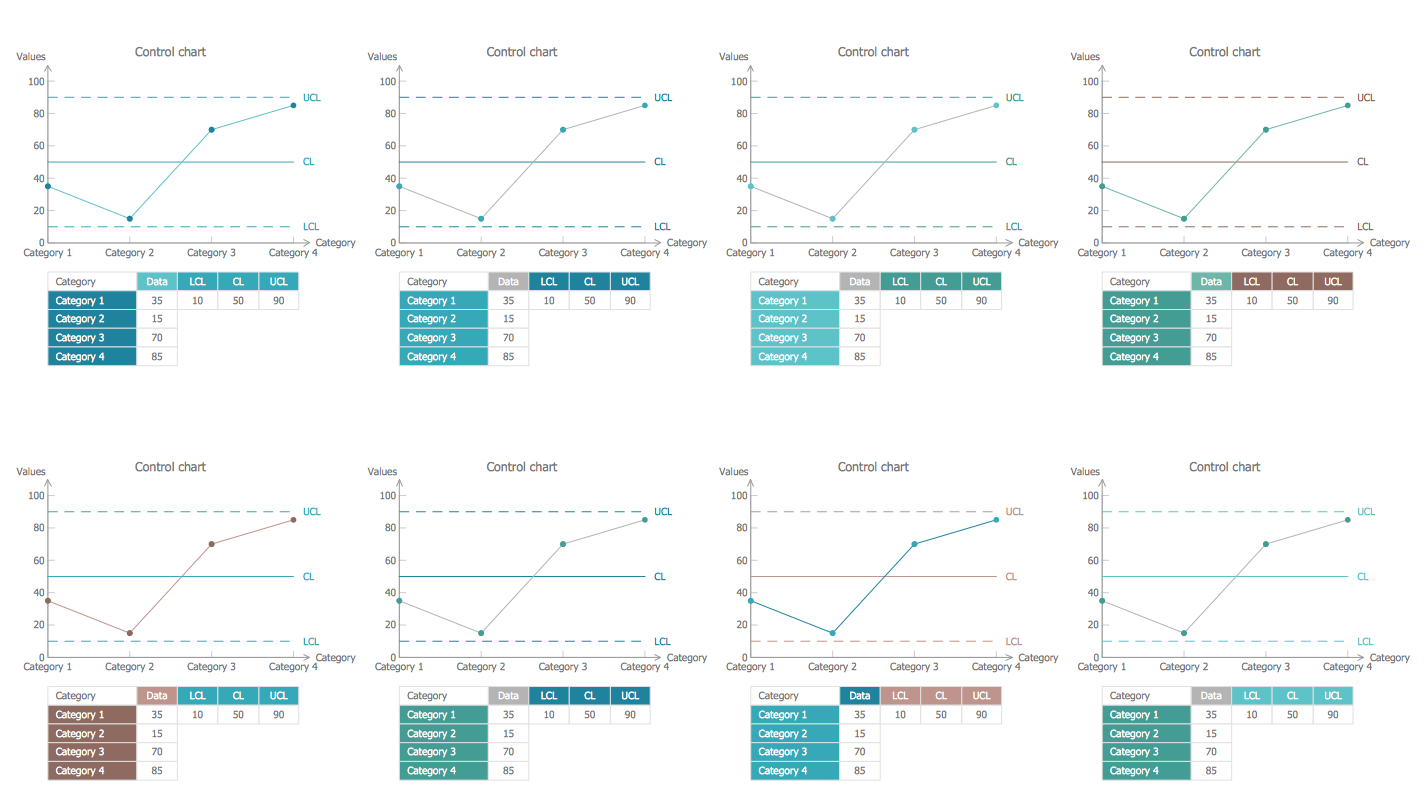
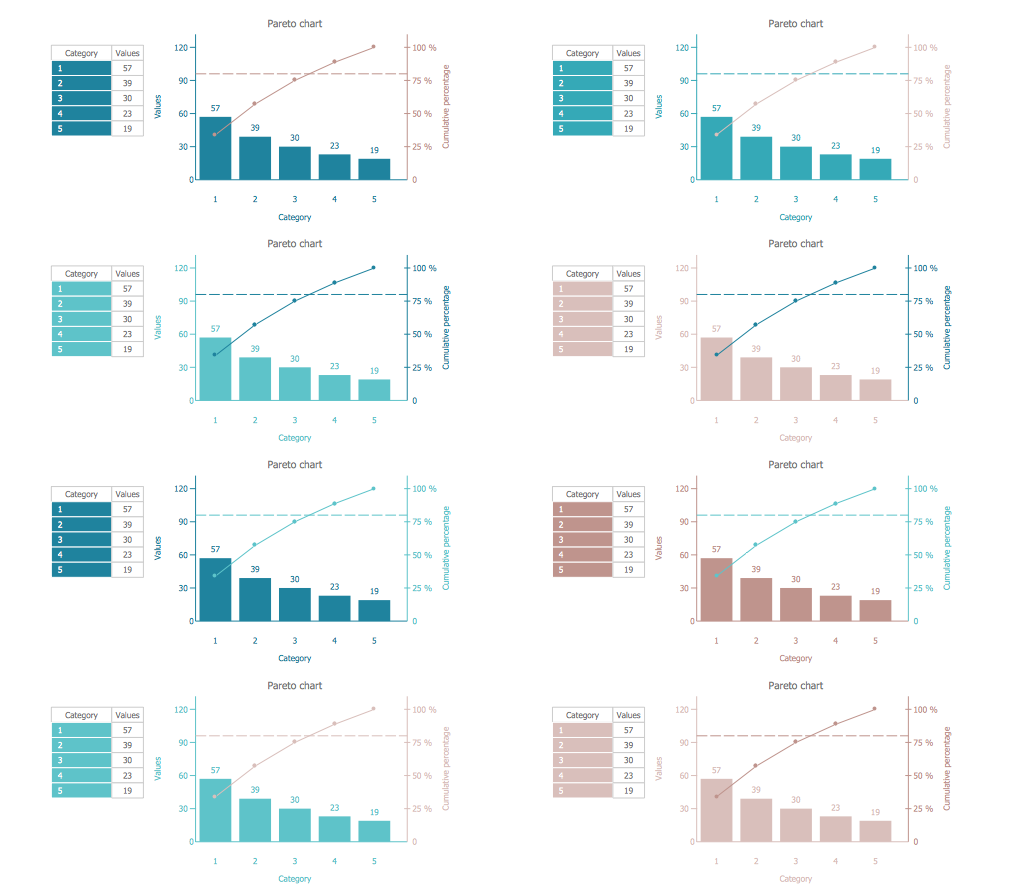
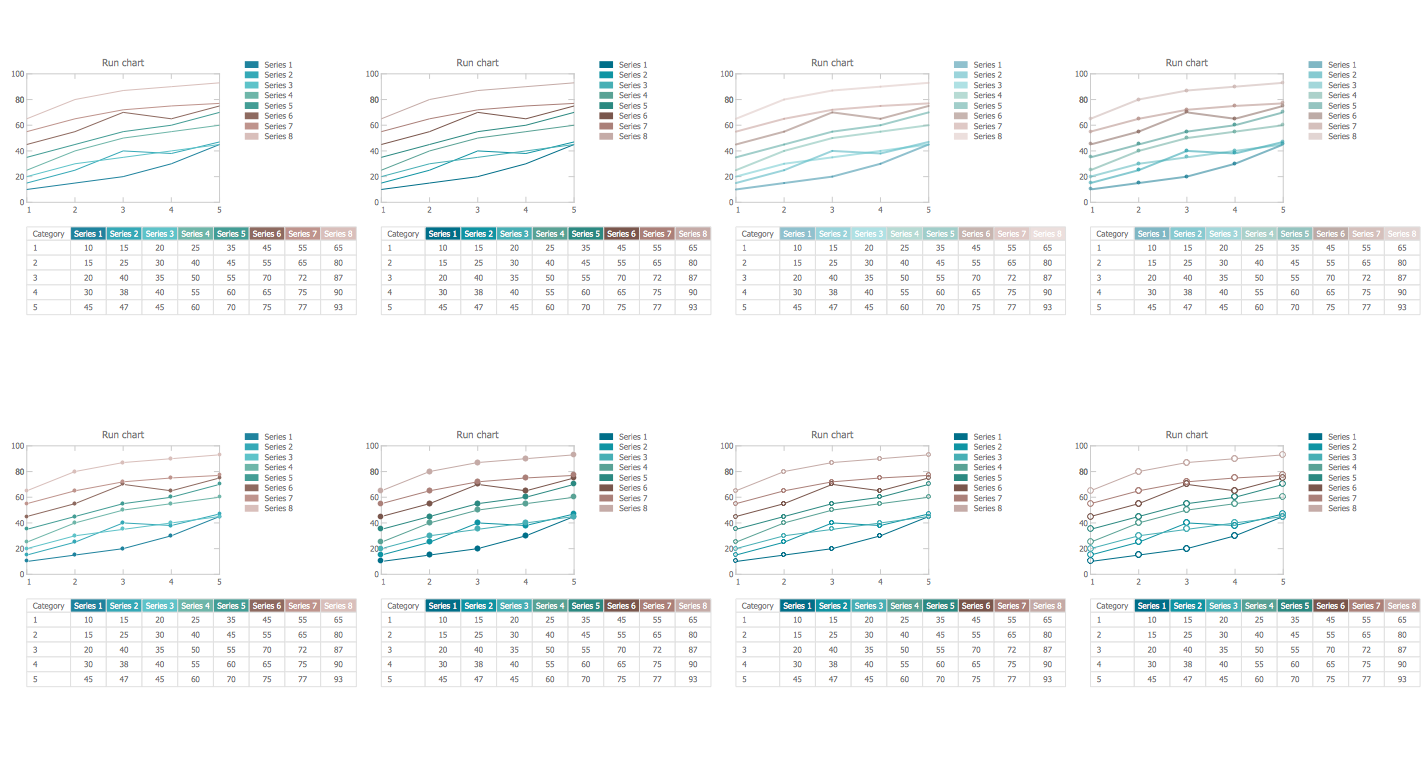
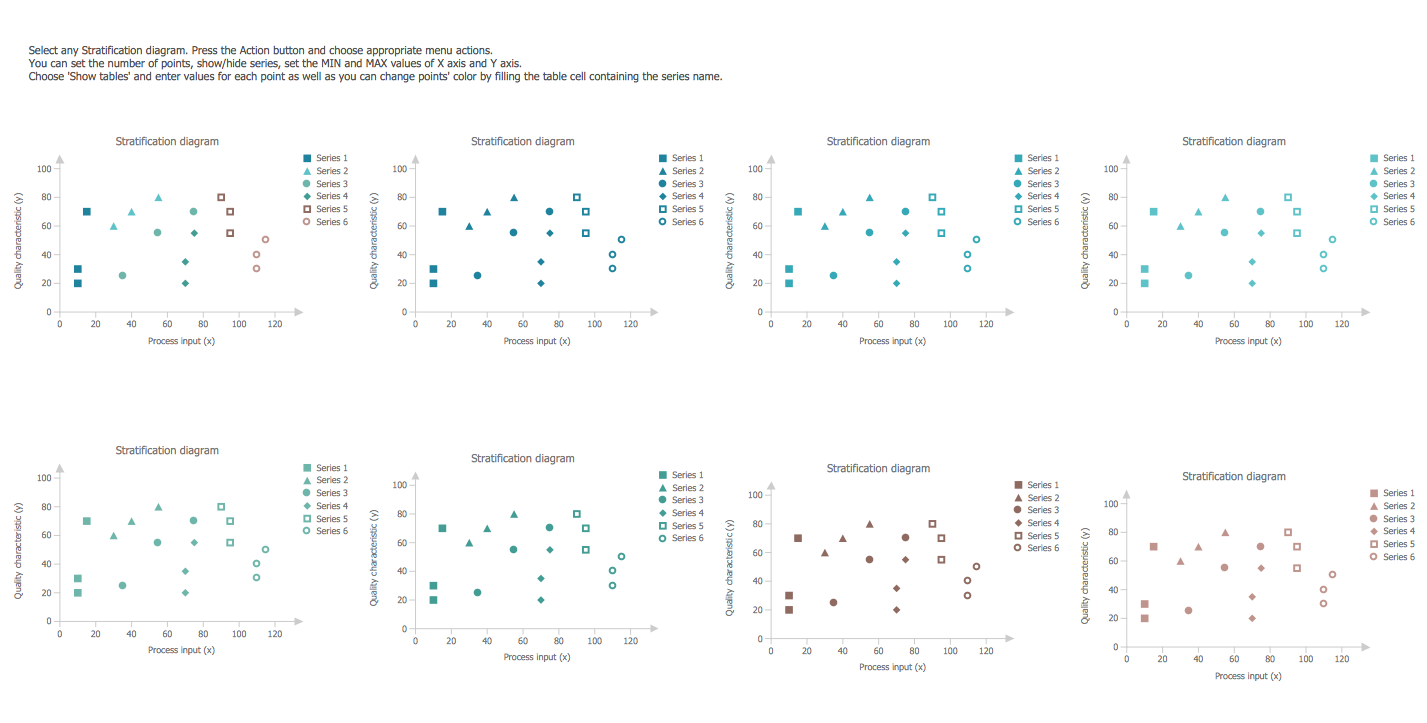
Seven Basic Tools of Quality Solution
Achieve quality results by using a quality solution. The Seven Basic Tools promote high standards throughout your business, using basic graphical techniques that are recognizable to employees from all departments.
There are 9 libraries containing 78 vector objects and 10 examples in the Seven Basic Tools of Quality solution.

HR Dashboard Solution
Use the power of HR Dashboard solution to design professional looking and attractive HR Dashboards of any style and degree of detalization, using collection of comprehensive vector design elements, icons, pictograms and objects, navigation elements, live objects of HR charts, HR indicators, and thematic maps offered by HR Dashboard solution libraries.
There are 5 stencil libraries containing 103 vector objects and pictograms and 10 examples in the HR Dashboard solution.
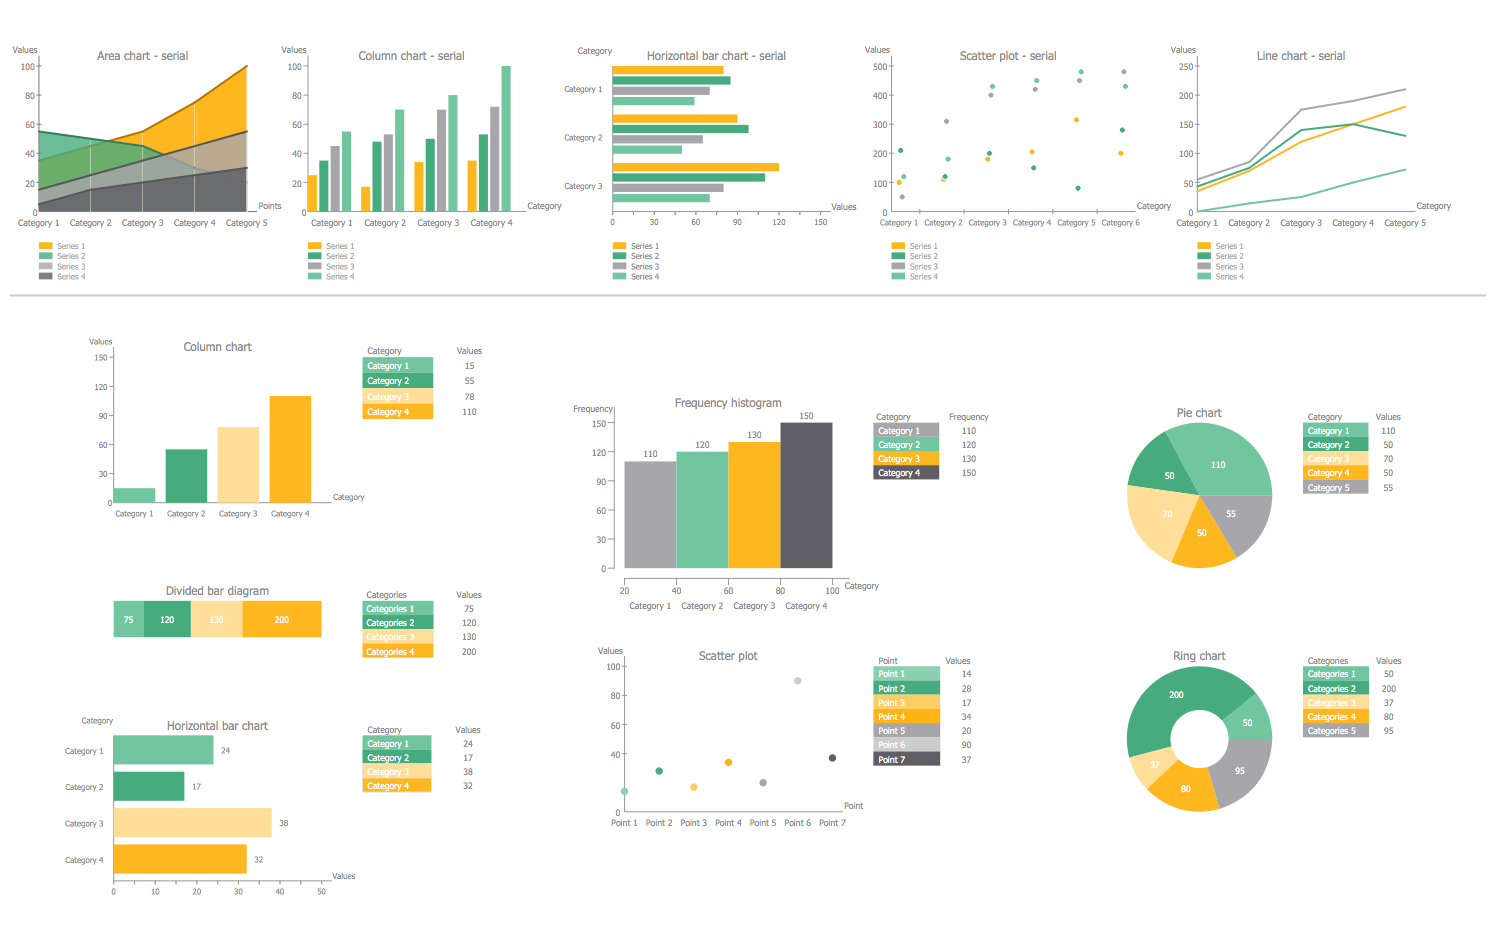
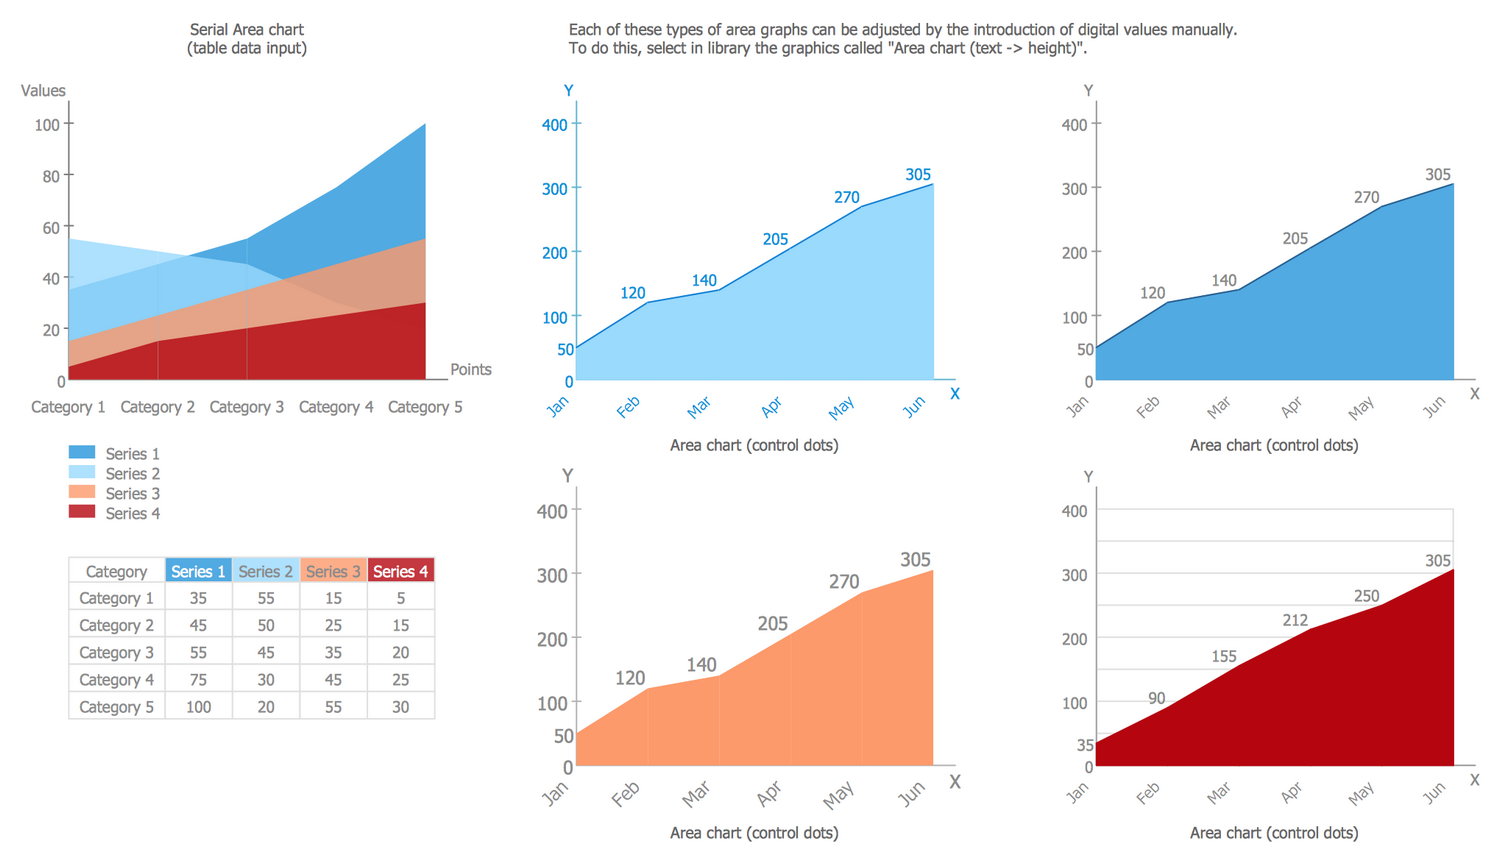
Area Charts Solution
Area charts or graphs visualize changes in values by filling in the area beneath a line that connects data points. Area charts are often used to visualize cumulative totals over time.
There is 1 library containing 5 vector objects and 7 examples in the Area Charts solution.
Bar Graphs Solution
Bar graphs or charts are a popular way of presenting data, where each bars height indicates a specific data value. They can be used in a wide variety of business settings.
There is 1 library containing 8 objects and 10 examples in the Bar Graphs solution.

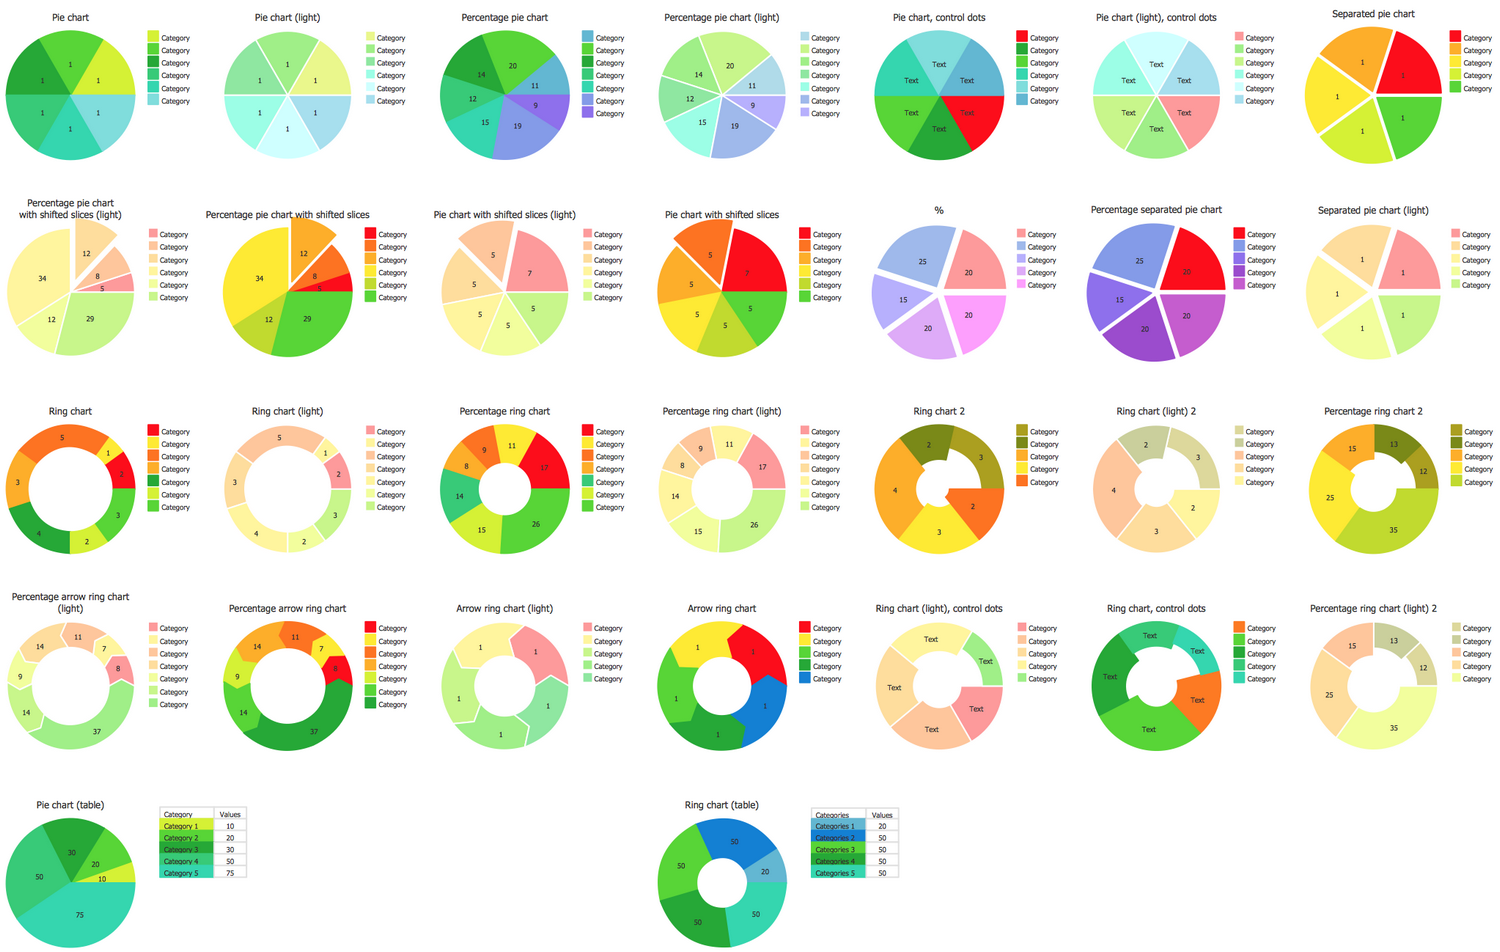
Pie Charts Solution
The Pie Charts solution allows you to create charts that can be used in statistics, business, and mass media for composition comparison (i.e. to visualize the percentage for the parts of one total).
There is 1 library containing 30 vector objects and 23 examples in the Pie Charts solution.
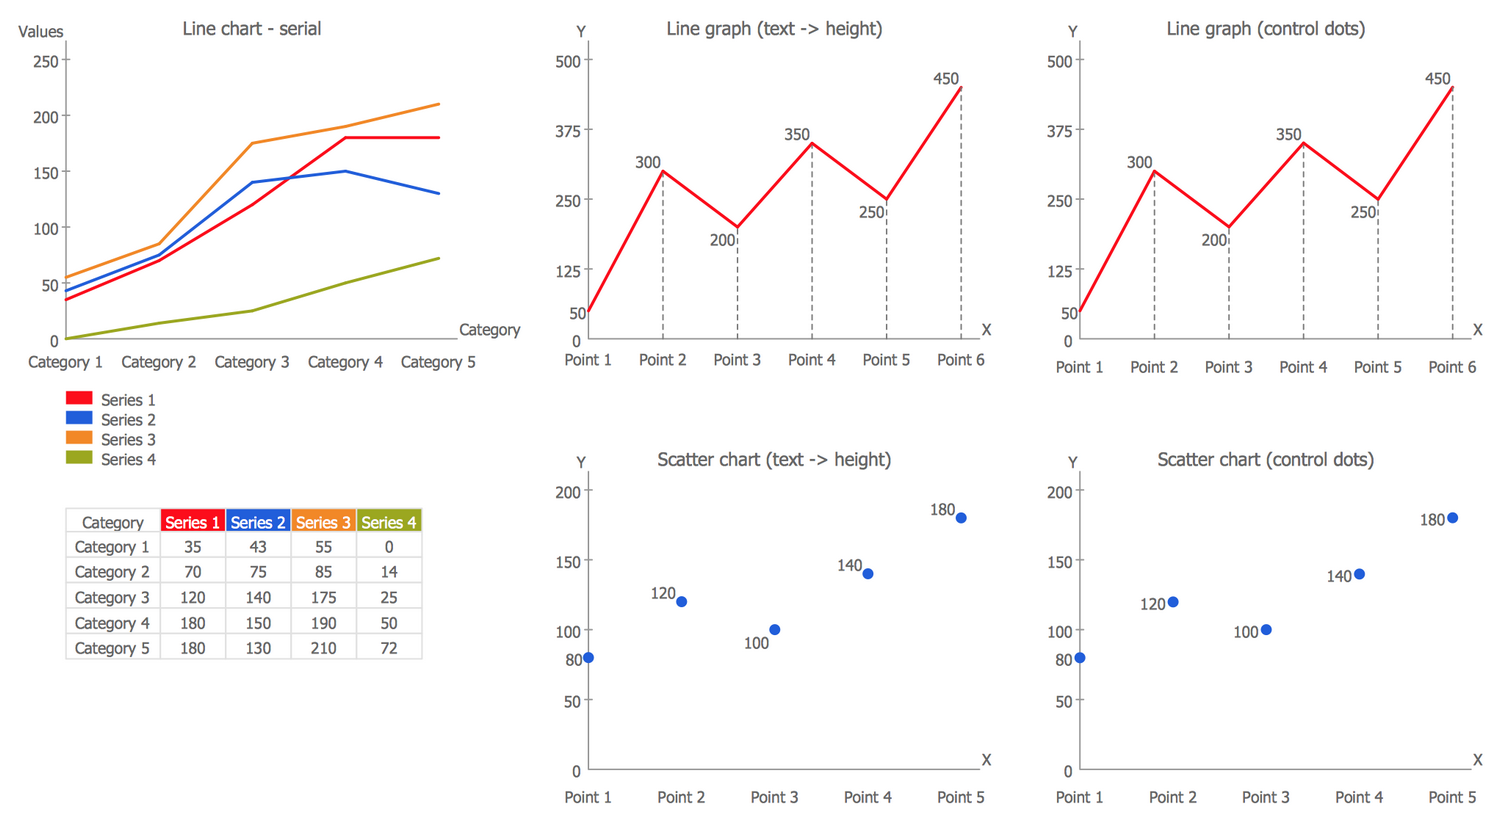
Line Graphs Solution
Use a line graph to show how one variable is affected by another as it increases or decreases. Line graphs are used to compare two variables, where each variable is plotted on a 2d graph. They are most useful when displaying data or information that changes continuously over time.
There is 1 library containing 5 vector objects and 10 examples in the Line Graphs solution.
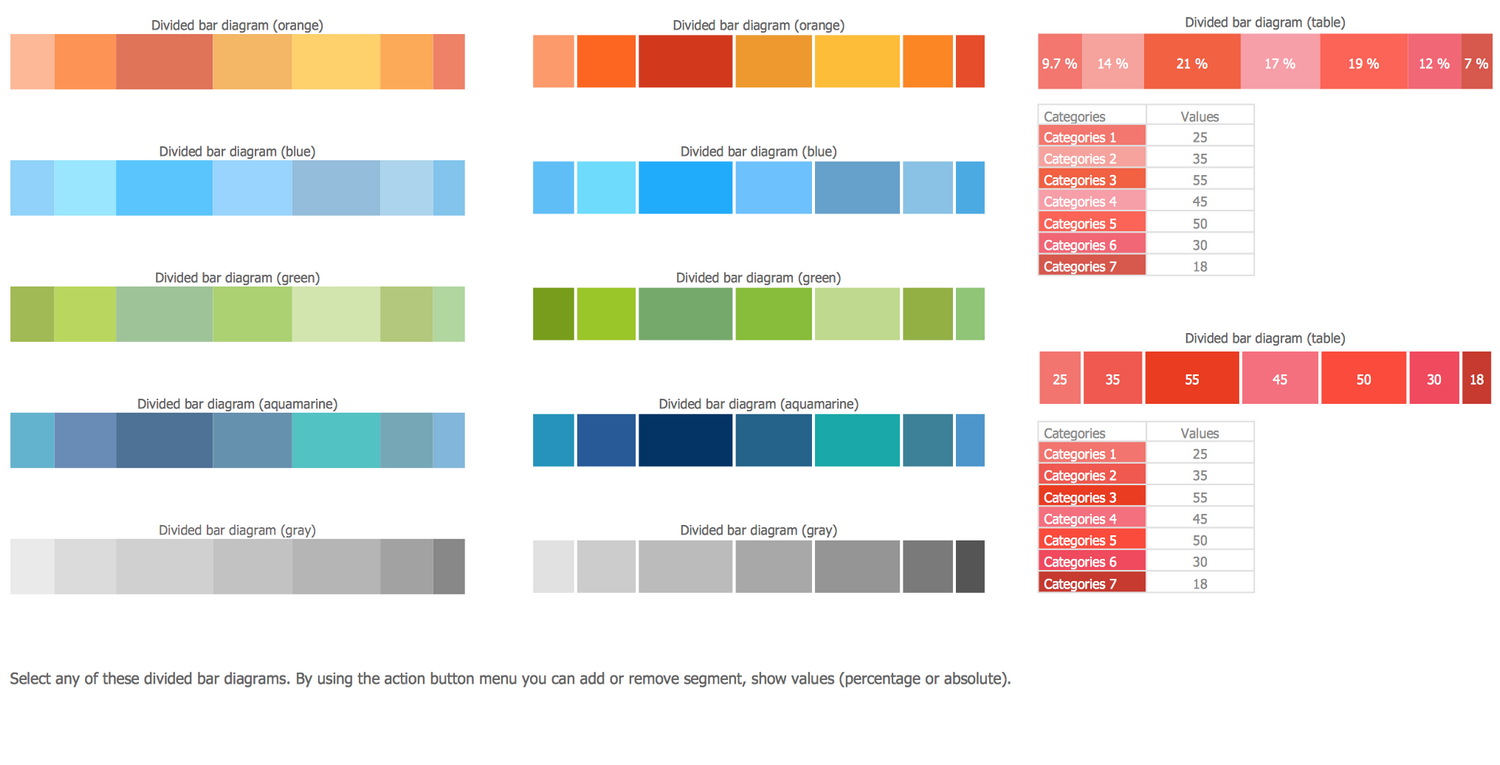
Divided Bar Diagrams Solution
A divided bar graph is a rectangle divided into smaller rectangles along its length in proportion to the data. Divided bars are used for visual representation of numerical data.
There is 1 library containing 10 vector objects and 6 examples in the Divided Bar Diagrams solution.
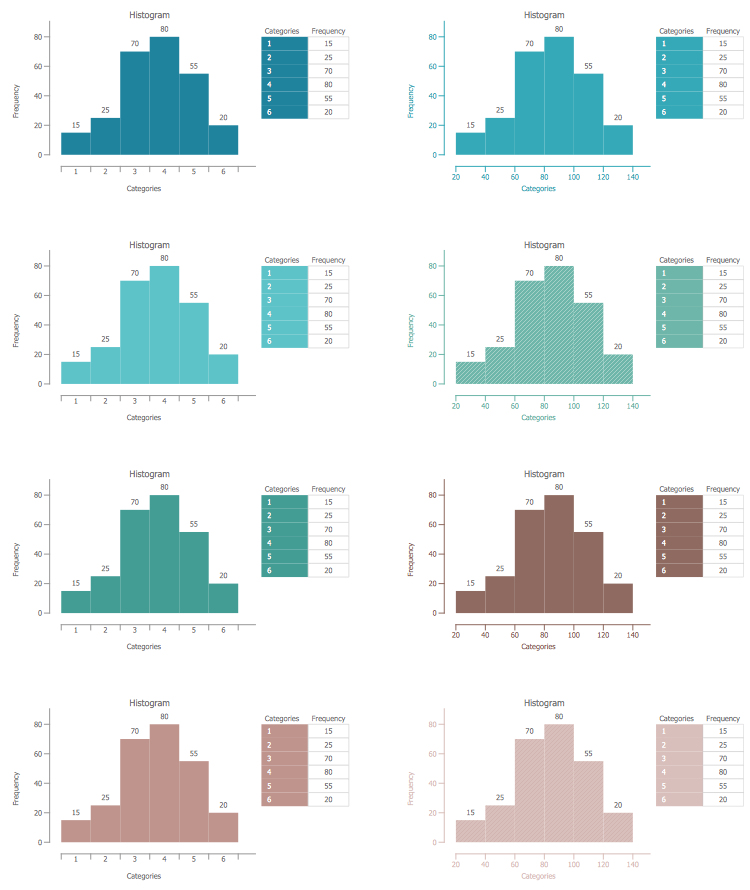
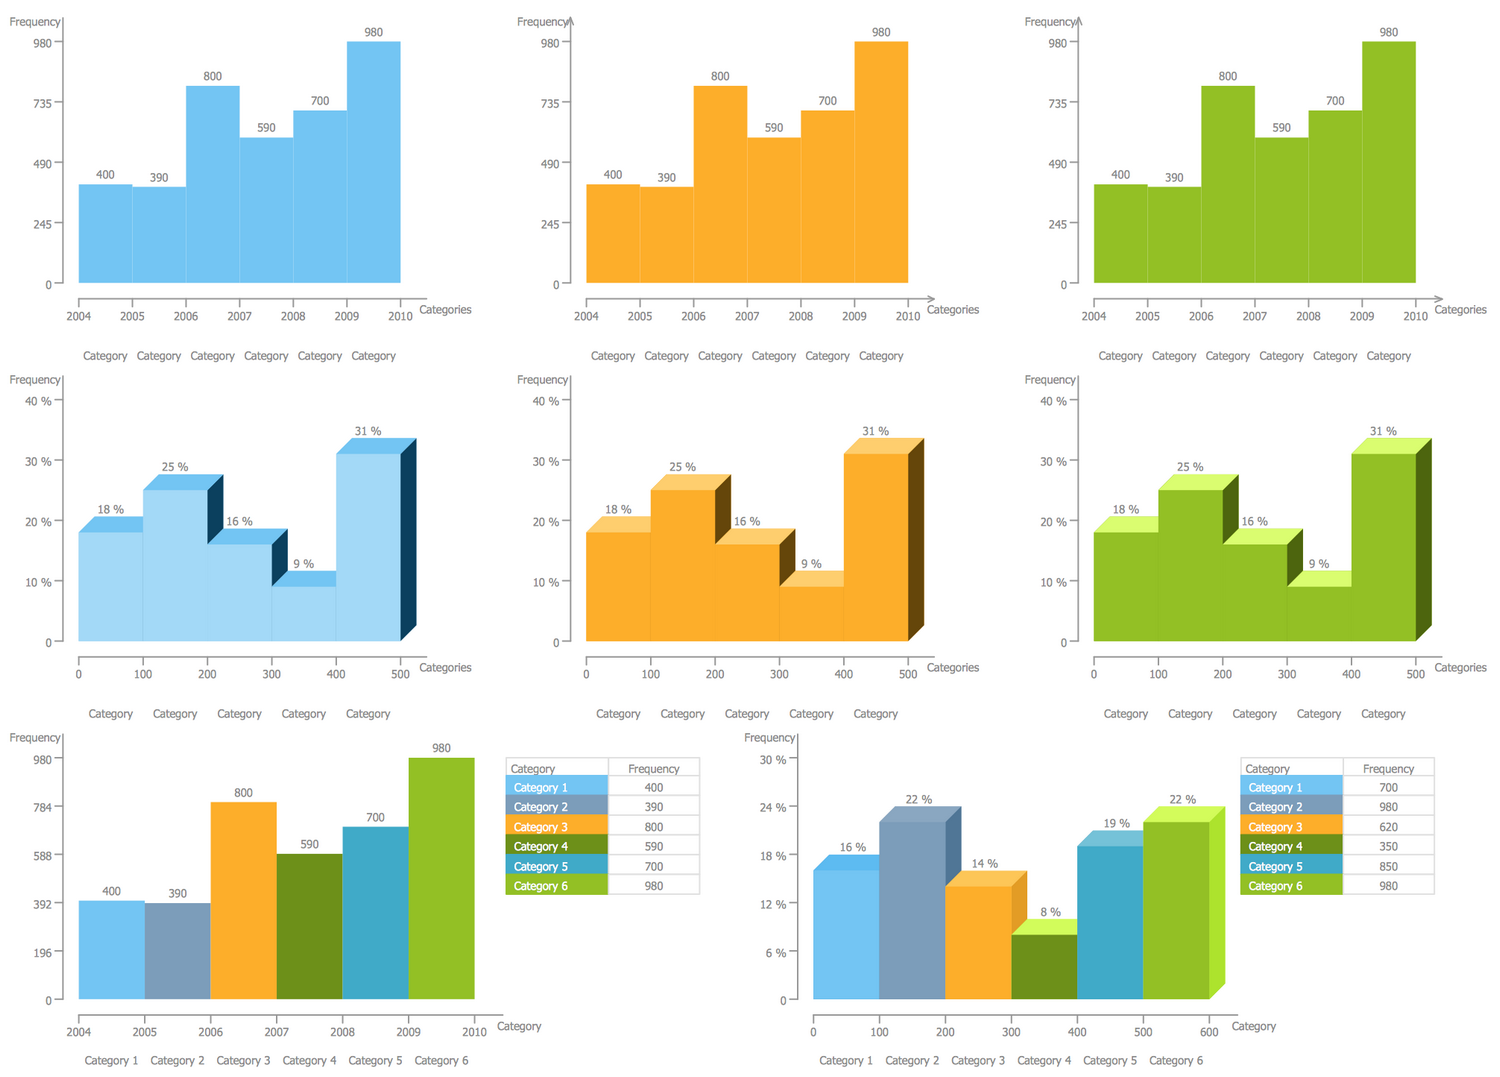
Histograms Solution
A histogram is useful if you need to represent data broken into intervals. A histogram is drawn with rectangles (3-d blocks, cylinders etc) side-by-side with the area of each rectangle being proportional to the frequency of the observations that fall into that corresponding interval. They are often used to plot data that spans several periods (days, weeks, months, years).
There is 1 library containing 8 vector objects and 8 examples in the Histograms solution.
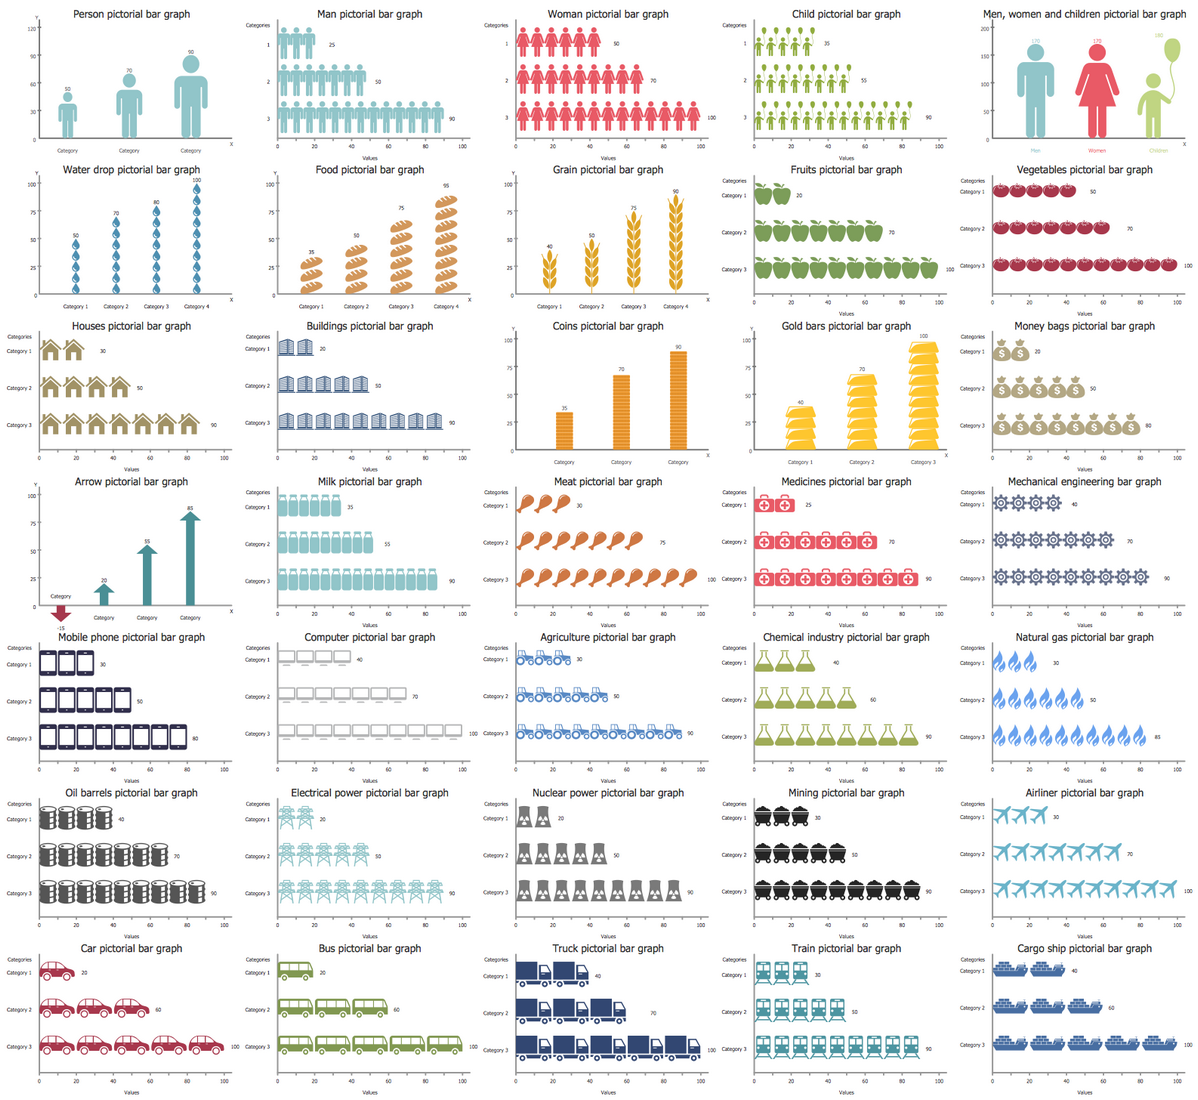
Picture Graphs Solution
Pictures and icons can be used to emphasise the information displayed on a bar chart. For instance, you can use coins and banknotes to represent finance, or people icons for population comparison - this is catered for within the solution.
There is 1 library containing 35 vector objects and 11 examples in the Picture Graphss solution.
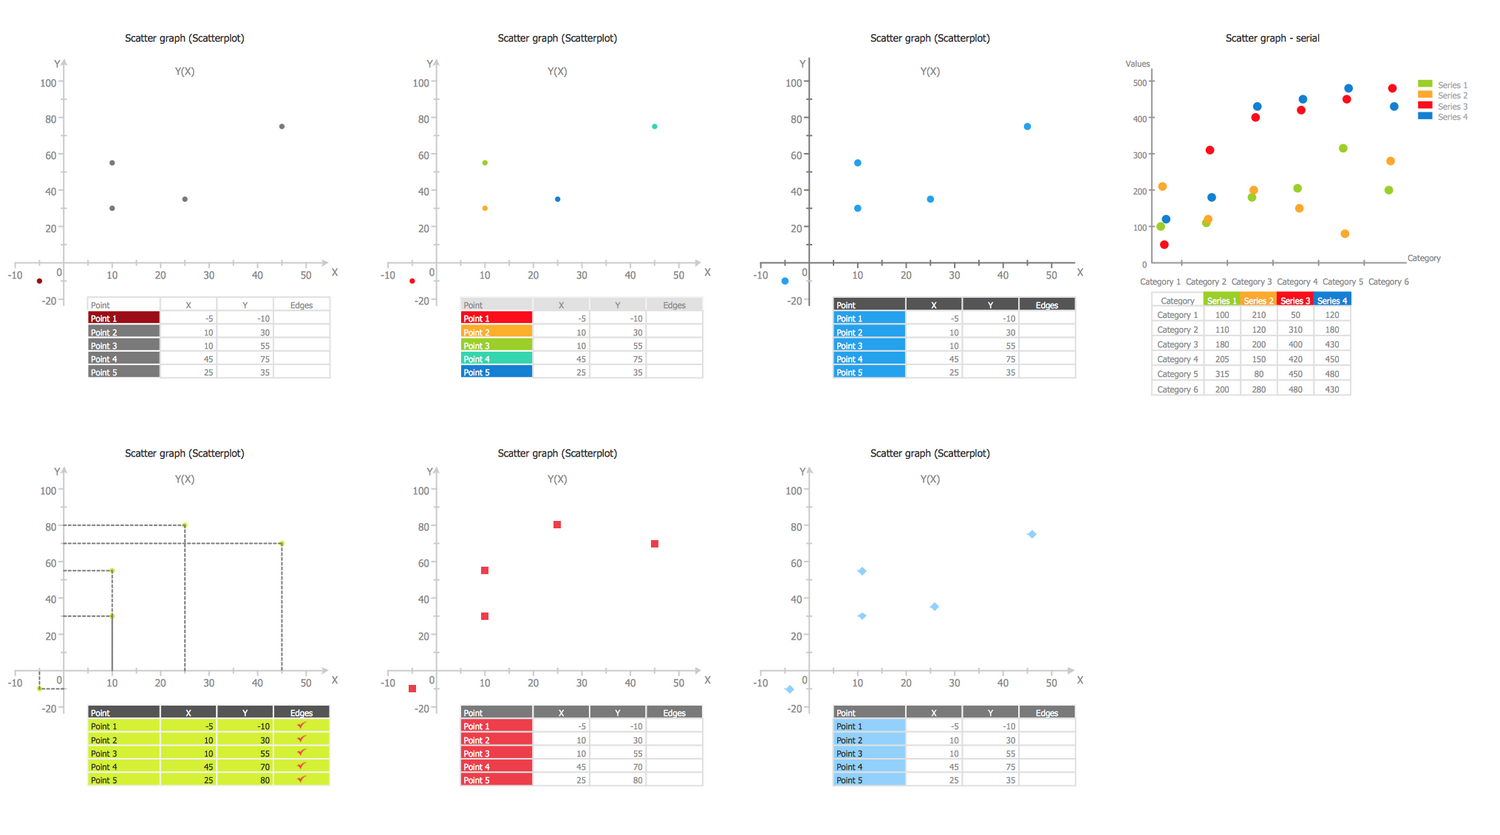
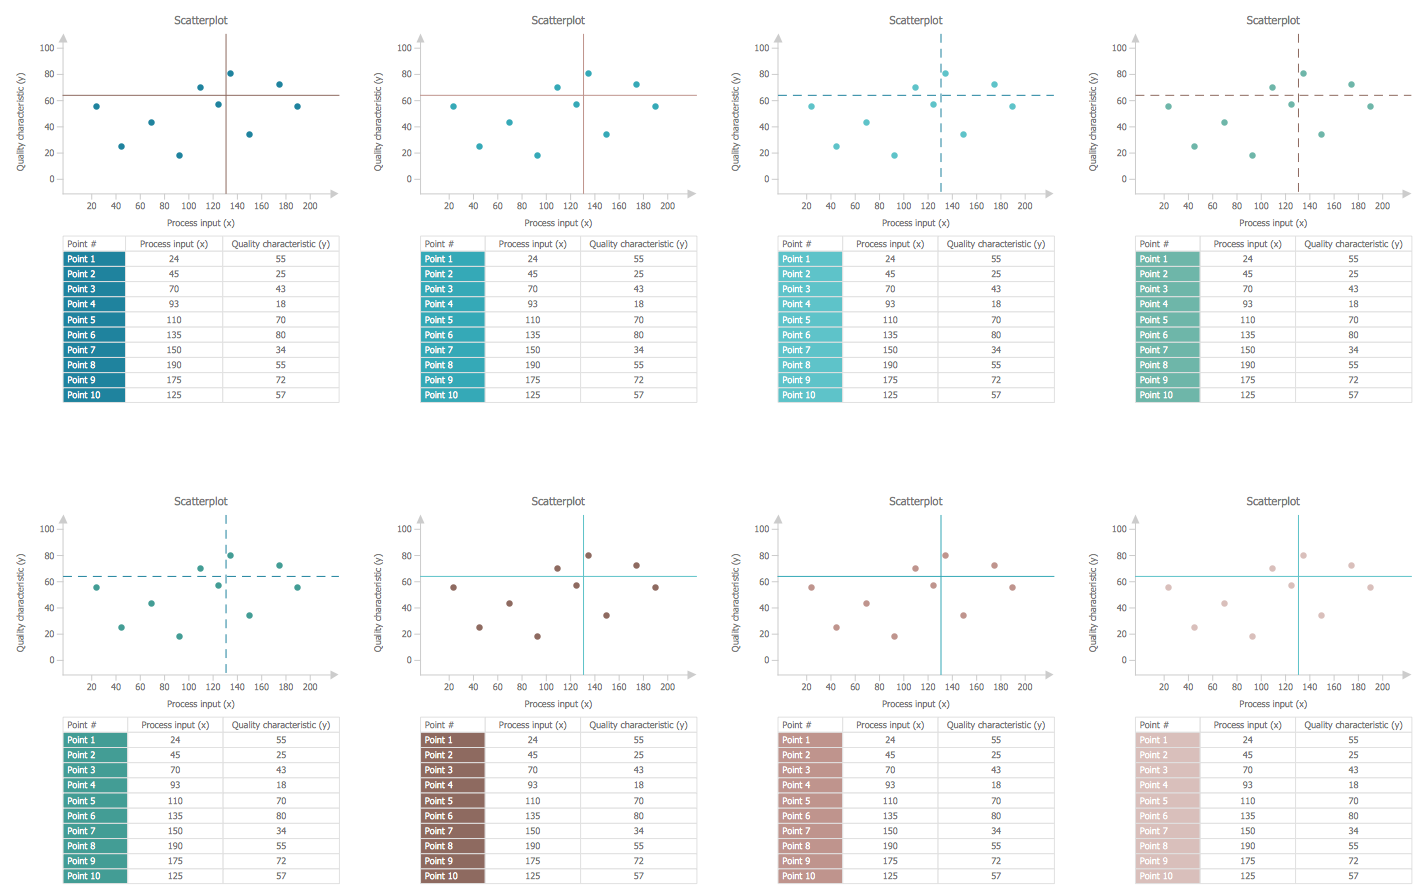
Scatter Diagrams Solution
A scatter diagram displays data sets as a collection of points, with Cartesian coordinates determined by the values for two variables. Use it to identify potential linear and nonlinear relationships between variables. This solution helps you create diagrams that visualize how a change in one variable affects another.
There is 1 library containing 7 vector objects and 9 examples in the Scatter Diagrams solution.