- Electric and Telecom Plans Free
- Fire and Emergency Plans Free
- Floor Plans Free
- Plant Layout Plans Free
- School and Training Plans Free
- Seating Plans Free
- Security and Access Plans Free
- Site Plans Free
- Sport Field Plans Free
- Business Process Diagrams Free
- Business Process Mapping Free
- Classic Business Process Modeling Free
- Cross-Functional Flowcharts Free
- Event-driven Process Chain Diagrams Free
- IDEF Business Process Diagrams Free
- Logistics Flow Charts Free
- Workflow Diagrams Free
- Logistic Dashboard $49
- ConceptDraw Dashboard for Facebook Free
- Mind Map Exchange Free
- MindTweet Free
- Note Exchange Free
- Project Exchange Free
- Social Media Response Free
- Active Directory Diagrams Free
- AWS Architecture Diagrams Free
- Azure Architecture Free
- Cisco Network Diagrams Free
- Cisco Networking Free
- Cloud Computing Diagrams Free
- Computer Network Diagrams Free
- Google Cloud Platform Free
- Interactive Voice Response Diagrams Free
- Network Layout Floor Plans Free
- Network Security Diagrams Free
- Rack Diagrams Free
- Telecommunication Network Diagrams Free
- Vehicular Networking Free
- Wireless Networks Free
- Comparison Dashboard Free
- Composition Dashboard Free
- Correlation Dashboard Free
- Frequency Distribution Dashboard Free
- Meter Dashboard Free
- Spatial Dashboard Free
- Status Dashboard Free
- Time Series Dashboard Free
- Basic Circle-Spoke Diagrams Free
- Basic Circular Arrows Diagrams Free
- Basic Venn Diagrams Free
- Block Diagrams Free
- Concept Maps Free
- Family Tree Free
- Flowcharts Free
- Basic Area Charts Free
- Basic Bar Graphs Free
- Basic Divided Bar Diagrams Free
- Basic Histograms Free
- Basic Line Graphs Free
- Basic Picture Graphs Free
- Basic Pie Charts Free
- Basic Scatter Diagrams Free
- Aerospace and Transport Free
- Artwork Free
- Audio, Video, Media Free
- Business and Finance Free
- Computers and Communications Free
- Holiday Free
- Manufacturing and Maintenance Free
- Nature Free
- People Free
- Presentation Clipart Free
- Safety and Security Free
- Analog Electronics Free
- Audio and Video Connectors Free
- Basic Circuit Diagrams Free
- Chemical and Process Engineering Free
- Digital Electronics Free
- Electrical Engineering Free
- Electron Tube Circuits Free
- Electronic Block Diagrams Free
- Fault Tree Analysis Diagrams Free
- GHS Hazard Pictograms Free
- Home Automation and Wiring Free
- Mechanical Engineering Free
- One-line Diagrams Free
- Power Сircuits Free
- Specification and Description Language (SDL) Free
- Telecom and AV Circuits Free
- Transport Hazard Pictograms Free
- Data-driven Infographics Free
- Pictorial Infographics Free
- Spatial Infographics Free
- Typography Infographics Free
- Calendars Free
- Decision Making Free
- Enterprise Architecture Diagrams Free
- Fishbone Diagrams Free
- Organizational Charts Free
- Plan-Do-Check-Act (PDCA) Free
- Seven Management and Planning Tools Free
- SWOT and TOWS Matrix Diagrams Free
- Timeline Diagrams Free
- Australia Map Free
- Continent Maps Free
- Directional Maps Free
- Germany Map Free
- Metro Map Free
- UK Map Free
- USA Maps Free
- Customer Journey Mapping Free
- Marketing Diagrams Free
- Matrices Free
- Pyramid Diagrams Free
- Sales Dashboard Free
- Sales Flowcharts Free
- Target and Circular Diagrams Free
- Cash Flow Reports Free
- Current Activities Reports Free
- Custom Excel Report Free
- Knowledge Reports Free
- MINDMAP Reports Free
- Overview Reports Free
- PM Agile Free
- PM Dashboards Free
- PM Docs Free
- PM Easy Free
- PM Meetings Free
- PM Planning Free
- PM Presentations Free
- PM Response Free
- Resource Usage Reports Free
- Visual Reports Free
- House of Quality Free
- Quality Mind Map Free
- Total Quality Management TQM Diagrams Free
- Value Stream Mapping Free
- Astronomy Free
- Biology Free
- Chemistry Free
- Language Learning Free
- Mathematics Free
- Physics Free
- Piano Sheet Music Free
- Android User Interface Free
- Class Hierarchy Tree Free
- Data Flow Diagrams (DFD) Free
- DOM Tree Free
- Entity-Relationship Diagram (ERD) Free
- EXPRESS-G data Modeling Diagram Free
- IDEF0 Diagrams Free
- iPhone User Interface Free
- Jackson Structured Programming (JSP) Diagrams Free
- macOS User Interface Free
- Object-Role Modeling (ORM) Diagrams Free
- Rapid UML Free
- SYSML Free
- Website Wireframe Free
- Windows 10 User Interface Free
Logistic Dashboard
Logistics is the unified chain of interrelated processes and actions in order to ensure effective and efficient promotion of products and services from the supplier to the end consumer, and to increase the competitiveness within a company and outside it. For administration the logistics system and for management logistics processes in a company is applied the logistics management. It includes the processes of management the information support, document and goods turnover, logistics infrastructure and logistic costs, the management of customer service, the maintaining of corporate strategy with optimal resources costs, and ensuring the system stability of a given enterprise on the market.
The logistics management ensures the accurate accounting of time and production factors with aim to improve the management of financial, informational, internal and external material flows and processes. It has the great importance for any enterprise, but at the same time the logistics strategy of each company is unique. Wide range of different methods and techniques, as well as their combinations are used at the conducting the logistic analysis in companies. The logistics managers and other logistics specialists in the company constantly need to analyze in effective and convenient way the results of management decisions that affect the level of total costs, revenues, profitability and other result indicators of the company. For control and analysis the logistics processes are successfully used the graphs, charts and dashboards of various types.
The Logistic Dashboard solution enhances the ConceptDraw DIAGRAM functionality with powerful tools and specially developed live graphic objects of logistic icons, logistic navigation elements, logistic indicators, logistic charts and logistic maps for improbably easy and fast designing Logistic dashboards, Logistic maps, Logistic charts, diagrams and infographics. The rich set of prebuilt samples and quick-start templates, included to the Logistic Dashboard solution demonstrates the power of ConceptDraw DIAGRAM software in logistics management, its assisting abilities in development, realization and analyzing the logistic processes, and in perfection the methods of logistics management.
-
Buy this solution $49 -
Solution Requirements - This solution requires the following products to be installed:
ConceptDraw DIAGRAM v18 - This solution requires the following products to be installed:
-
Compatibility - Sonoma (14), Sonoma (15)
MS Windows 10, 11 - Sonoma (14), Sonoma (15)
-
Support for this Solution -
Helpdesk
There are 5 stencil libraries containing 180 vector objects in the Logistic Dashboard solution.
Design Elements — Logistic Icons

Design Elements — Logistic Charts

Design Elements — Logistic Indicators

Logistic Dashboard Examples
There are a few samples that you see on this page which were created in the ConceptDraw DIAGRAM application by using the Logistic Dashboard solution. Some of the solution's capabilities as well as the professional results which you can achieve are all demonstrated here on this page.
All source documents are vector graphic documents which are always available for modifying, reviewing and/or converting to many different formats, such as MS PowerPoint, PDF file, MS Visio, and many other graphic ones from the ConceptDraw Solution Park or ConceptDraw STORE. The Logistic Dashboard solution is available to all ConceptDraw DIAGRAM users to get installed and used while working in the ConceptDraw DIAGRAM diagramming and drawing software.
Template 1: Performance Dynamics Dashboard
Use the Action menus to connect the data source files to live objects on this template with aim to display actual information. You can also apply other useful commands from the Action menu and make desired settings for each live object on this Inventory Performance Dynamics Dashboard, even own for each.

Example 1: Inventory Performance Dynamics Dashboard
This diagram was created in ConceptDraw DIAGRAM using the libraries from the Logistic Dashboard Solution. An experienced user spent 15 minutes creating this sample.
This example displays the Inventory Performance Dynamics Dashboard that is useful for representing and analysis the dynamics of changes in business metrics and key performance indicators (KPIs) of inventory management in last 12 months. The changes of KPIs are visually illustrated with help of Column Chart live objects from the Logistic Charts library of Logistic Dashboard solution.

Example 2: Logistics and Supply Chain Dashboard
This diagram was created in ConceptDraw DIAGRAM using the libraries from the Logistic Dashboard Solution. An experienced user spent 10 minutes creating this sample.
The dashboards are powerful, user-friendly and additionally beautiful tools that allow laconically represent statistical data. This example illustrates the dashboard, which unites 5 Line Chart graphic elements reflecting the changes of logistic metrics and key performance indicators for the company for last 6 months (May, Jun, Jul, Aug, Sep, Oct). The use of ready-made infographics elements and logistic icons makes your dashboards brighter and more interesting.

Example 3: Logistics KPI Dashboard
This diagram was created in ConceptDraw DIAGRAM using the libraries from the Logistic Dashboard Solution. An experienced user spent 15 minutes creating this sample.
This sample demonstrates the three-page Logistics KPI Dashboard, each page displays a separate company division: Mobile Division, Computer Division, Network Division. The use of live statistical graphic objects offered by Logistic Dashboard Solution lets design the dashboards of any complexity in minutes. The dimensions of all logistic objects and fonts of labels on the graphs can be modified to suit your desires.

Example 4: Logistics Performance Dashboard
This diagram was created in ConceptDraw DIAGRAM using the libraries from the Logistic Dashboard Solution. An experienced user spent 10 minutes creating this sample.
The use of dashboards has many advantages, they allow to reduce the enormous amount of data to one page with summary results, that gives for managers more accurate and faster understanding of current situation, lets easily compare results with each other, perform and allocate more priority indicators. This example illustrates Logistics Performance Dashboard and consists of two pages: Transportation KPIs and Warehouse KPIs.

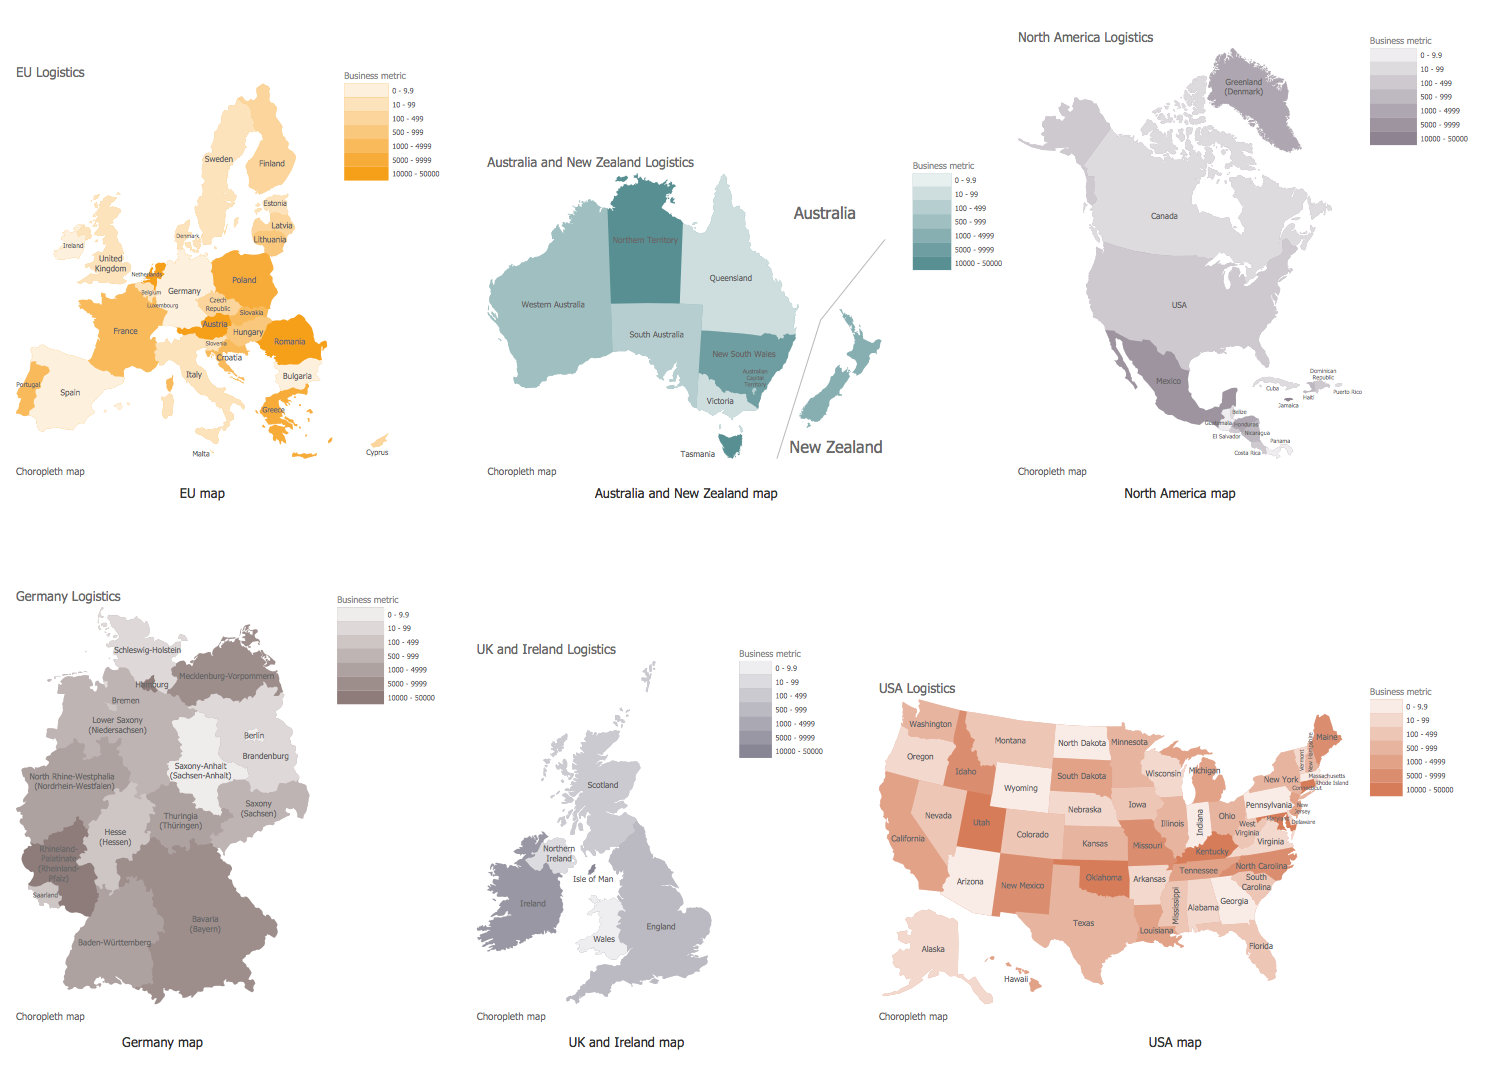
Example 5: Total Logistics Costs by Countries
This diagram was created in ConceptDraw DIAGRAM using the libraries from the Logistic Dashboard Solution. An experienced user spent 10 minutes creating this sample.
This Total Logistics Costs by Countries sample is represented as a two-page dashboard. Each page contains the map showing the levels of KPI for different countries, for European Union on the first page and for North America on the second. There are 6 levels: up to 7%; 8-9%; 10-11%; 12-13%; 14-15%; 16% and more. The data used by the live object are taken from the connected data source Excel file. If necessary, you can always assign another source file in one click, the data will be automatically updated on your dashboard.

Template 2: Logistics and Supply Chain Dashboard
The ready template helps to display the information and data that you have and which you want to share with your colleagues and other stakeholders. Besides, if you need you can always replace the existing graphics on some others or add more graphics from our libraries of ready vector logistics objects.

Template 3: Logistics KPI Dashboard
Striving to facilitate the drawing of various Logistic dashboards and charts, ConceptDraw DIAGRAM software offers the set of quick-start logistic templates. This template is one of them, it supposes the simple connection of data source files to live objects to make the excellent Logistics KPI Dashboard in seconds.

Template 4: Logistics Performance Dashboard
The ready template is the best start of drawing any diagrams, charts and maps. The logistic dashboards, logistic maps and logistic infographics are not exception. To get the excellent result, simply start from this logistic dashboard template and modify it in accordance with logistics processes at your company.

Template 5: Total Logistics Costs by Countries
This template was created to show the total logistics costs for different countries. At your desire, you can use this template to illustrate some other logistics data and information. Easily add additional pages to this multipage Logistic Dashboard to represent the data for larger quantity of countries.

More Examples and Templates
Inside


What I Need to Get Started
After ConceptDraw DIAGRAM is installed, the Logistic Dashboard solution can be purchased either from the Business Processes area of ConceptDraw STORE itself or from our online store. Thus, you will be able to use the Logistic Dashboard solution straight after.

How to install
First of all, make sure that both ConceptDraw STORE and ConceptDraw DIAGRAM applications are downloaded and installed on your computer. Next, install the Logistic Dashboard solution from the ConceptDraw STORE to use it in the ConceptDraw DIAGRAM application.

Start using
Start using the Logistic Dashboard solution to make the professionally looking business processes diagrams by adding the design elements taken from the stencil libraries and editing the pre-made examples that can be found there.
