- Electric and Telecom Plans Free
- Fire and Emergency Plans Free
- Floor Plans Free
- Plant Layout Plans Free
- School and Training Plans Free
- Seating Plans Free
- Security and Access Plans Free
- Site Plans Free
- Sport Field Plans Free
- Business Process Diagrams Free
- Business Process Mapping Free
- Classic Business Process Modeling Free
- Cross-Functional Flowcharts Free
- Event-driven Process Chain Diagrams Free
- IDEF Business Process Diagrams Free
- Logistics Flow Charts Free
- Workflow Diagrams Free
- ConceptDraw Dashboard for Facebook Free
- Mind Map Exchange Free
- MindTweet Free
- Note Exchange Free
- Project Exchange Free
- Social Media Response Free
- Active Directory Diagrams Free
- AWS Architecture Diagrams Free
- Azure Architecture Free
- Cisco Network Diagrams Free
- Cisco Networking Free
- Cloud Computing Diagrams Free
- Computer Network Diagrams Free
- Google Cloud Platform Free
- Interactive Voice Response Diagrams Free
- Network Layout Floor Plans Free
- Network Security Diagrams Free
- Rack Diagrams Free
- Telecommunication Network Diagrams Free
- Vehicular Networking Free
- Wireless Networks Free
- Comparison Dashboard Free
- Composition Dashboard Free
- Correlation Dashboard Free
- Frequency Distribution Dashboard Free
- Meter Dashboard Free
- Spatial Dashboard Free
- Status Dashboard Free
- Time Series Dashboard Free
- Basic Circle-Spoke Diagrams Free
- Basic Circular Arrows Diagrams Free
- Basic Venn Diagrams Free
- Block Diagrams Free
- Concept Maps Free
- Family Tree Free
- Flowcharts Free
- Basic Area Charts Free
- Basic Bar Graphs Free
- Basic Divided Bar Diagrams Free
- Basic Histograms Free
- Basic Line Graphs Free
- Basic Picture Graphs Free
- Basic Pie Charts Free
- Basic Scatter Diagrams Free
- Aerospace and Transport Free
- Artwork Free
- Audio, Video, Media Free
- Business and Finance Free
- Computers and Communications Free
- Holiday Free
- Manufacturing and Maintenance Free
- Nature Free
- People Free
- Presentation Clipart Free
- Safety and Security Free
- Analog Electronics Free
- Audio and Video Connectors Free
- Basic Circuit Diagrams Free
- Chemical and Process Engineering Free
- Digital Electronics Free
- Electrical Engineering Free
- Electron Tube Circuits Free
- Electronic Block Diagrams Free
- Fault Tree Analysis Diagrams Free
- GHS Hazard Pictograms Free
- Home Automation and Wiring Free
- Mechanical Engineering Free
- One-line Diagrams Free
- Power Сircuits Free
- Specification and Description Language (SDL) Free
- Telecom and AV Circuits Free
- Transport Hazard Pictograms Free
- Data-driven Infographics Free
- Pictorial Infographics Free
- Spatial Infographics Free
- Typography Infographics Free
- Calendars Free
- Decision Making Free
- Enterprise Architecture Diagrams Free
- Fishbone Diagrams Free
- Organizational Charts Free
- Plan-Do-Check-Act (PDCA) Free
- Seven Management and Planning Tools Free
- SWOT and TOWS Matrix Diagrams Free
- Timeline Diagrams Free
- Australia Map Free
- Continent Maps Free
- Directional Maps Free
- Germany Map Free
- Metro Map Free
- UK Map Free
- USA Maps Free
- Customer Journey Mapping Free
- Marketing Diagrams Free
- Matrices Free
- Pyramid Diagrams Free
- Sales Dashboard Free
- Sales Flowcharts Free
- Target and Circular Diagrams Free
- Cash Flow Reports Free
- Current Activities Reports Free
- Custom Excel Report Free
- Knowledge Reports Free
- MINDMAP Reports Free
- Overview Reports Free
- PM Agile Free
- PM Dashboards Free
- PM Docs Free
- PM Easy Free
- PM Meetings Free
- PM Planning Free
- PM Presentations Free
- PM Response Free
- Resource Usage Reports Free
- Visual Reports Free
- House of Quality Free
- Quality Mind Map Free
- Total Quality Management TQM Diagrams Free
- Value Stream Mapping Free
- Astronomy Free
- Biology Free
- Chemistry Free
- Language Learning Free
- Mathematics Free
- Physics Free
- Piano Sheet Music Free
- Android User Interface Free
- Class Hierarchy Tree Free
- Data Flow Diagrams (DFD) Free
- DOM Tree Free
- Entity-Relationship Diagram (ERD) Free
- EXPRESS-G data Modeling Diagram Free
- IDEF0 Diagrams Free
- iPhone User Interface Free
- Jackson Structured Programming (JSP) Diagrams Free
- macOS User Interface Free
- Object-Role Modeling (ORM) Diagrams Free
- Rapid UML Free
- SYSML Free
- Website Wireframe Free
- Windows 10 User Interface Free
Mass Media Infographics
Mass media is an incredibly broad concept, they include all communication tools, which transfer and disseminate information, ideas, concepts from the source to the target public. Mass media play a really important part in our lives and moreover, sometimes it is difficult to imagine daily life without them. Among their key roles are the dissemination of information and education, because the modern world is incredibly rich in information of various kinds and at the same time information is really valuable and in demand. In the meantime, mass media help people to keep pace with the world around them.
Nowadays the media are the most popular tool of marketing, advertising, promotion, motivation, and also play a huge entertaining role. In addition, they are an effective method of impacting the audience, play a significant role in the formation of public relations, views and opinions, and the promotion of certain policies.
There are many types of mass media: traditional media, print media, digital media, electronic broadcasting media, social media, outdoor media, transit media, etc. Whenever you want to watch your favorite movie or the latest, keep track of news, listen to your favorite music, collect information about any event, advertise or promote something you produce, and for many other purposes you address to mass media. Mass media and social media expand your capabilities, allow you to communicate directly with your audience and keep abreast of all current world events giving the information in all fields — social, political, culture, entertainment, science, sports, and many others.
Being a powerful tool for businesses of any direction and sizes, the mass media are based in most on the visual components — illustrations, infographics, video, etc. The attractive content on your websites and social media profiles runs the great advertisements, engages the followers and clients.
Mass Media Infographics solution supplies ConceptDraw DIAGRAM with professional drawing tools for designing great mass media content, mass media infographics, diagrams, illustrations, schematics, and presentation slides. It also contains high-quality vector stencils libraries, mass media and social media infographic samples for fast and convenient creation of impressive graphic documents. This solution will be useful for media people, bloggers, journalists, professionals and students in the field of mass communication, specialists in social media marketing, social media management, digital media marketing, broadcasting, publishing, and online advertising. Easily design the magnificent mass media infographics in ConceptDraw DIAGRAM and interact effectively with your target audience through social platforms like Facebook, Instagram, Twitter, Pinterest, etc. Share the great content created with Mass Media Infographics solution on websites and social media sites, take likes and get into the top in media charts!
-
Buy this solution $25 -
Solution Requirements - This solution requires the following products to be installed:
ConceptDraw DIAGRAM v18 - This solution requires the following products to be installed:
-
Compatibility - Sonoma (14), Sonoma (15)
MS Windows 10, 11 - Sonoma (14), Sonoma (15)
-
Support for this Solution -
Helpdesk
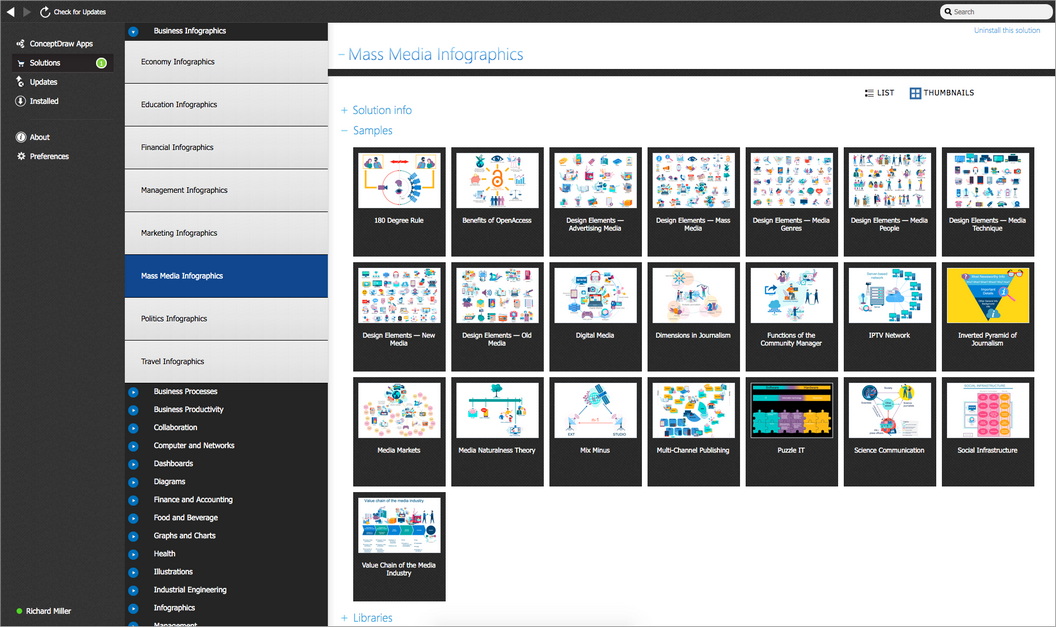
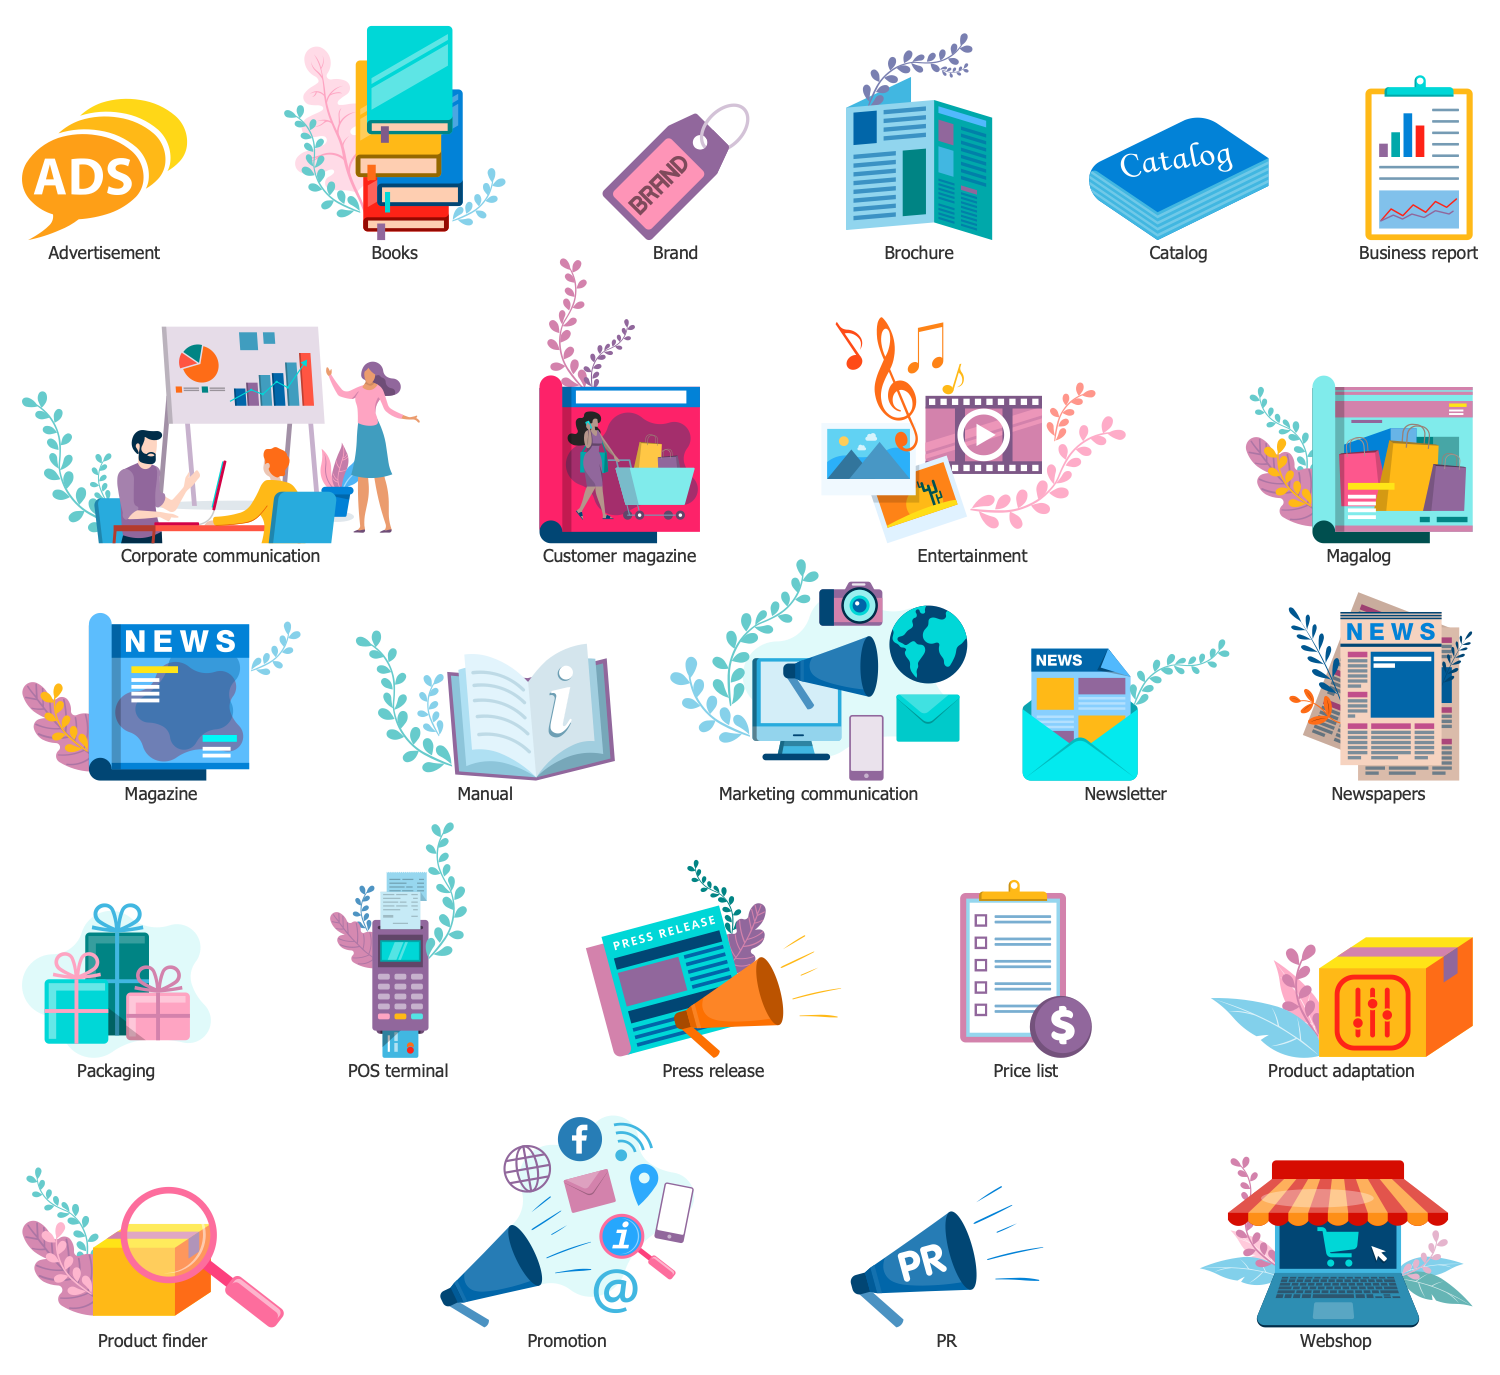
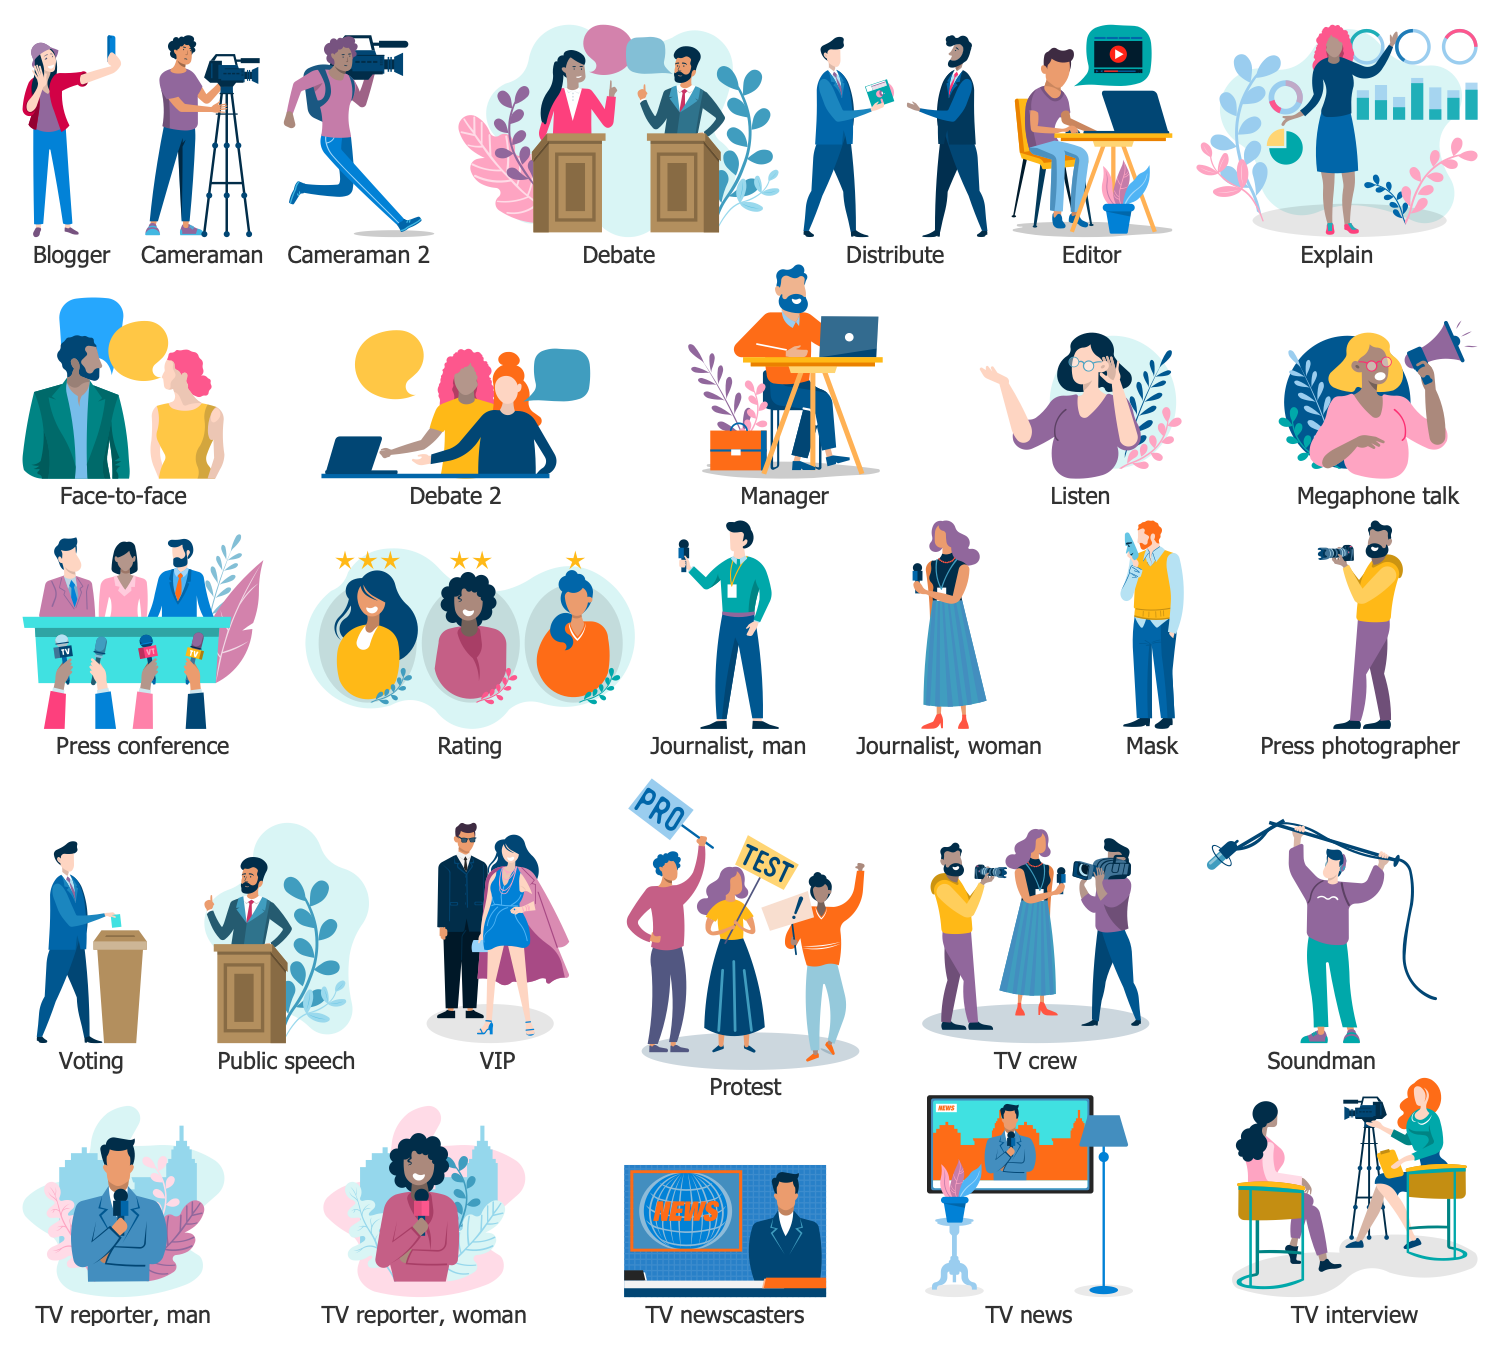
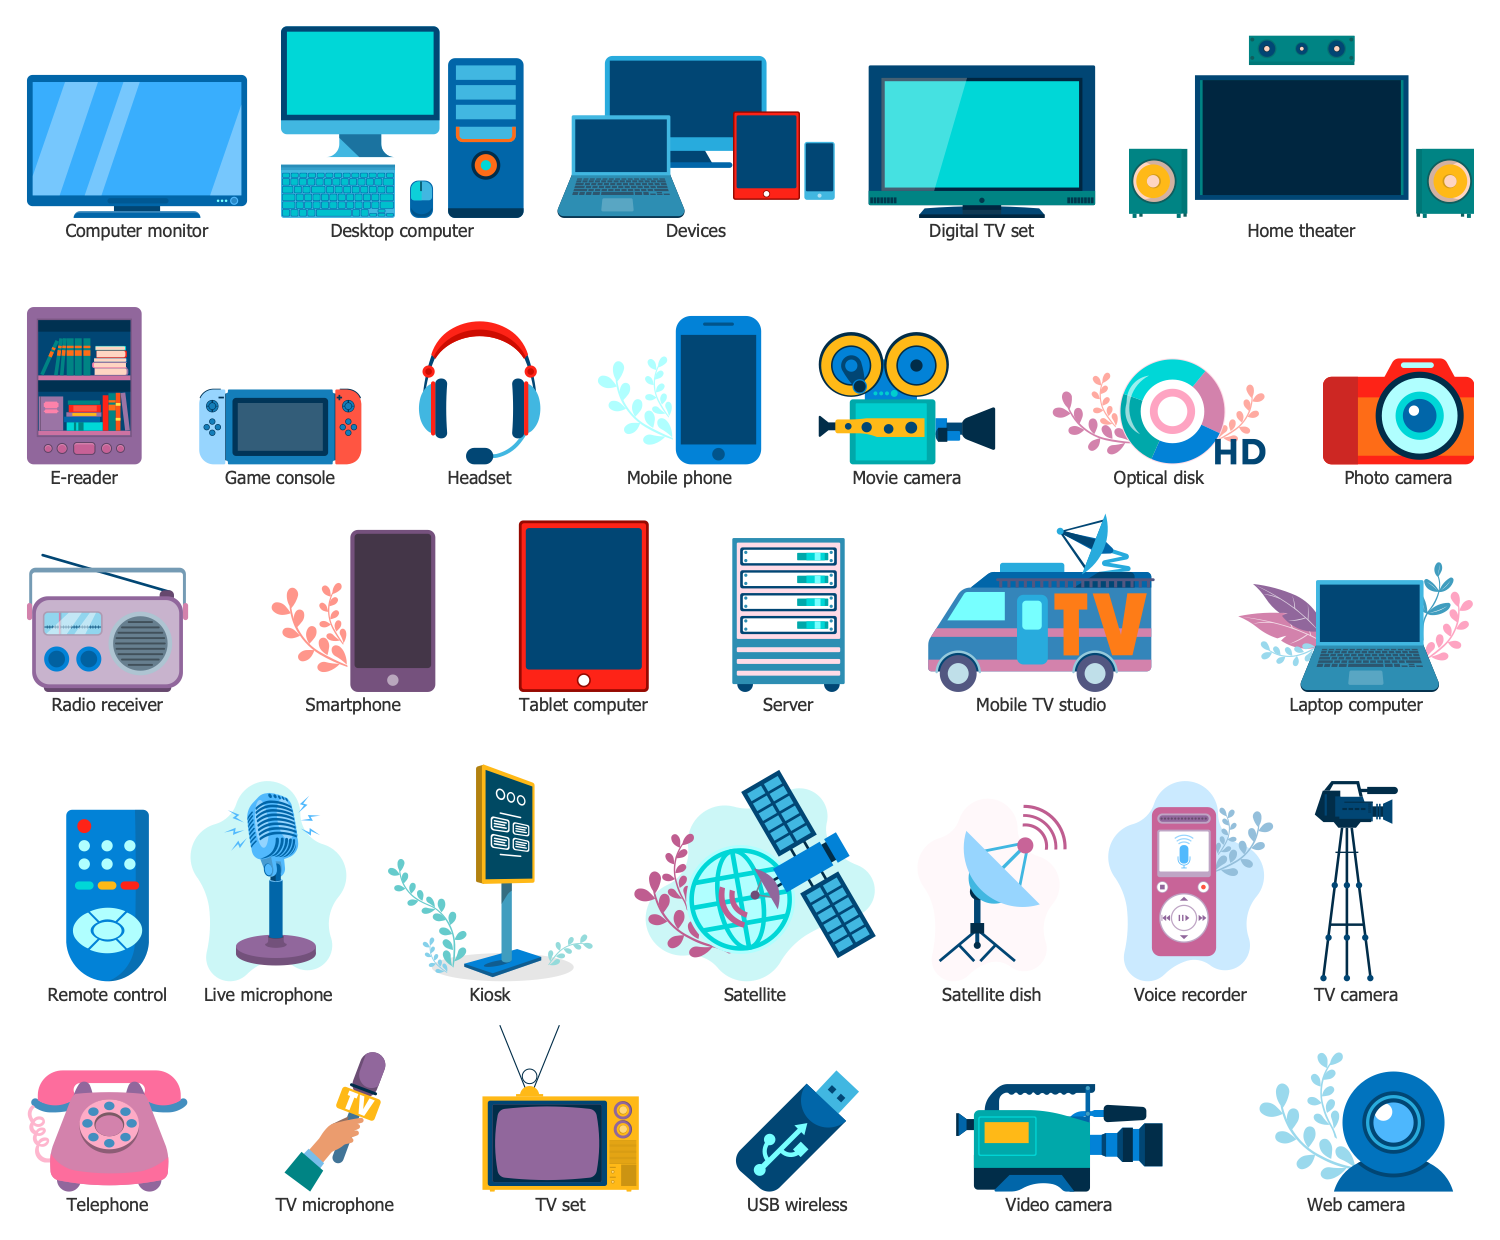
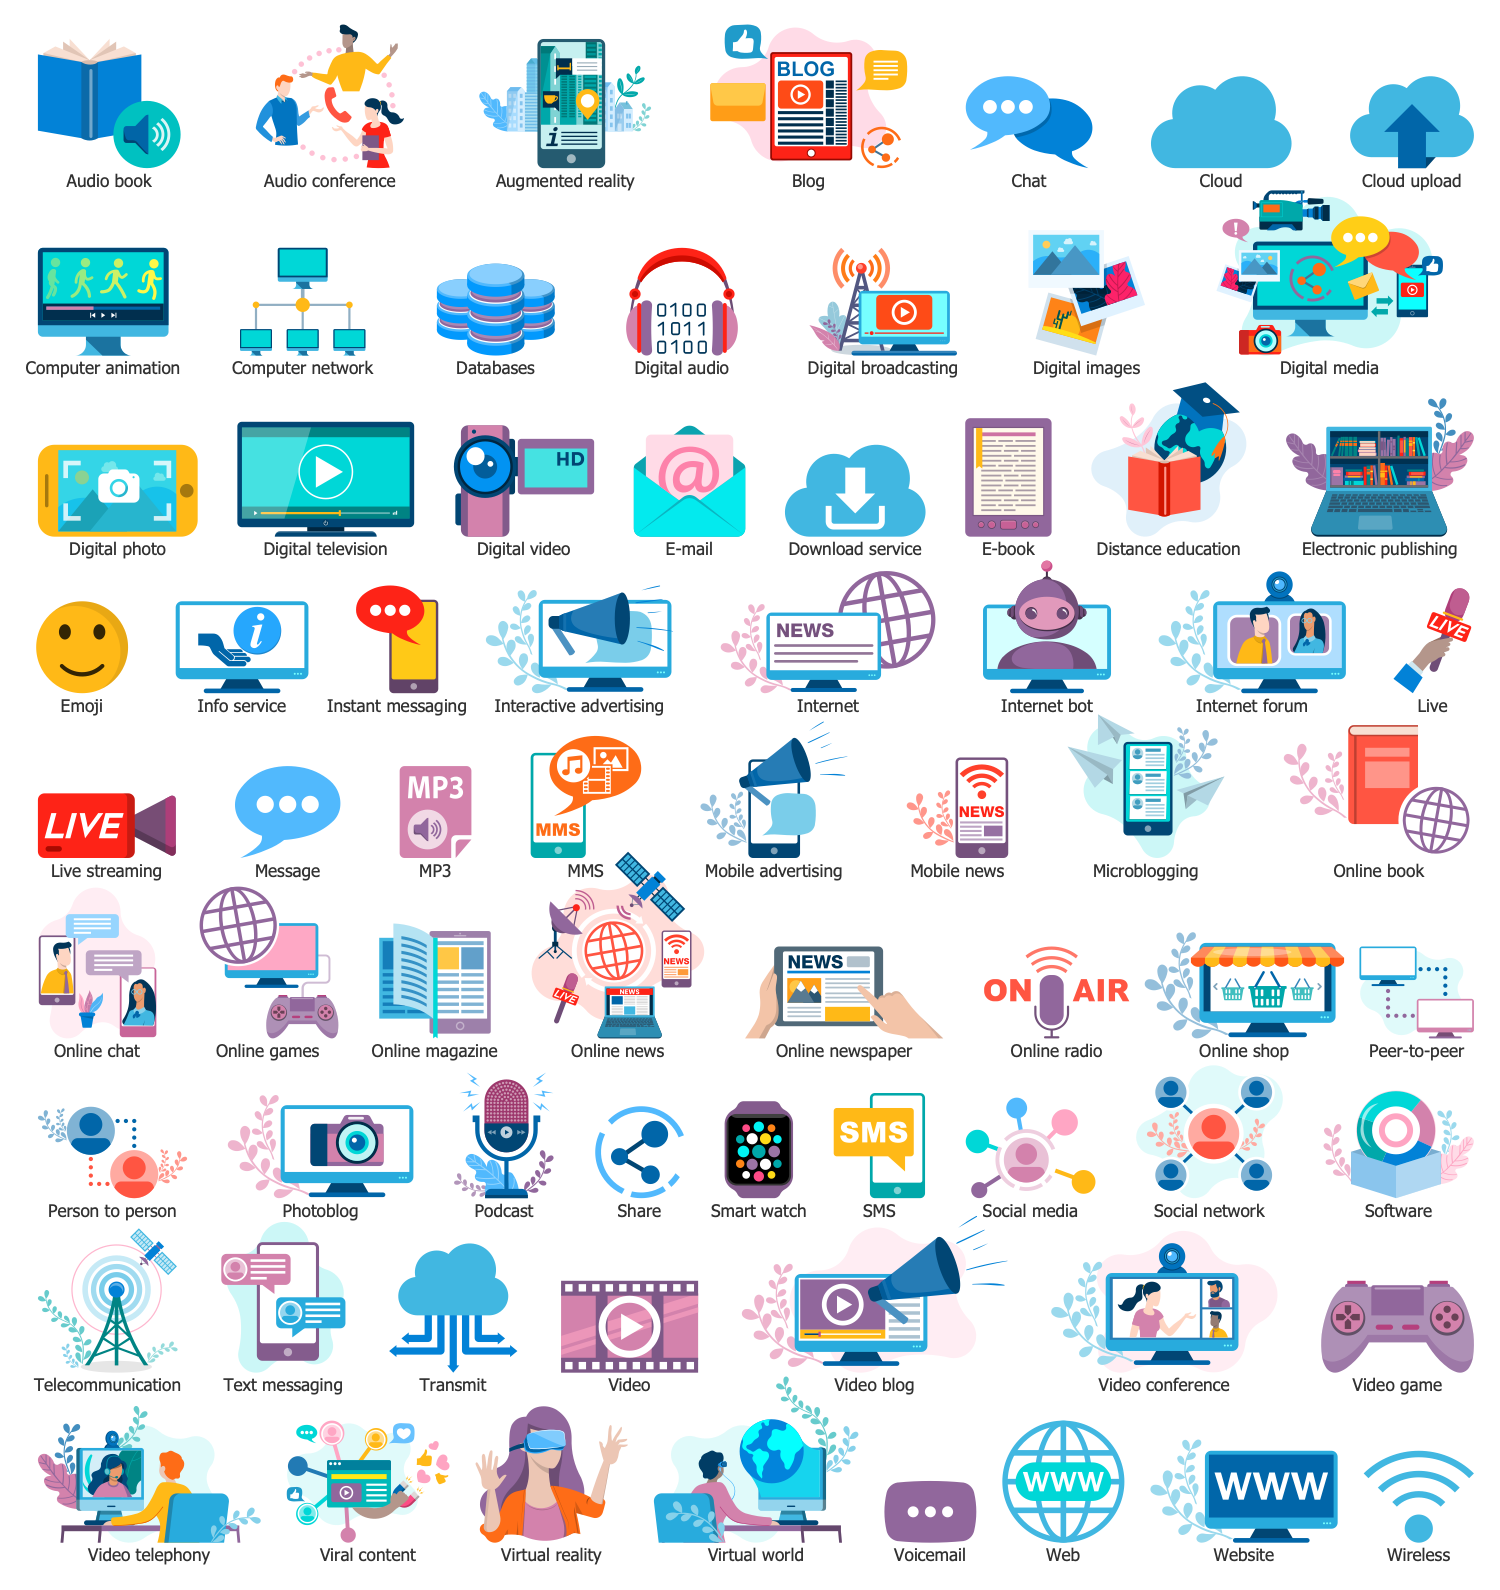
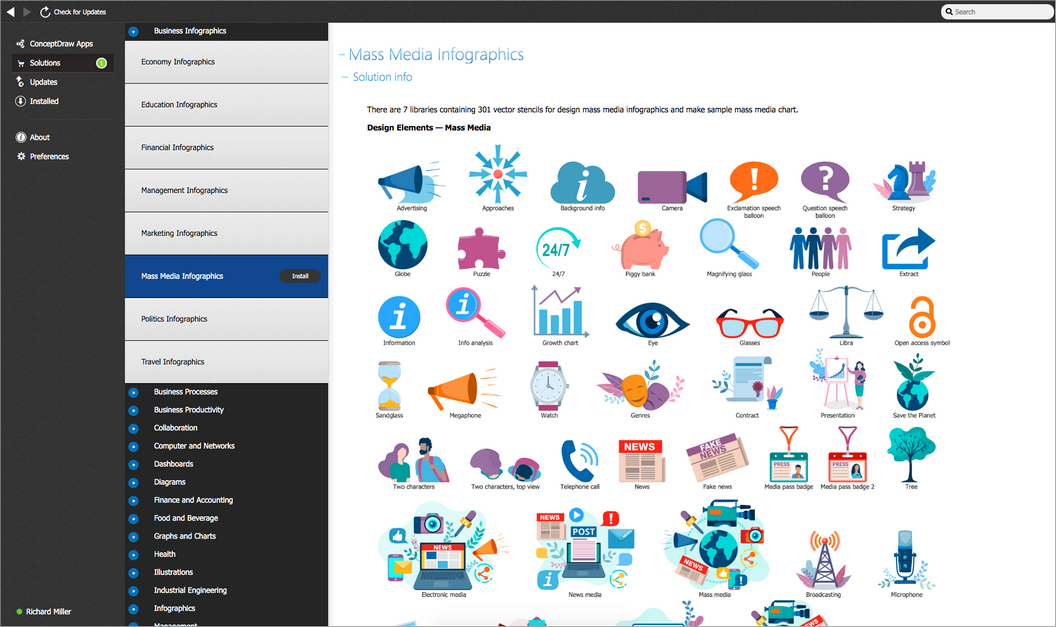
There are 15 examples and 7 libraries containing 301 vector stencils for design mass media infographics and make sample mass media chart.
Design Elements — Mass Media

Design Elements — Advertising Media
Design Elements — Media People
Design Elements — Media Technique
Design Elements — New Media
Design Elements — Old Media

Design Elements — Media Genres
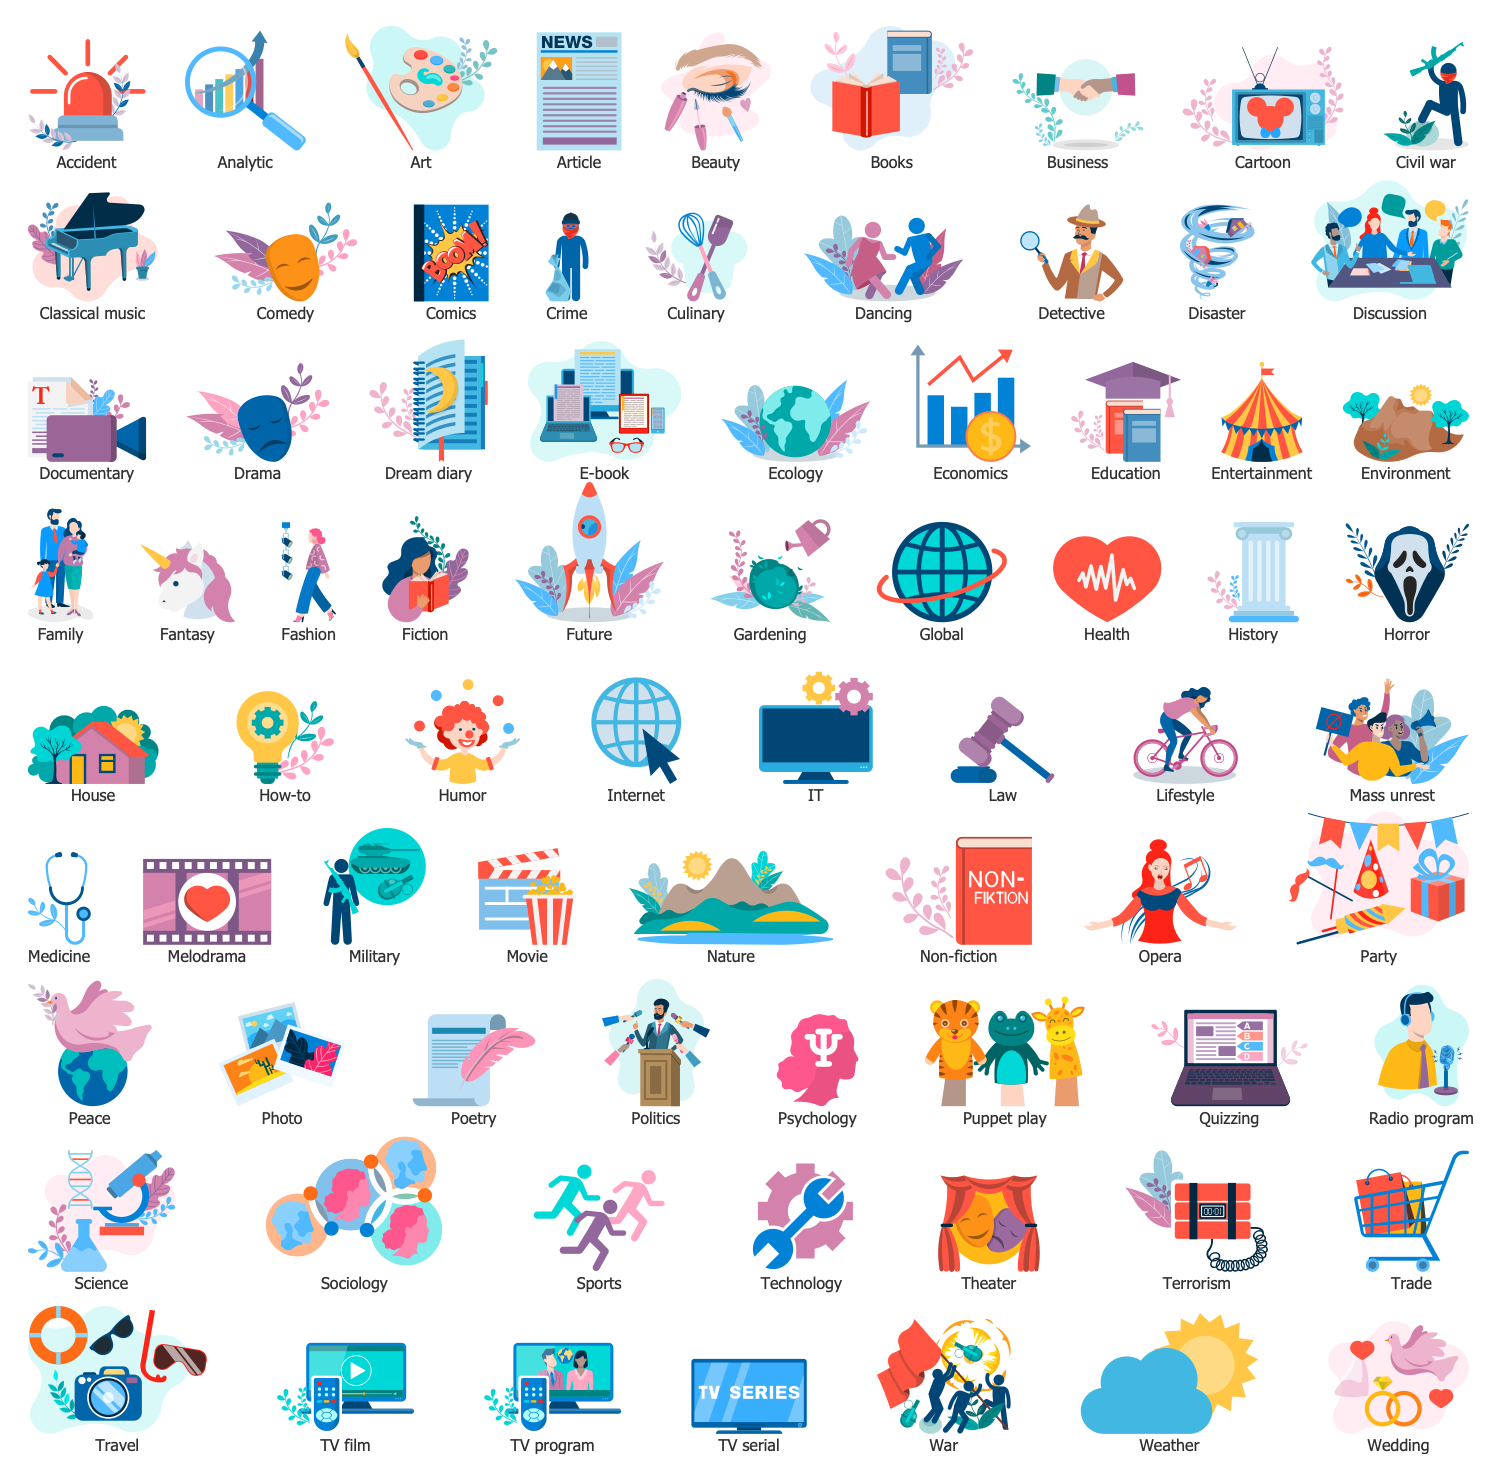
Mass Media Infographics Examples
There are a few samples that you see on this page which were created in the ConceptDraw DIAGRAM application by using the Mass Media Infographics solution. Some of the solution's capabilities as well as the professional results which you can achieve are all demonstrated here on this page.
All source documents are vector graphic documents which are always available for modifying, reviewing and/or converting to many different formats, such as MS PowerPoint, PDF file, MS Visio, and many other graphic ones from the ConceptDraw Solution Park or ConceptDraw STORE. The Mass Media Infographics solution is available to all ConceptDraw DIAGRAM users to get installed and used while working in the ConceptDraw DIAGRAM drawing software.
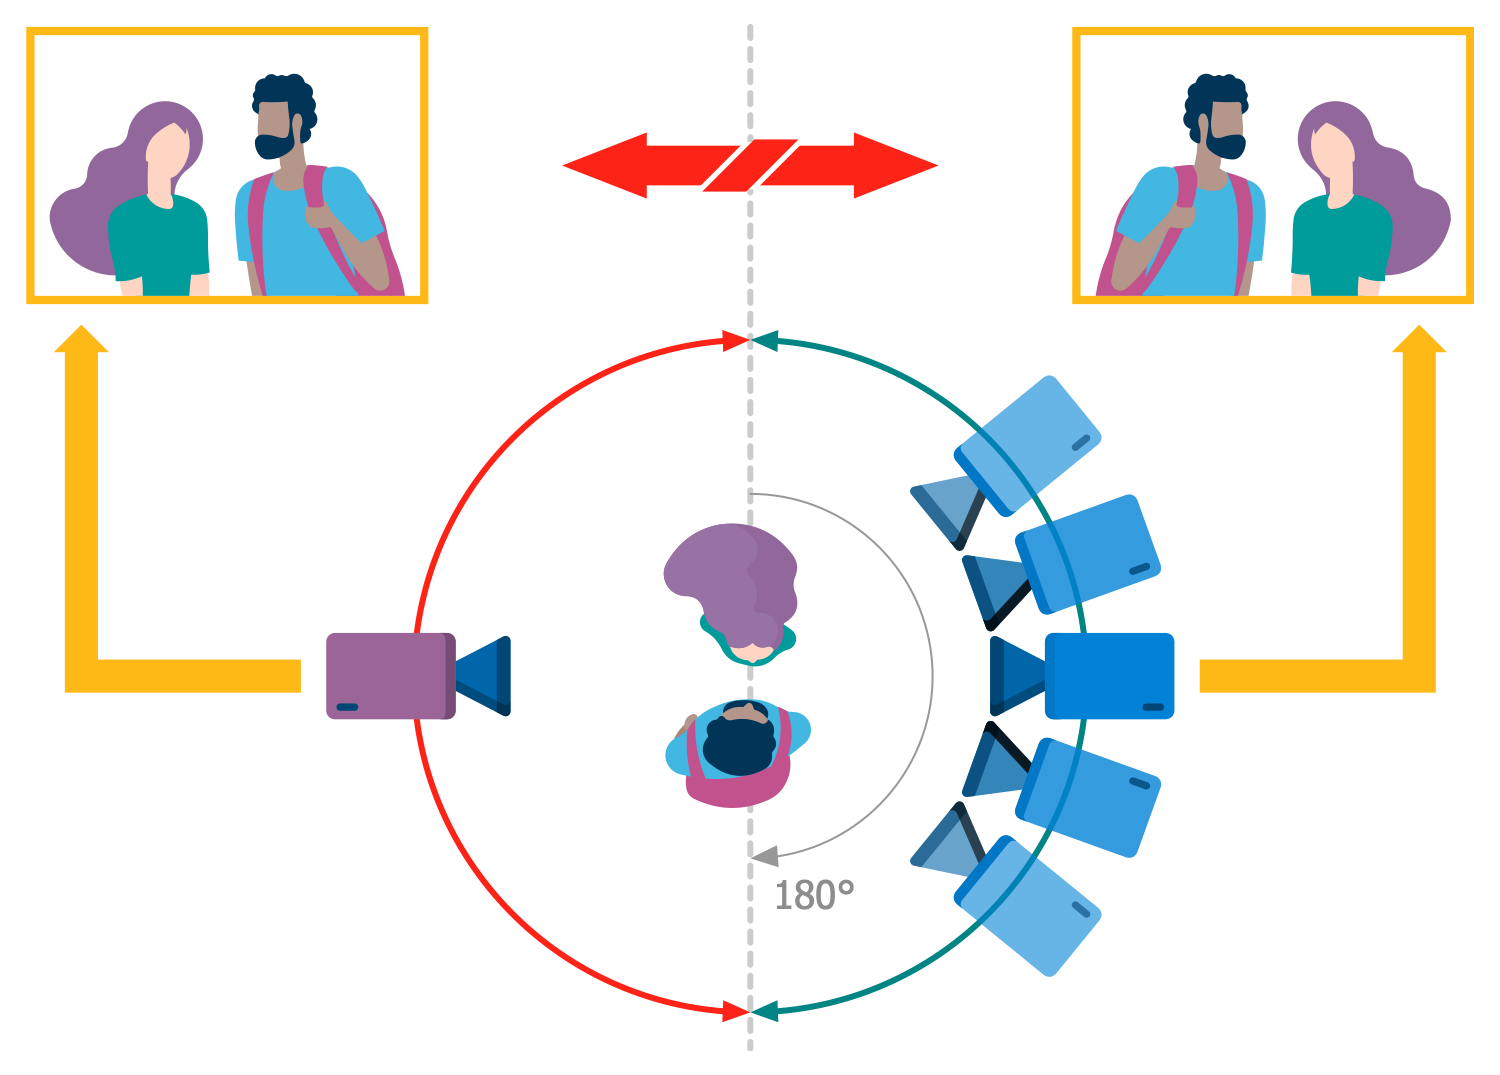
Example 1: 180 Degree Rule
This diagram was created in ConceptDraw DIAGRAM using the combination of libraries from the Mass Media Infographics Solution. An experienced user spent 5 minutes creating this sample.
This sample illustrates the rule of 180-degree cinema, which states that the point and zoom of the shooting can change, but it is necessary to maintain the direction of the actors' view throughout the scene. The imaginary line in a scene of communication two characters is shown as the axis in a diagram. During the shooting, the camera should not cross this axis. You can also see the 180° arc and green zone in which the camera can move, the character presented as the man in this diagram will be on the left and the woman on the right. If the camera goes into the red zone, the characters will switch places on the screen. So, if a camera stays on one side of the imaginary line, the spatial relationship between two characters will be consistent from shot to shot during all scene while it doesn't change its position on the opposite side. A sudden change in position is undesirable because it can disorient the audience, but is rarely used to obtain a special effect.
Example 2: Benefits of OpenAccess
This diagram was created in ConceptDraw DIAGRAM using the combination of libraries from the Mass Media Infographics Solution. An experienced user spent 10 minutes creating this sample.
This sample demonstrates the benefits of Open access, which is a set of principles and practices that enable fast, real-time and free full-text access to research results, scientific and educational materials while maintaining a copyright license. The diagram is made in the form of a circle diagram where the main points are placed like rays around the central thought. OpenAccess is a proprietary API controlled by the Open access Coalition and directed to the facilitation of the interaction of electronic design automation software among the coalition members. Open access gives you greater visibility for your work and a better quote rate, public access to your work, a high degree of influence of your research on public policy, and compliance with the rules of financiers. With Open access, researchers from developing countries can read your work, practitioners can apply your results, and taxpayers get the value of their money. All of the items listed were provided with colorful images to give them visibility and make them memorable. There are graphics, libra, a document and other distinctive symbols from the libraries of the Mass Media Infographics solution.

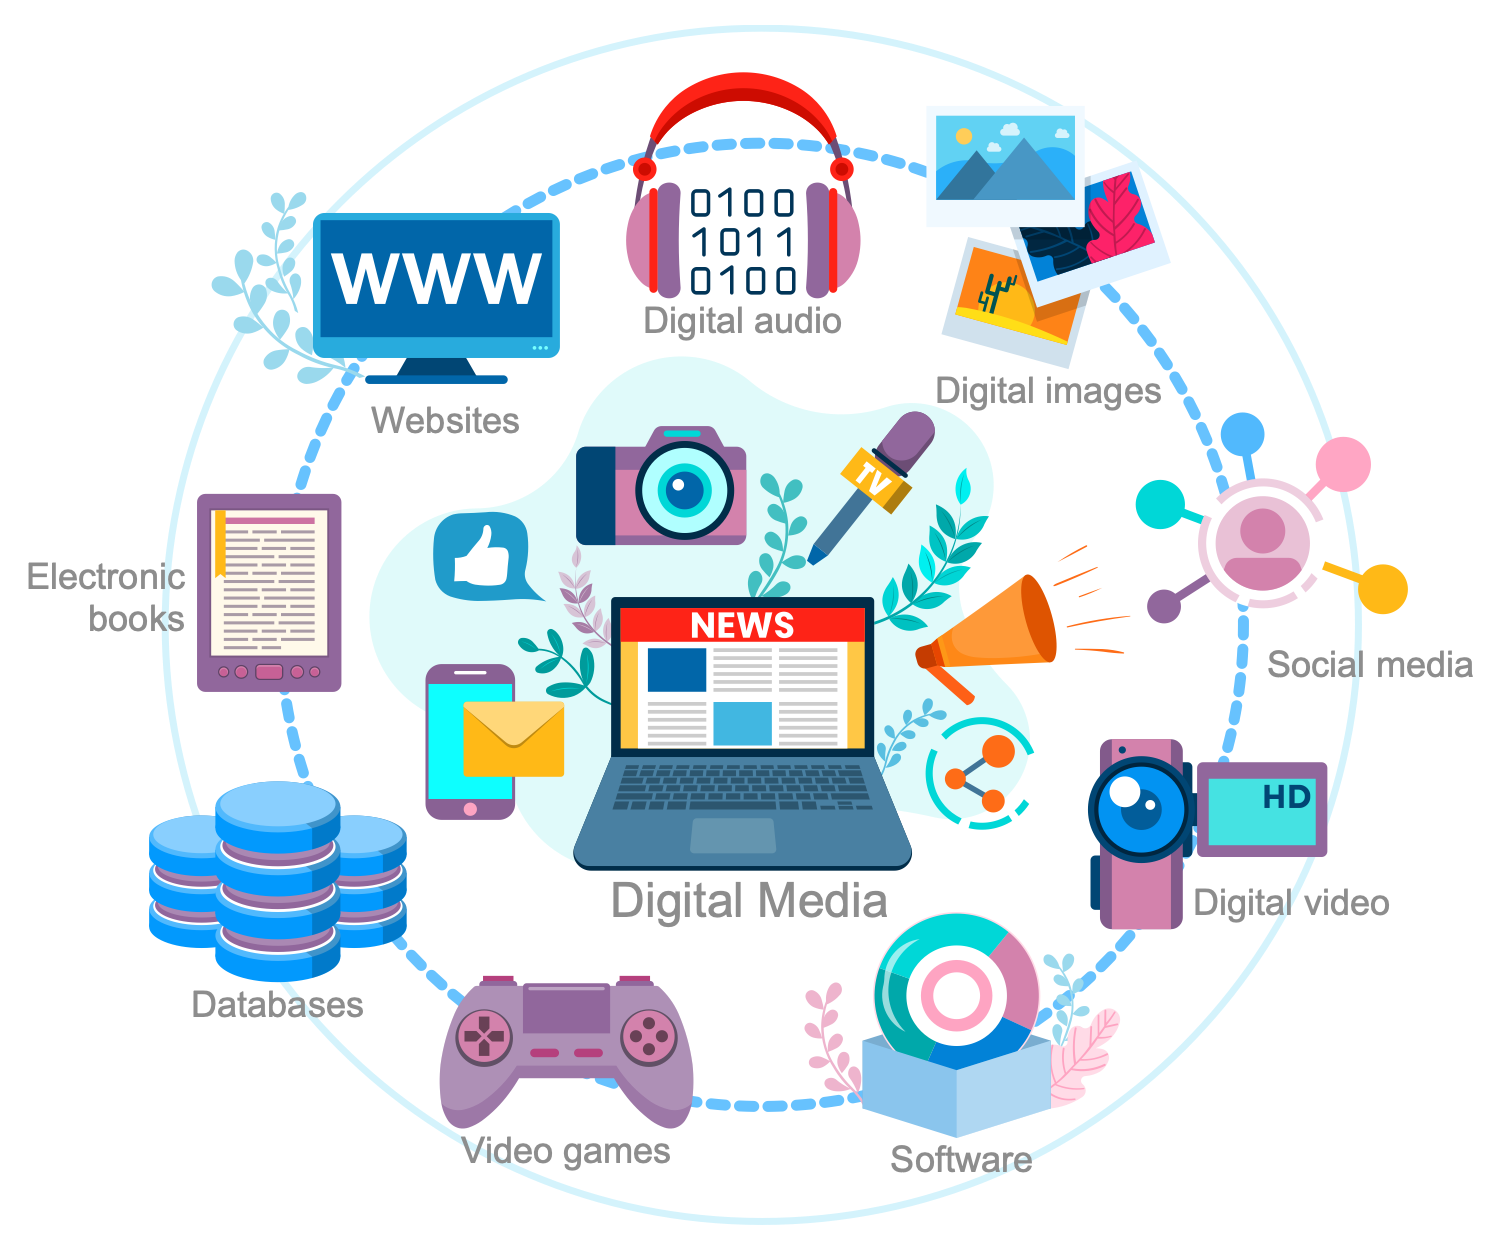
Example 3: Digital Media
This diagram was created in ConceptDraw DIAGRAM using the combination of libraries from the Mass Media Infographics Solution. An experienced user spent 10 minutes creating this sample.
This sample shows the diversity of digital media. There are included the most common examples: digital audio, digital video, digital images, social media, websites, software, video games, databases, and electronic books. Over the past decades, digital media has confidently entered our lives. Today they are all around us, sometimes they are positioned in contrast to traditional print media, but most exist next to them. At the same time, the enormous impact of digital media on culture and society is certain. In combination with the internet, digital media open great opportunities for marketing, advertising, promotion, and other activities. They also create ideal conditions for journalistic activity, business, entertainment, education, etc. Each item in this diagram is illustrated with colorful clipart from the solution libraries making it exceptionally looking. Design easily your exclusive infographics in ConceptDraw DIAGRAM and successfully use them in social media marketing and digital media marketing.
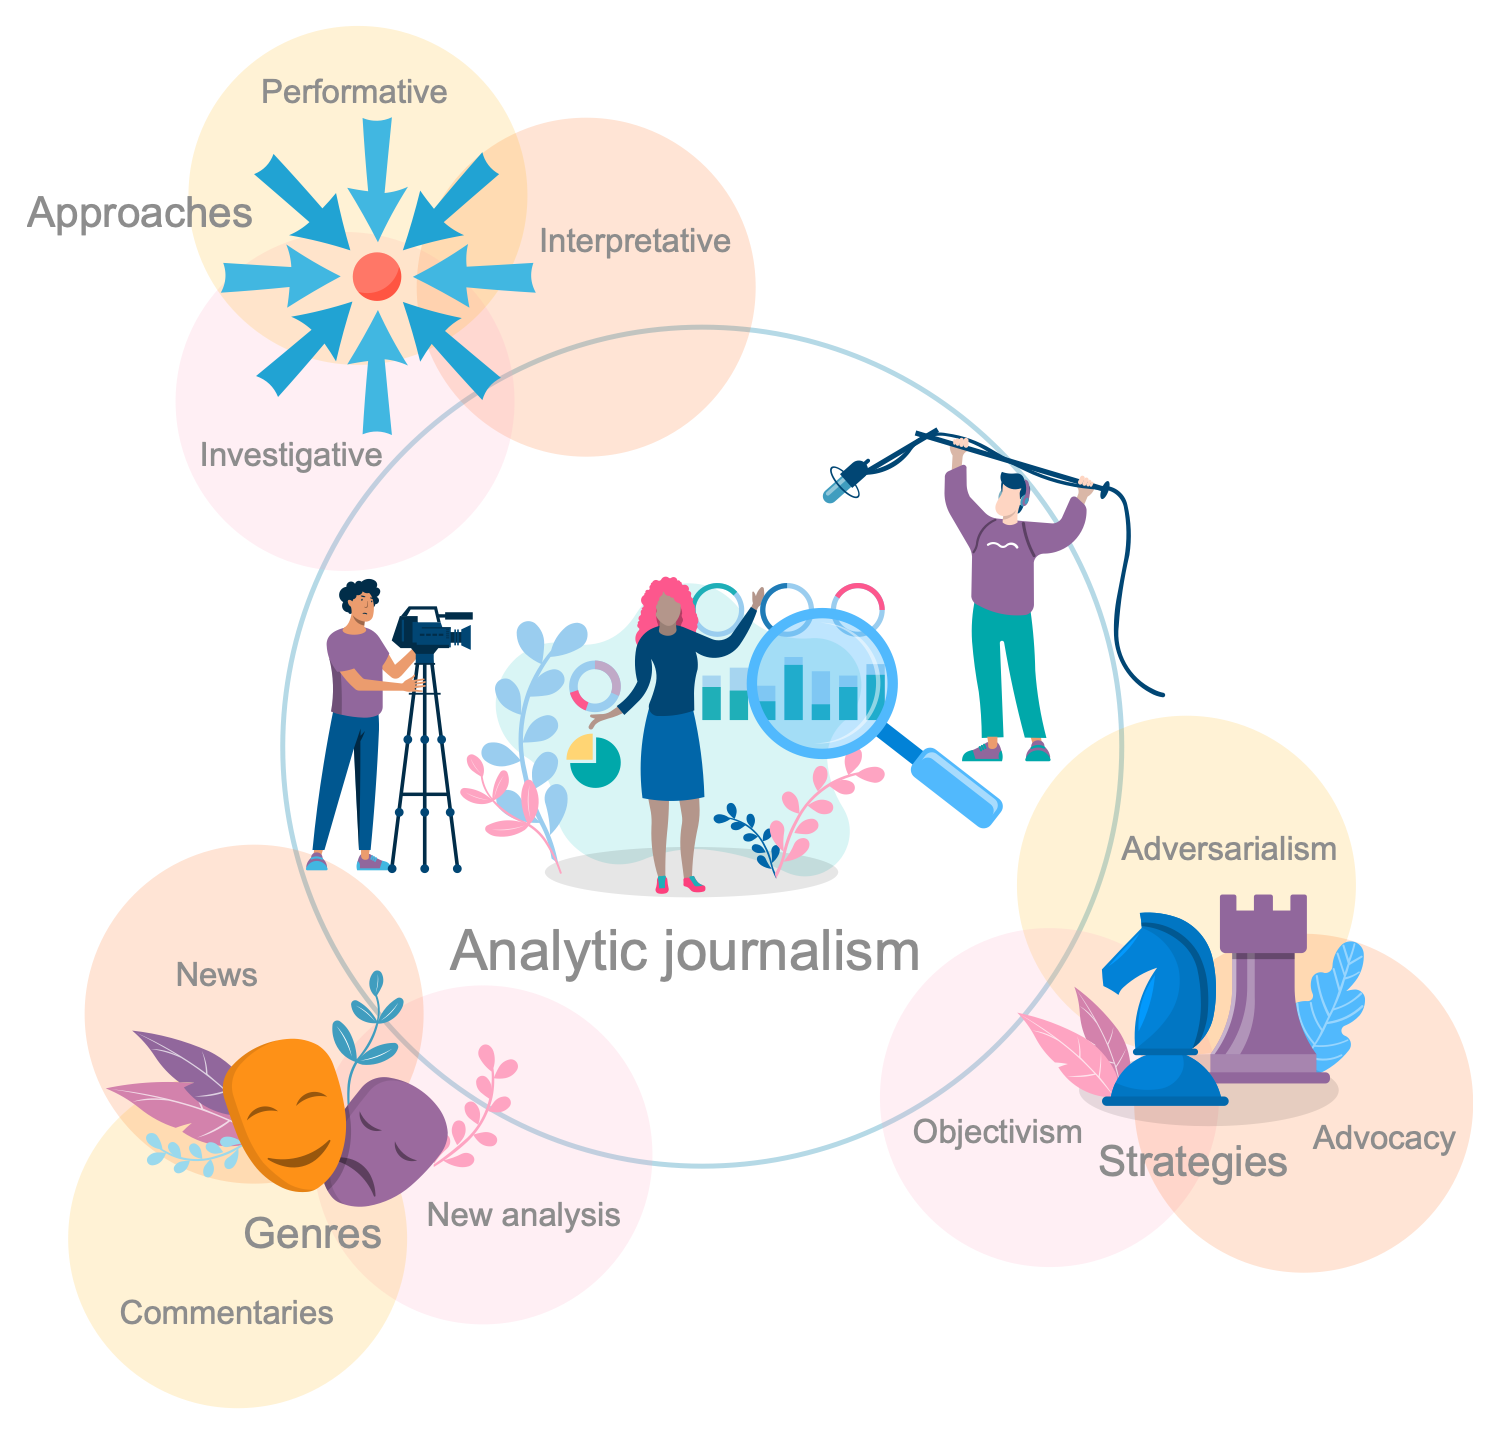
Example 4: Dimensions in Journalism
This diagram was created in ConceptDraw DIAGRAM using the combination of libraries from the Mass Media Infographics Solution. An experienced user spent 10 minutes creating this sample.
This sample is dedicated to the versatility of analytical journalism, which is a unique independent field of journalism, including comprehension of complex reality, analysis and explanation of phenomena, collecting disparate data and establishing relationships between them, presenting forecasts in some problematic spectrum, not the information about current events in the country. At the same time, the analytic journalism uses the approaches of investigative journalism and explanatory reporting, as well as the methods of multiple non-journalistic disciplines, social science researches, and others. It is aimed at the deep understanding and explaining the issues and phenomenon. Analytical journalism includes various journalistic approaches (performative, interpretative, investigative), strategies (objectivism, adversarialism, advocacy), and genres (news, commentaries, new analysis). All they are specified in this diagram. Design professional-looking infographics with Mass Media Infographics solution drawing tools and successfully post them in social media sites.
Example 5: Functions of the Community Manager
This diagram was created in ConceptDraw DIAGRAM using the combination of libraries from the Mass Media Infographics Solution. An experienced user spent 10 minutes creating this sample.
This sample diagram shows the main functions of a community manager, which is a specialist in the field of community management. A community manager is engaged in creating, growing, supporting, and developing different communities or structures with a network hierarchy, both online and offline. He is also managing and communicating with community members. Community management is characterized by a voluntary principle of participation and a lack of financial incentives. The work of a community manager lies at the intersection of different humanitarian sciences like pedagogy, PR, HR, social psychology, and others. Among his main functions mentioned in this diagram are listening, analyzing, distributing, explaining, transmitting, and retrieving, which however may vary depending on the specifics, nature, and goals of a particular community. Community managers are commonly employed in the computer games industry, volunteer organizations, social media, online research communities, self-regulating organizations, branded online communities, and other communities. The Mass Media solution is ideal for designing diagrams in absolutely different fields: community management, social media management, strategic management, and many others.

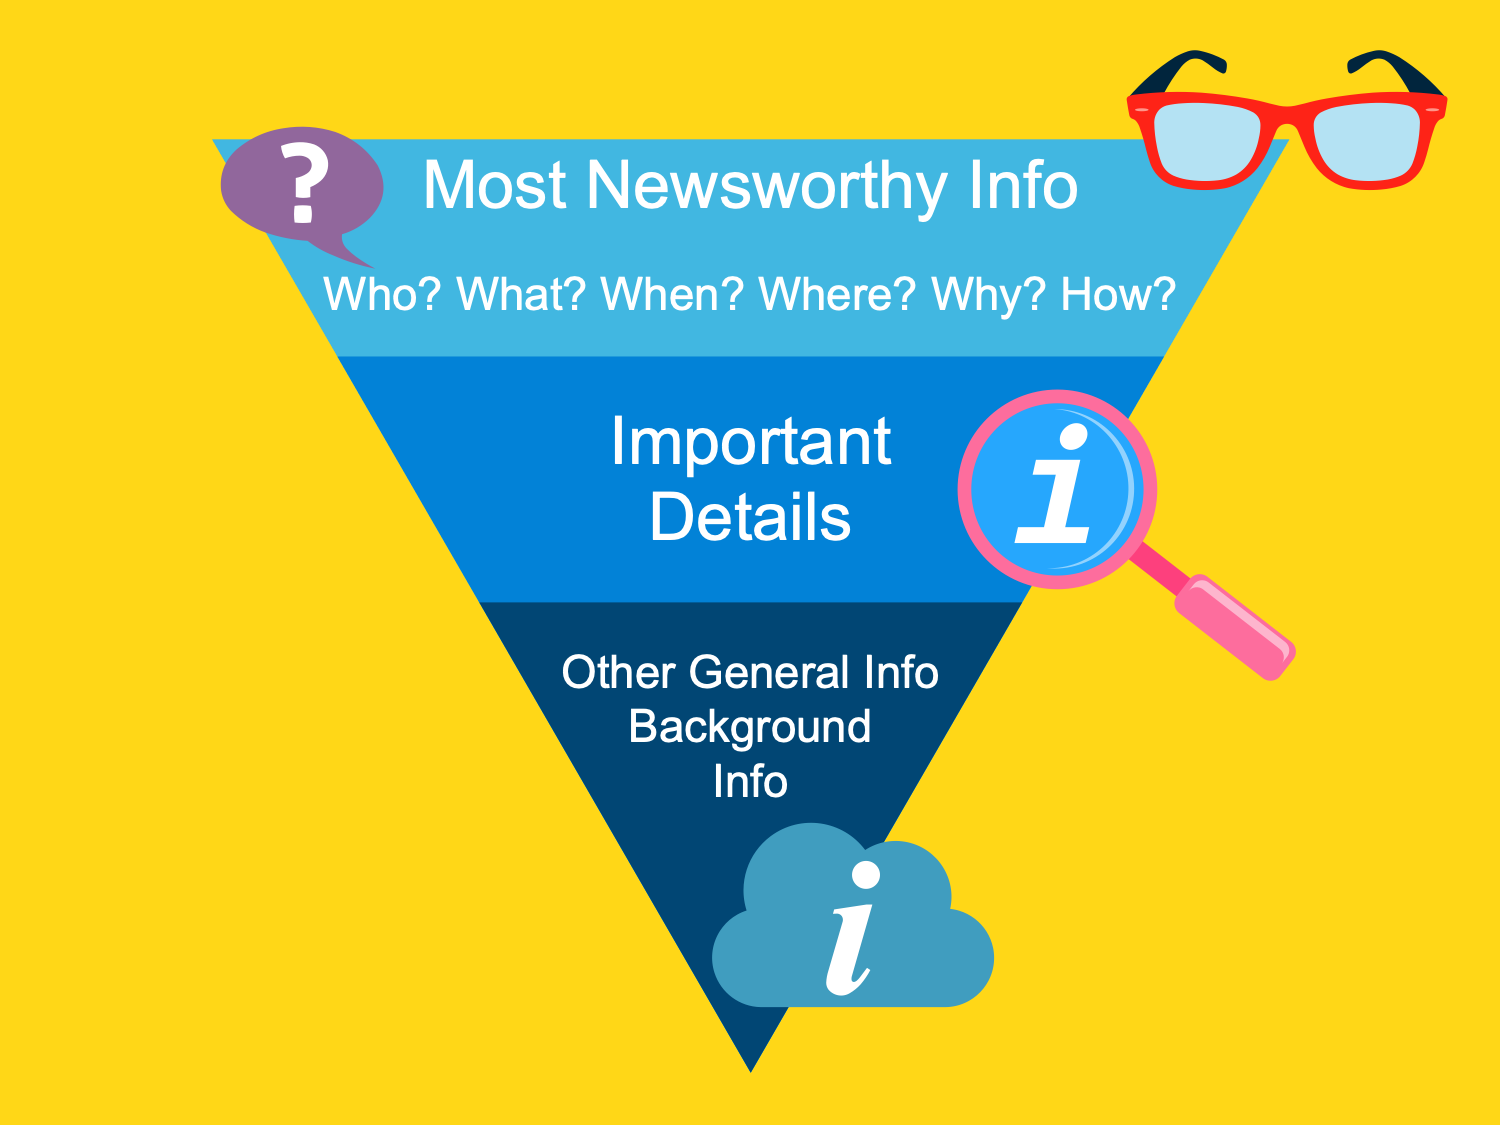
Example 6: Inverted Pyramid of Journalism
This diagram was created in ConceptDraw DIAGRAM using the combination of libraries from the Mass Media Infographics Solution. An experienced user spent 10 minutes creating this sample.
This sample is dedicated to the inverted or upside-down pyramid term used in journalism and mass media. The inverted pyramid scheme was invented in the 19th century, but it is still relevant today. It is the most famous news writing scheme, also used when writing stories and texts of other kinds, blog posts, marketing factsheets, etc. The inverted pyramid is also a way to illustrate how information should be prioritized and structured. It looks like a triangle pointing down. In the upper and widest part of the inverted pyramid are placed the most interesting, significant and eye-catching information and materials. The short answers to the main questions like who, what, when, where, why and how should be there. A little lower are placed important details and then at the movement to triangle's lowest top is presented the information of less and less importance. Thus, the narrower and lower part is the less important material it contains.
Example 7: IPTV Network
This diagram was created in ConceptDraw DIAGRAM using the combination of libraries from the Mass Media Infographics Solution. An experienced user spent 15 minutes creating this sample.
This sample shows the IPTV (Internet Protocol television) network schematic. IPTV is the standard for the safe and reliable delivery of a variety of television content using Internet Protocol (IP) networks. This is a technology that is gradually replacing traditional television broadcasting via terrestrial, satellite and cable formats and is developing at a high speed. IPTV enables continuous streaming and virtually instant content playback. That's why it was taken the name of the streaming media. IPTV network is a server-based network, which provides Internet television to numerous users simultaneously and gives great advantages and convenience to the subscribers because of the ability to watch all they like whenever and wherever. IPTV technology is also deployed in subscriber-based telecommunications networks through the use of set-top boxes or other equipment, for delivering media and related services to corporate and private networks.

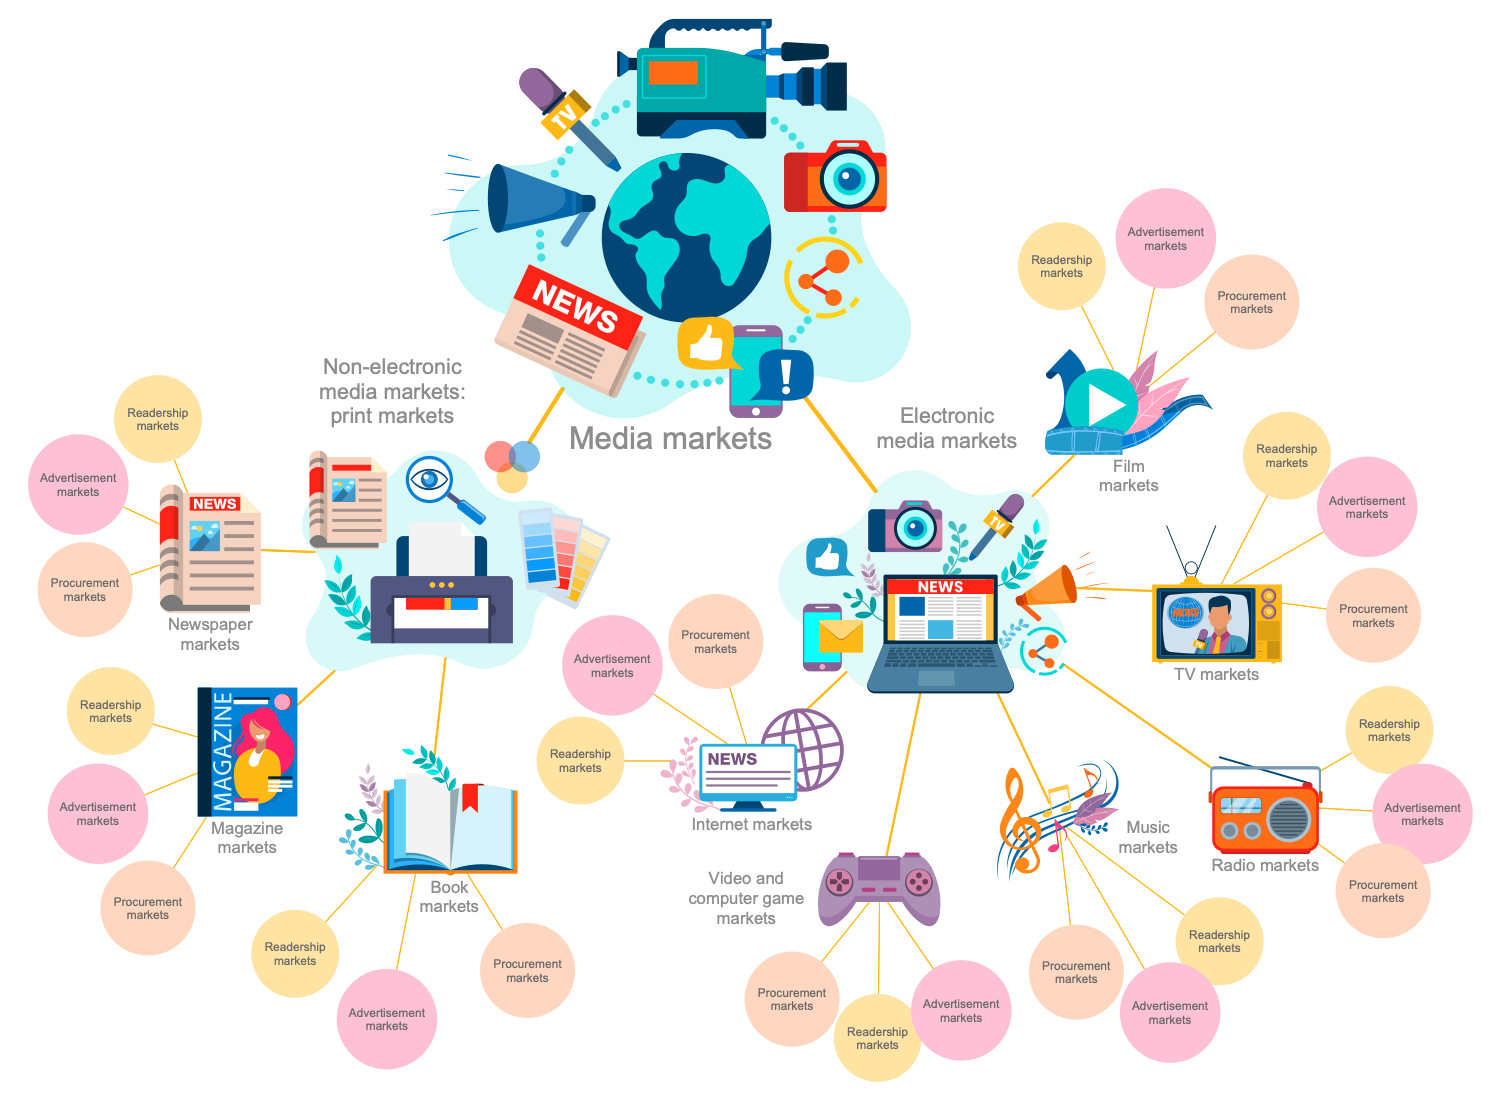
Example 8: Media Markets
This diagram was created in ConceptDraw DIAGRAM using the combination of libraries from the Mass Media Infographics Solution. An experienced user spent 15 minutes creating this sample.
This sample shows an overview of all existing media markets also named broadcast markets. The media world is diverse and media markets represent consumer groups that have access to the same marketing messages. They are related to television, radio, varied print mediums, internet, and social media. You can observe two large groups: electronic media markets and non-electronic media markets. The first group includes the film markets, TV markets, music markets, radio markets, internet markets, video and computer game markets. The second one contains print markets, book markets, magazine markets, and newspaper markets. Due to the enormous popularity of the Internet today, the Internet media market has a particularly popularity. The media markets significantly differ from the markets of other economic sectors. Thus, the multidimensional competition is one of the distinctive features of media markets.
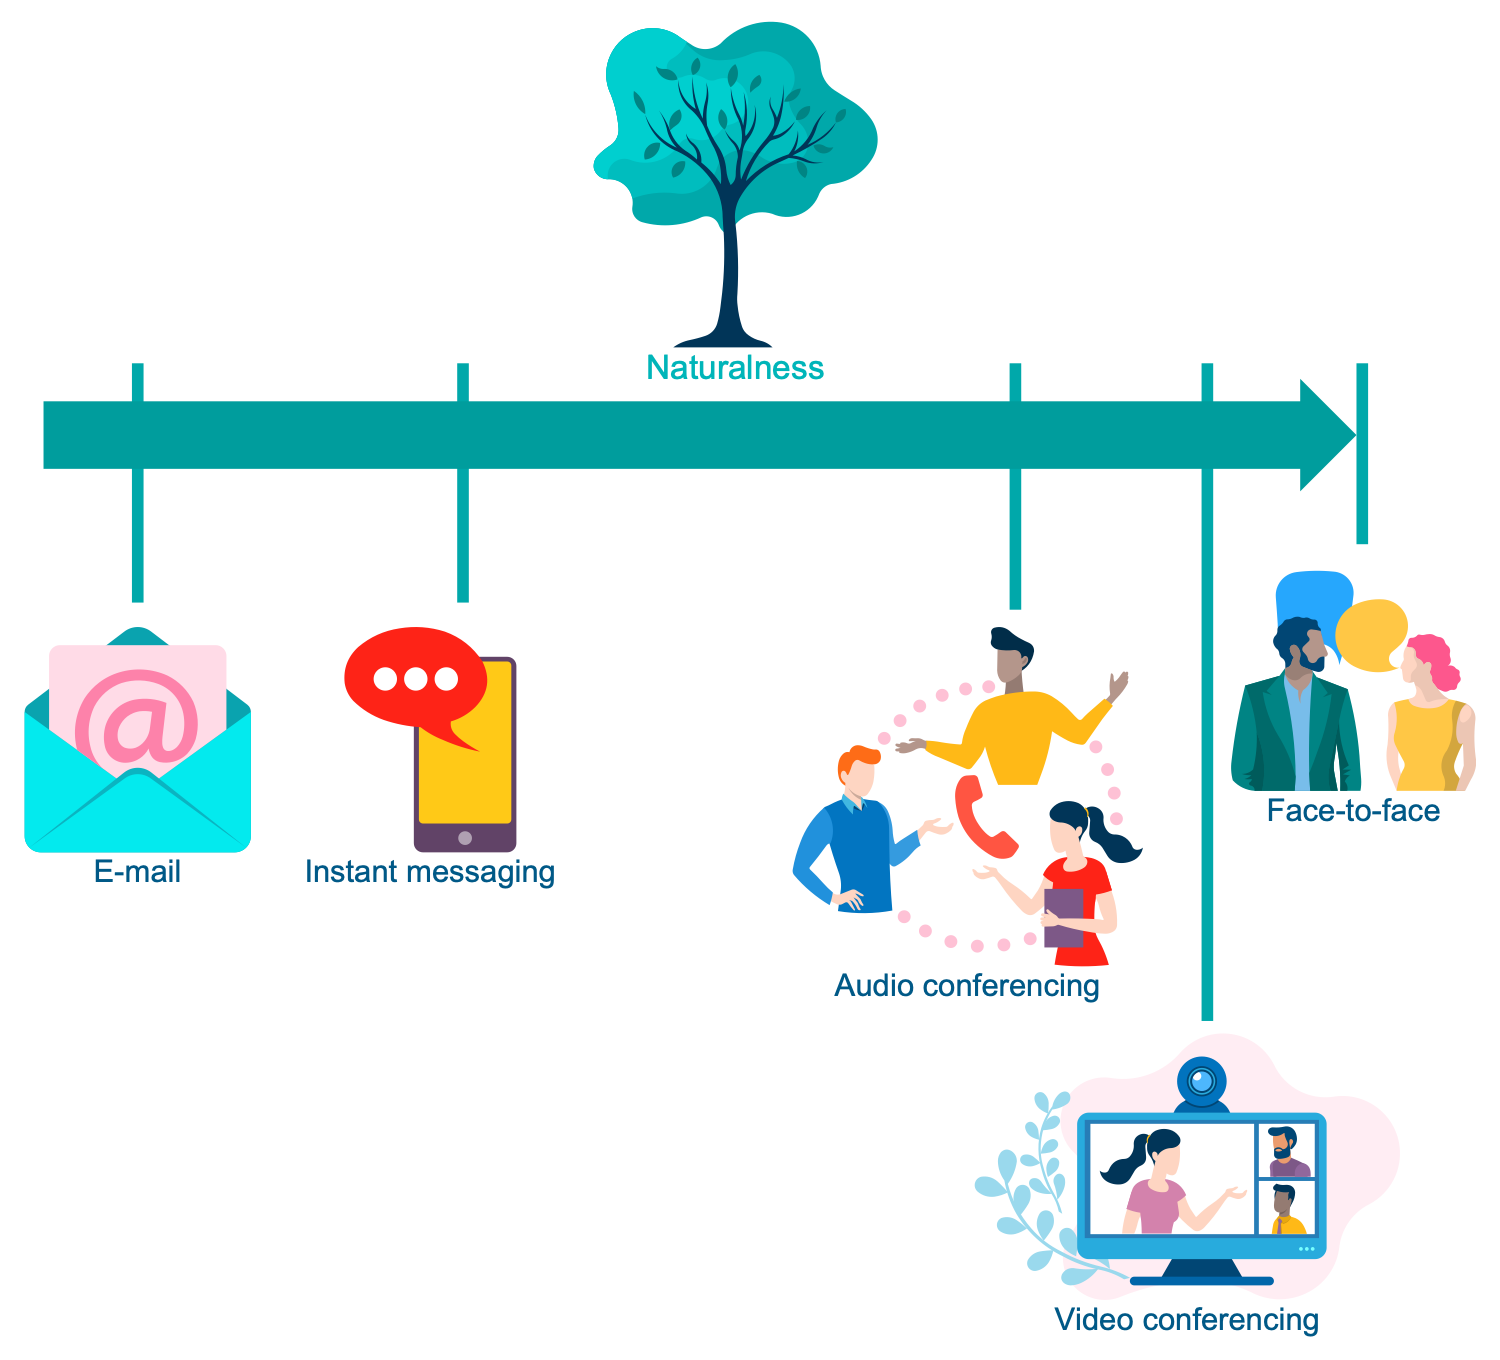
Example 9: Media Naturalness Theory
This diagram was created in ConceptDraw DIAGRAM using the combination of libraries from the Mass Media Infographics Solution. An experienced user spent 5 minutes creating this sample.
This sample illustrates the media naturalness theory, also known as the psychobiological model. This theory was developed by Ned Kock and based on the Darwinian evolutionary principles. It was studied and applied to human communication in varied contexts like business processes, education, negotiations, communication in a virtual environment, and much more. The media naturalness theory has an evolutionary explanation and states that face-to-face communication is the most effective way of exchanging information for two people, as well as the richest type of communication medium. Since ancient times people have communicated primarily face-to-face that has led to the brain's development. It is the most conclusive evidence of face-to-face communication advantages. In turn, computer-mediated communication is a very recent phenomenon, and even audio and video conferences, which are the closest to face-to-face communication, however cannot completely replace it.
Example 10: Mix Minus
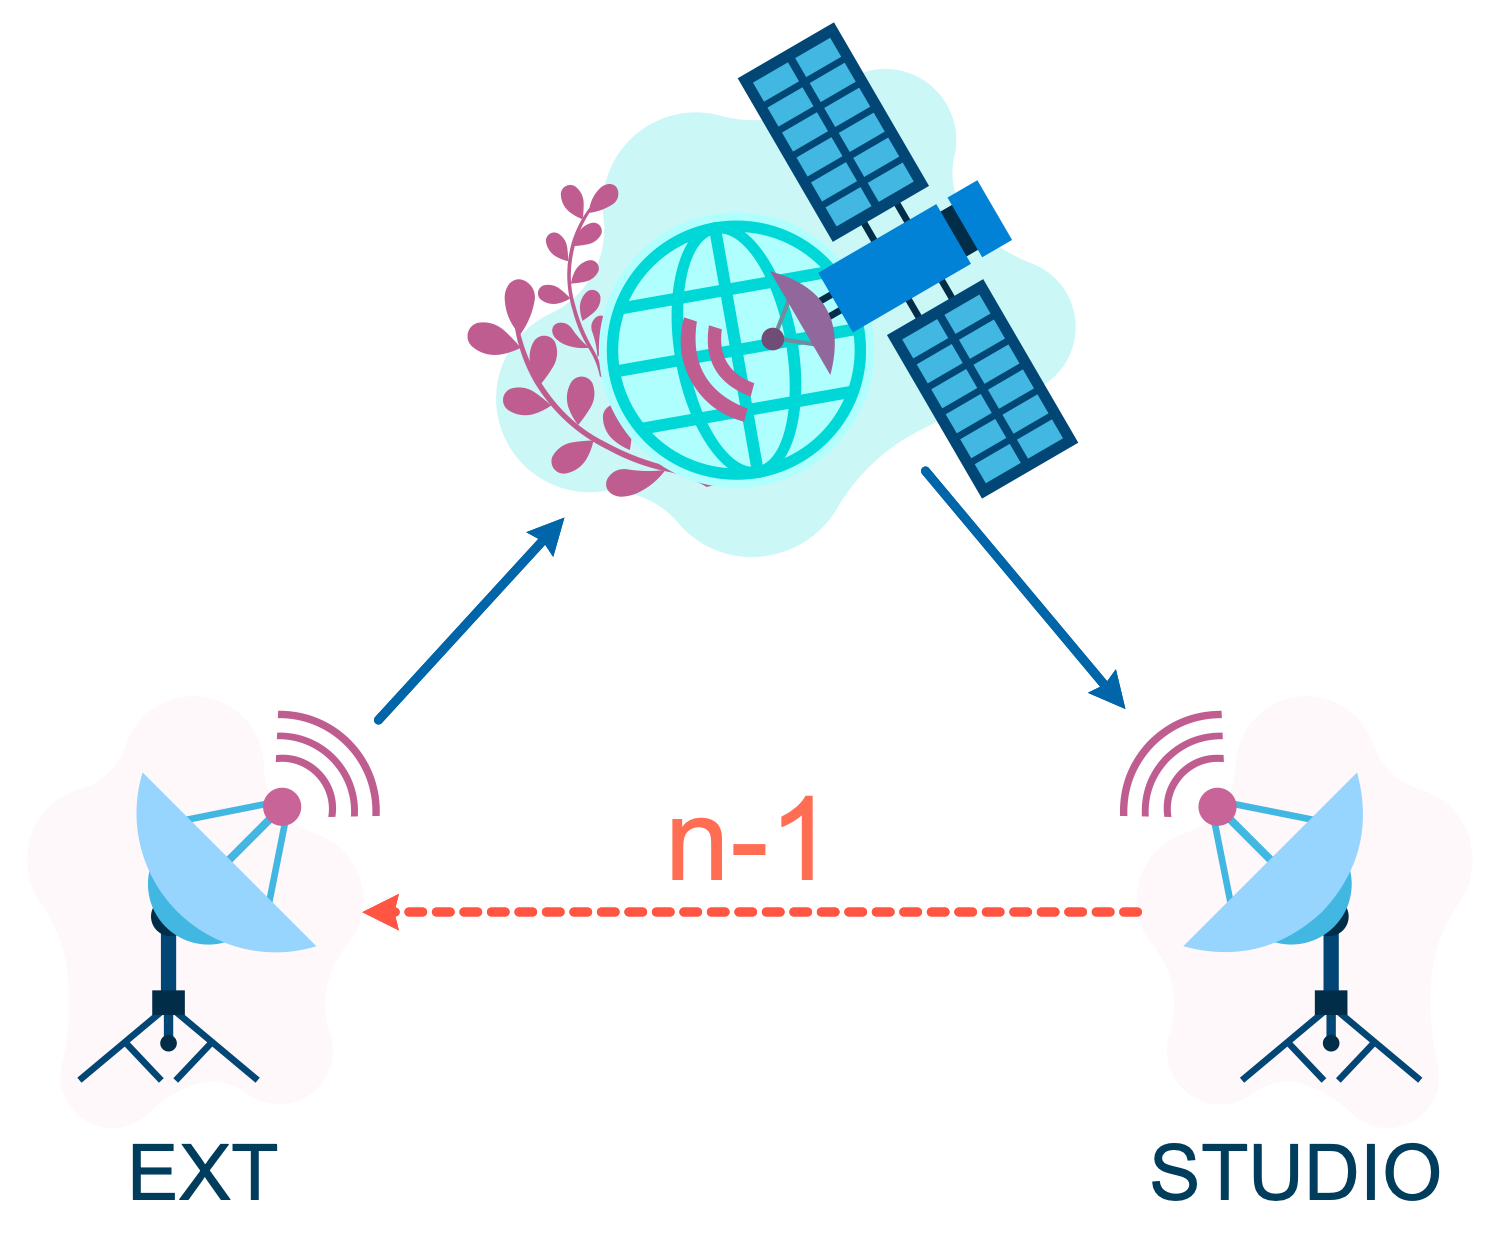
This diagram was created in ConceptDraw DIAGRAM using the combination of libraries from the Mass Media Infographics Solution. An experienced user spent 5 minutes creating this sample.
This sample is dedicated to the mix-minus or clean feed from a studio to a satellite-linked remote unit. Mix-minus is a particular setup of a mixing console or a matrix mixer when its output contains everything except a designated input. It allows us to free the output buses, simplify commutation, prevent echoes, whistling and humming effects, and break the feedback loops in broadcast and sound reinforcement systems. Mix-minus is used at the radio stations, in TV news and interviews when a reporter or an interviewed person is speaking to a host from a remote outside broadcast location. It allows eliminating an unpleasant effect when a person hears himself in an earpiece with a slight delay. A person can hear all relevant feeds except his own voice, thus follow the program's progress and doesn't miss the moment when he will be broadcasting. Mix-minus is also a common way to remove the caller's voice from the VoIP call.
Example 11: Multi Channel Publishing
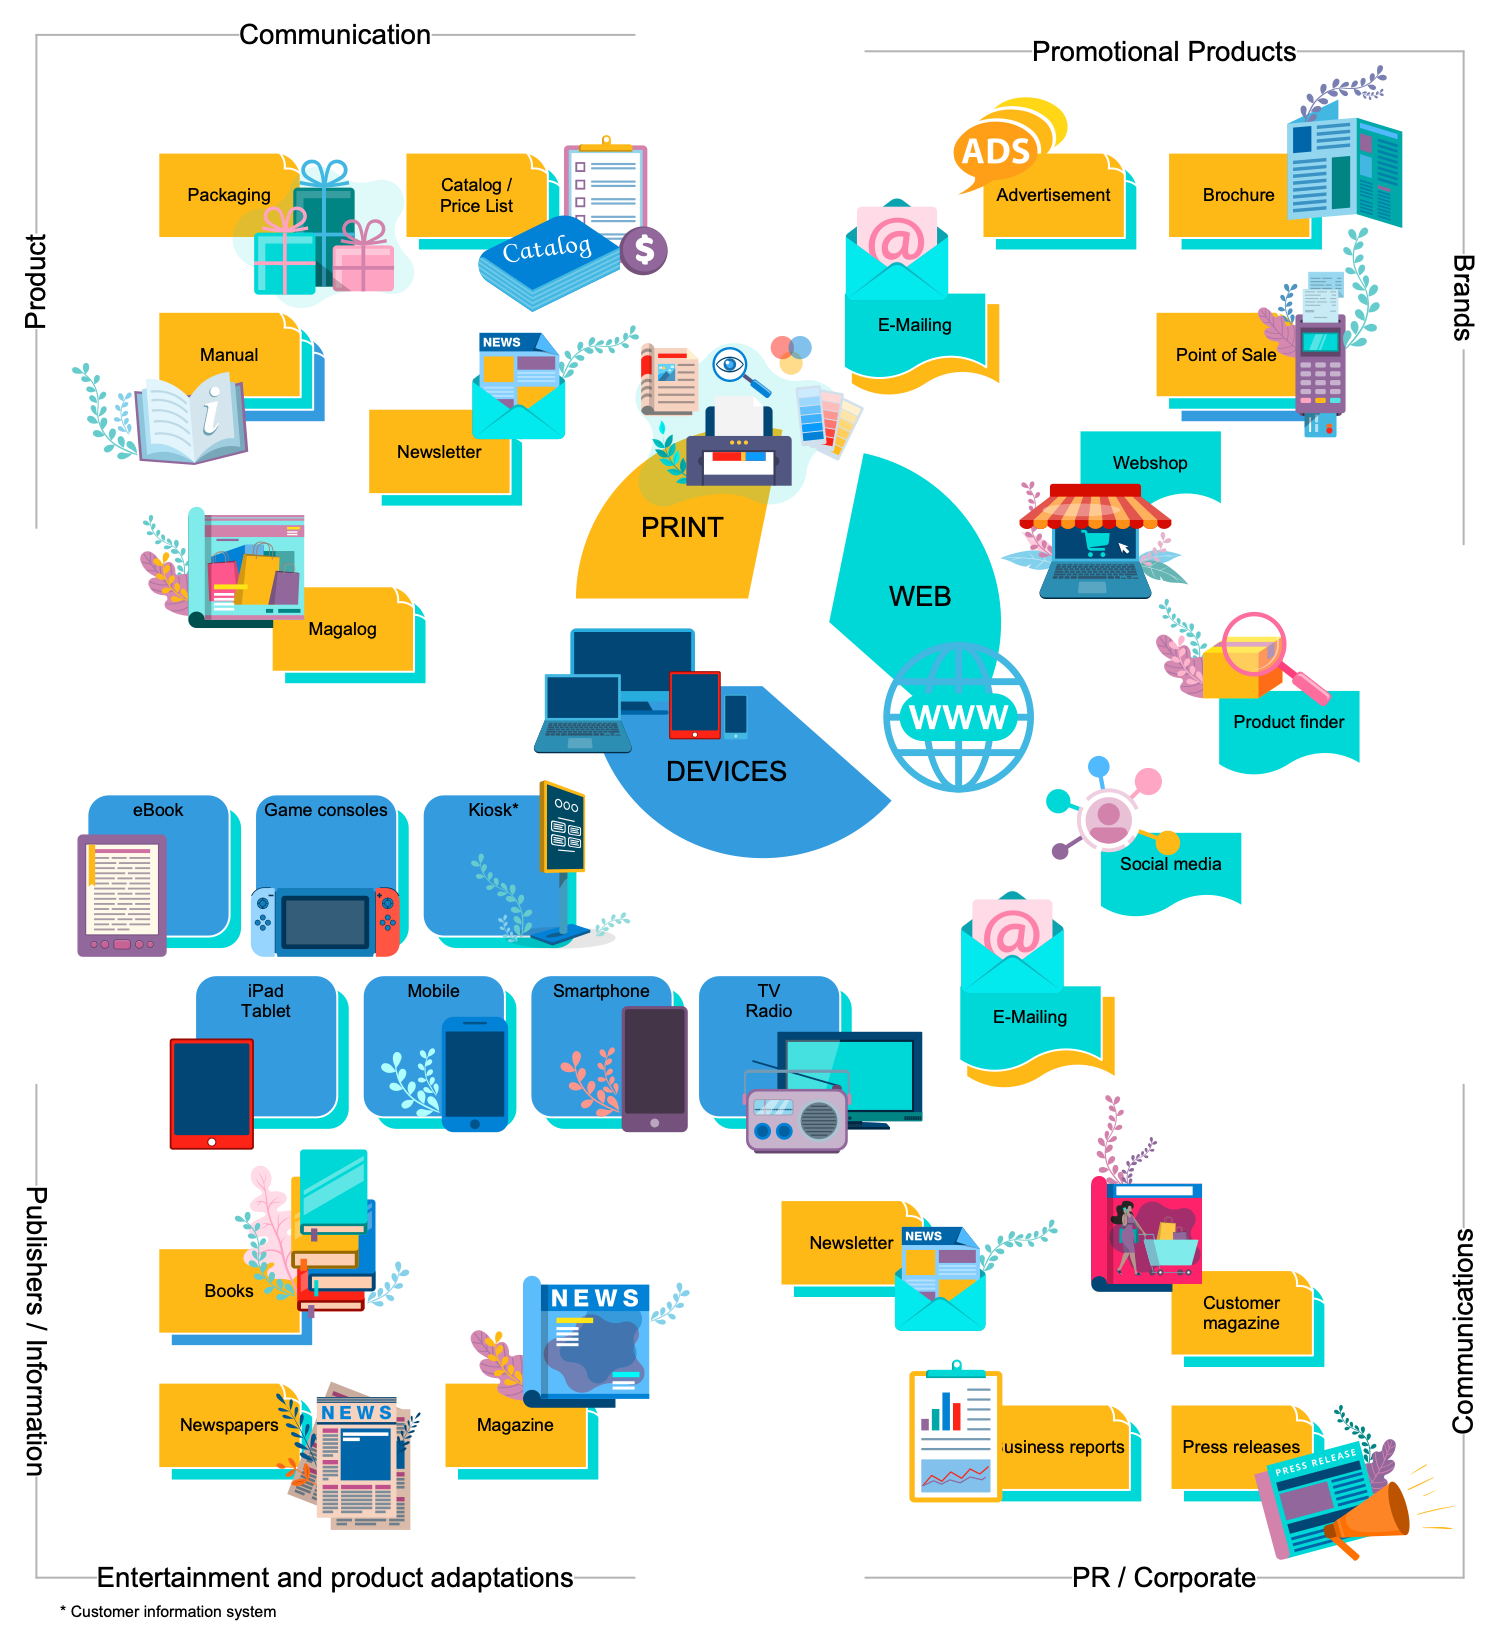
This diagram was created in ConceptDraw DIAGRAM using the combination of libraries from the Mass Media Infographics Solution. An experienced user spent 15 minutes creating this sample.
This sample provides an overview of the areas of multi channel publishing that are used by both small and large publishers. Multi channel publication means the simultaneous distribution of content in different ways: in print materials, internet resources, social media, websites, mobile applications, etc. The readers can choose themselves the source they prefer to read your content - in printed or digital form using electronic gadgets or other devices. Four large areas of the multi-channel publishing are presented in this diagram: Product Communication, Promotional Products / Brands, Publishers / Information / Entertainment and product adaptations, PR / Corporate Communications. The choice of a channel belongs to the publisher and depends on the goals he pursues and the target audience. But since people have completely different preferences when searching for information, using one channel significantly limits your possibilities. In turn, using a variety of channels allows you to get a wider customer base.
Example 12: Puzzle IT
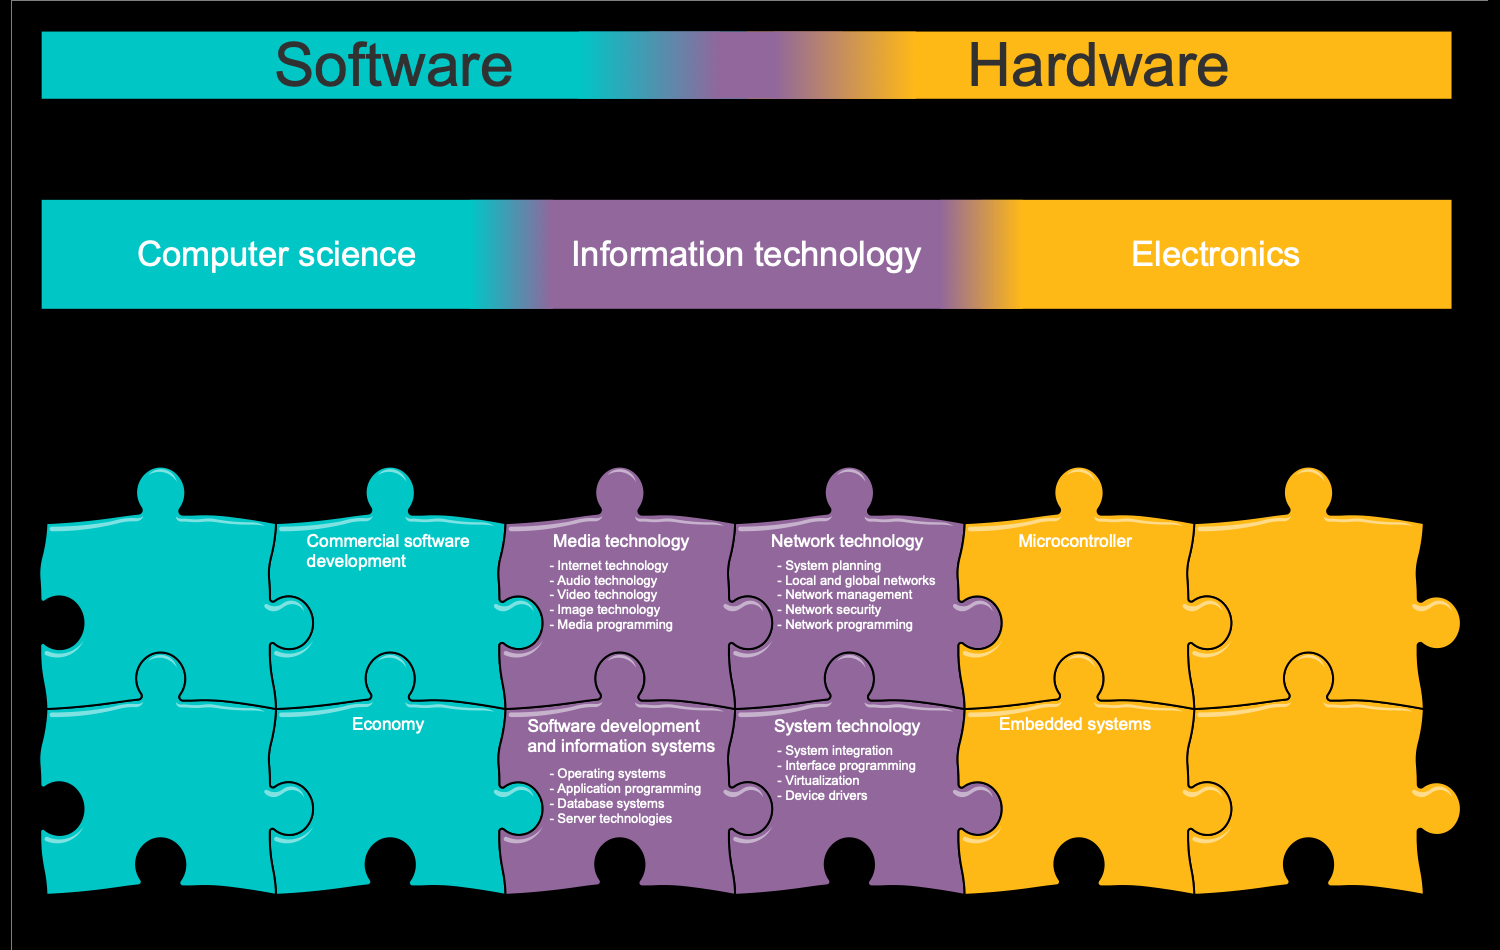
This diagram was created in ConceptDraw DIAGRAM using the combination of libraries from the Mass Media Infographics Solution. An experienced user spent 10 minutes creating this sample.
This diagram is designed in an unusual puzzle form and is intended in getting an education in the field of information technology (IT). The IT training is like a bridge between computer science and electronics, software and hardware, which are presented at the opposite sides of this puzzle. Information technology is presented in the middle. The main areas in the IT department are media technologies, network technologies, system technologies, software development and information systems. The corresponding sub-items for each group are also listed in the diagram. Computer science includes commercial software development and economy. Electronics is presented by microcontroller and embedded systems. All three parts of this diagram are colored differently to achieve a vivid visual effect and highlight the segmentation of the parts. Use the ready-made puzzle stencil from the solution's "Mass media" library to construct an attractive diagram in just a few seconds.
Example 13: Science Communication
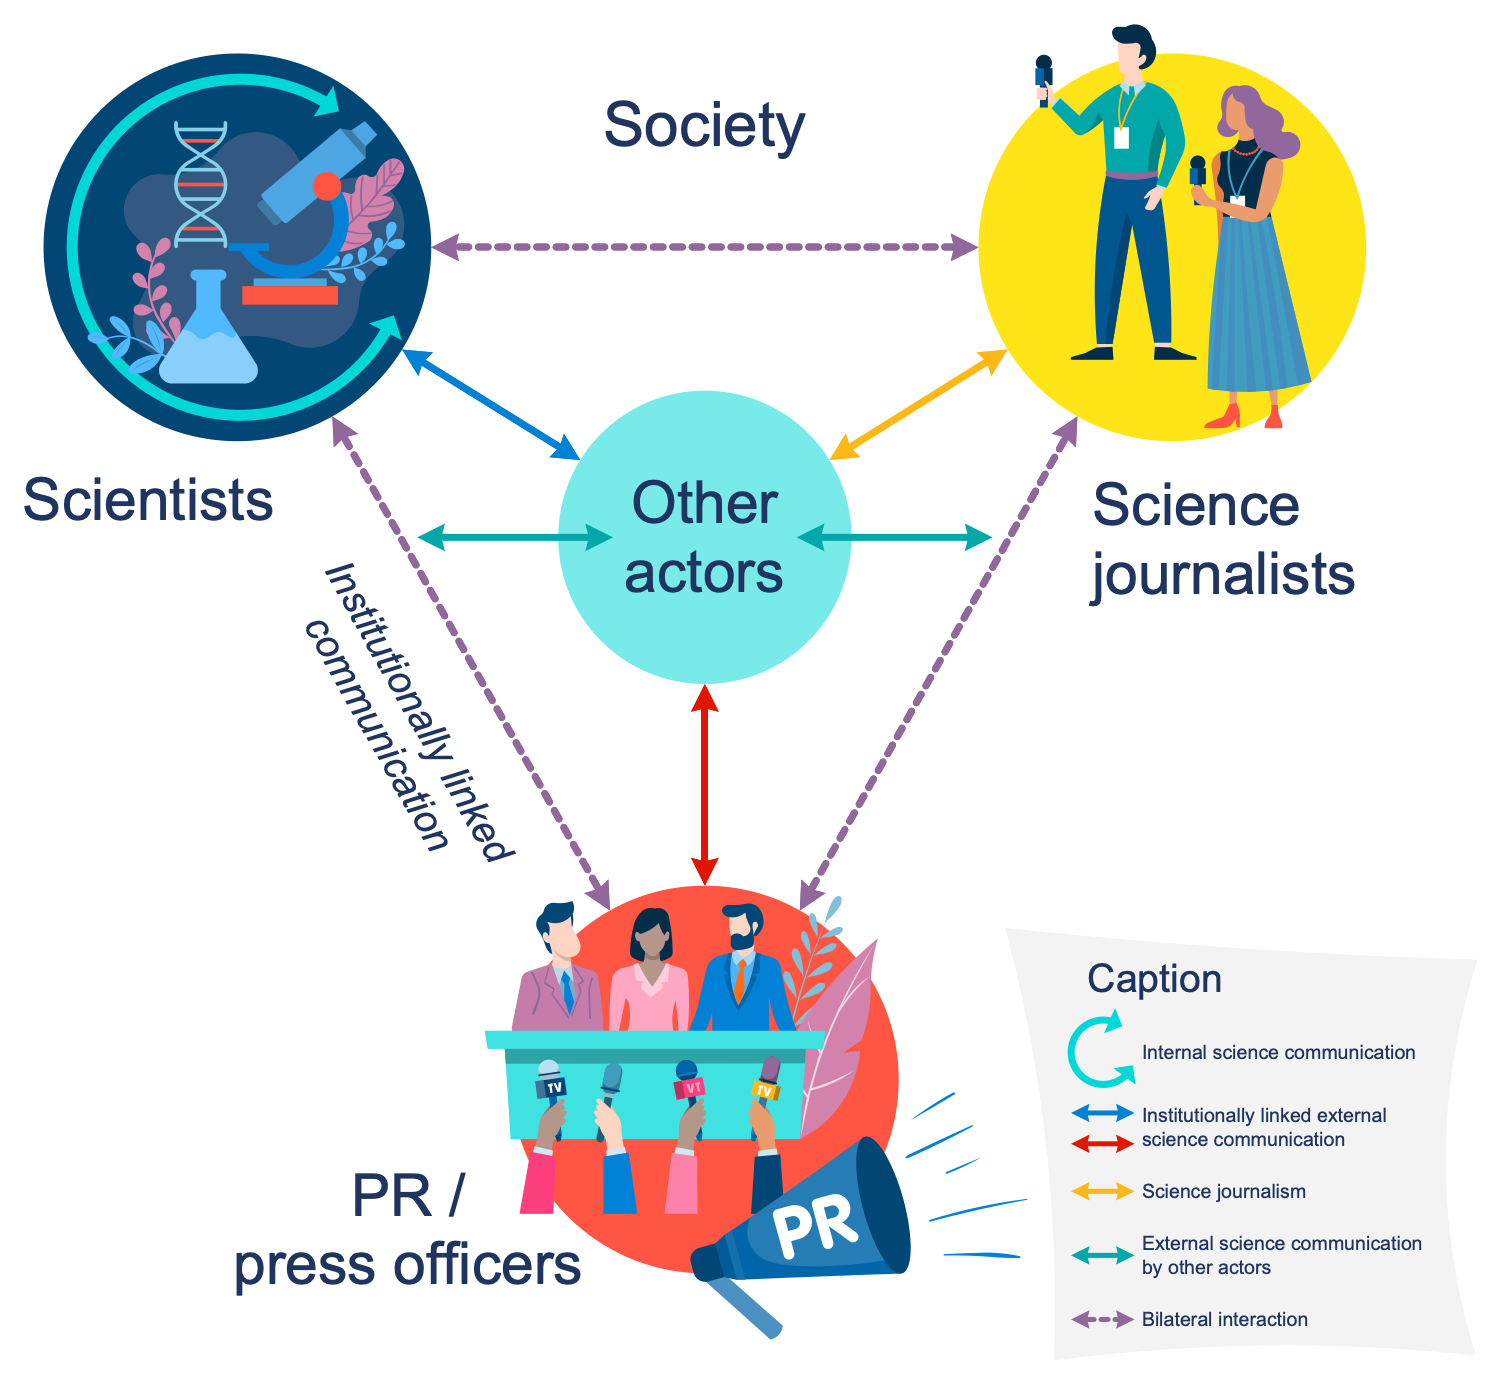
This diagram was created in ConceptDraw DIAGRAM using the combination of libraries from the Mass Media Infographics Solution. An experienced user spent 15 minutes creating this sample.
This sample gives an overview of the science field and communication of actors within it. Scientific communication is a really important practice for informing, training, sharing and exchanging information, interesting facts, wonders and scientific observations, as well as to raise awareness on topics related to science, your personal and other people. The main actors of this process are scientists, science journalists, and PR / press officers. Science communication supports and informs about scientific researches and discoveries, as well as explains the latest methods, and contributes decision making and eliminates scientific misinformation. For effective science communication are used different methods and techniques. The interactions and links between significant actors in this field are designated in a diagram with two-directional links of varied colors. Thus, the communication of scientists with society is carried out through communication with journalists. Institutionally related relationships are established between scientists and PR specialists.
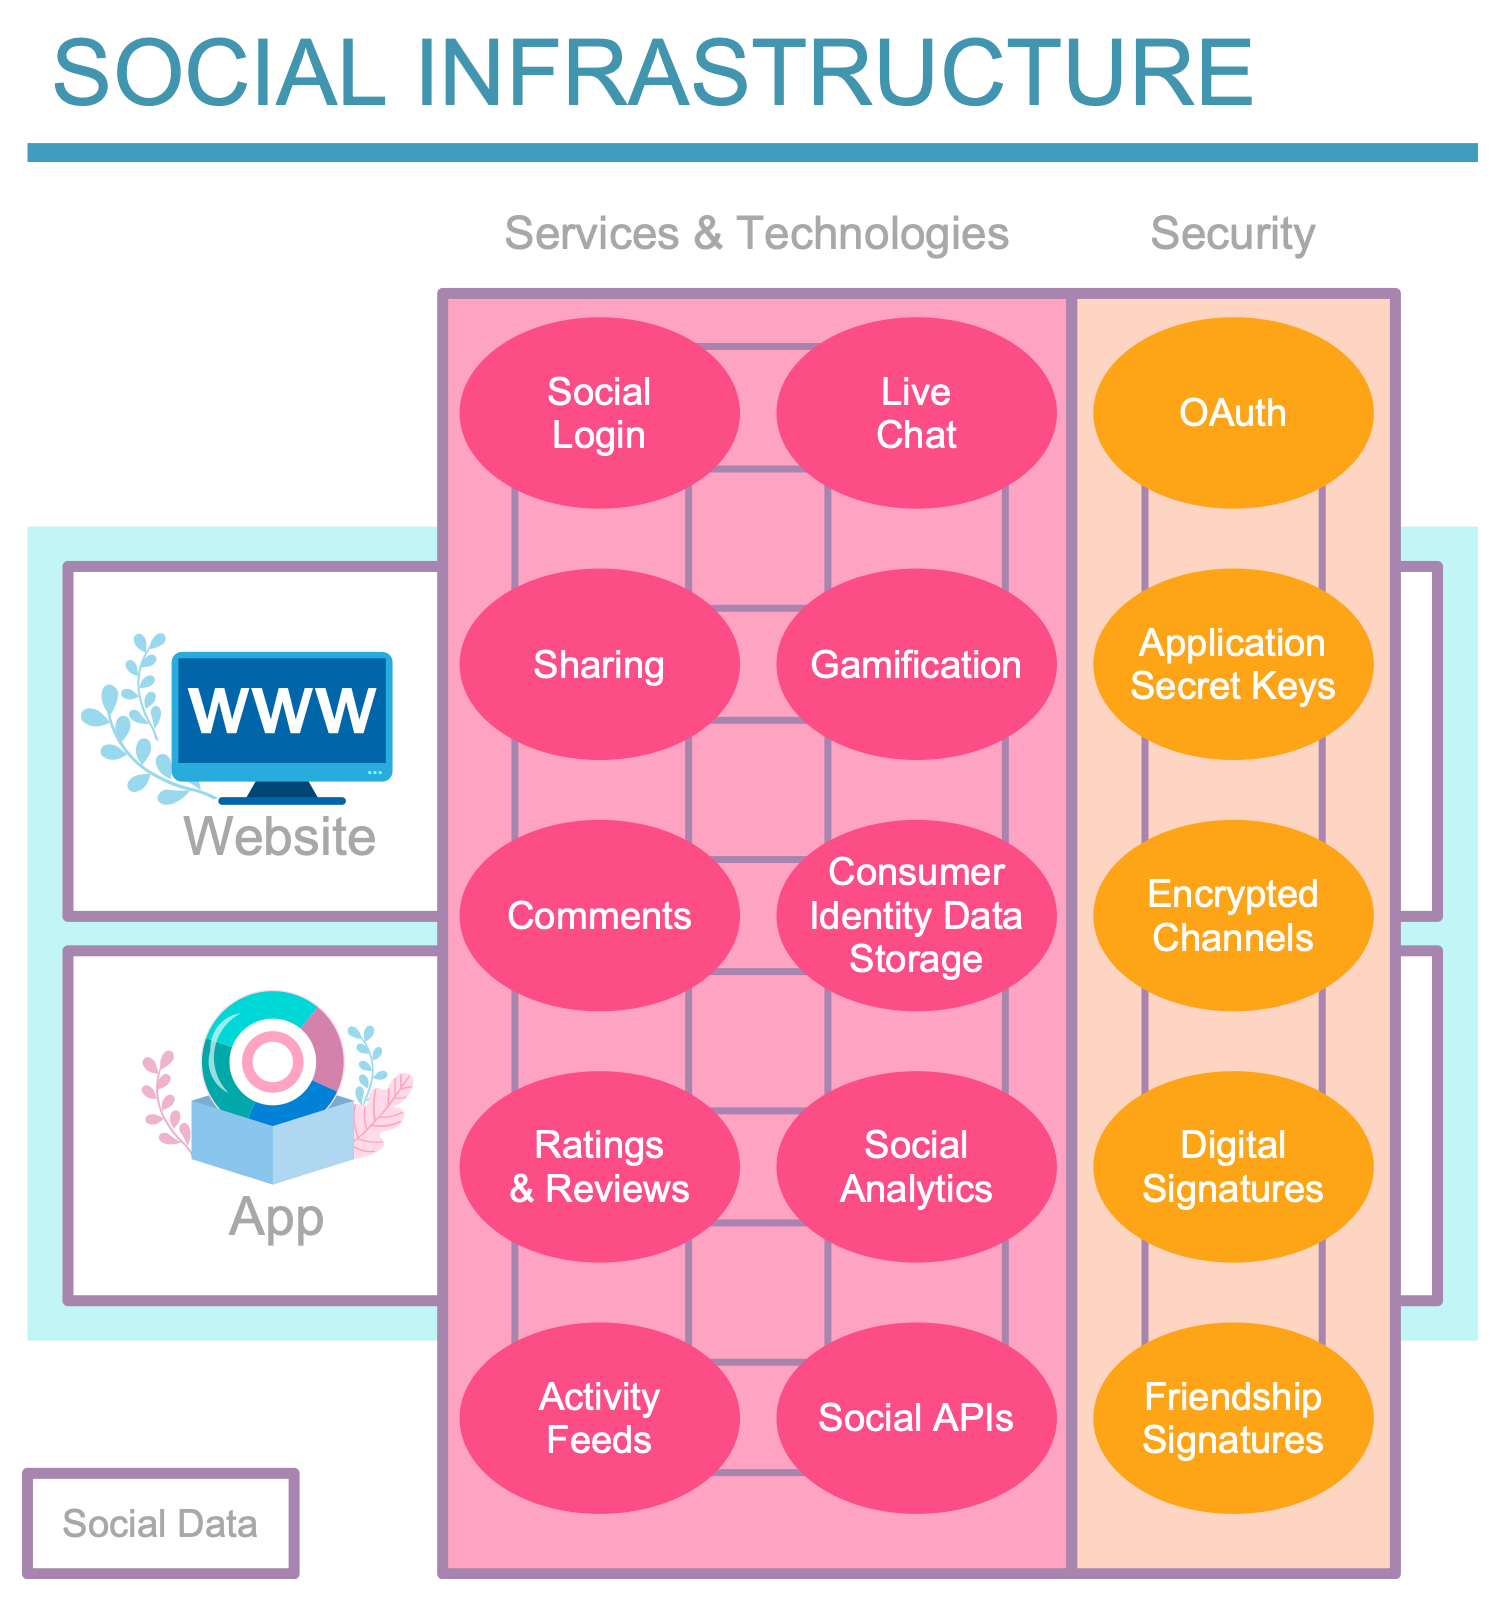
Example 14: Social Infrastructure
This diagram was created in ConceptDraw DIAGRAM using the combination of libraries from the Mass Media Infographics Solution. An experienced user spent 15 minutes creating this sample.
This sample focuses on social infrastructure, which is part of the infrastructure sector. It includes a set of industries and enterprises that provide social services, thereby ensuring a good quality of life for the population, increasing social comfort and affecting economic activity, human competitiveness in science, technology, and skills development. Annually huge amounts of money are invested in the social infrastructure of almost all countries. The unique sets of institutions and ways are developed by each country to improve its social infrastructure. In general, the development of modern technologies and services, technical progress, upgrading equipment and skills, increasing security level and productivity in the field of production contribute to social infrastructure development. The diagram focuses on the great role of IT technologies, the internet, social media, social analytics, applications for various platforms, and other digital services in social infrastructure improvement.
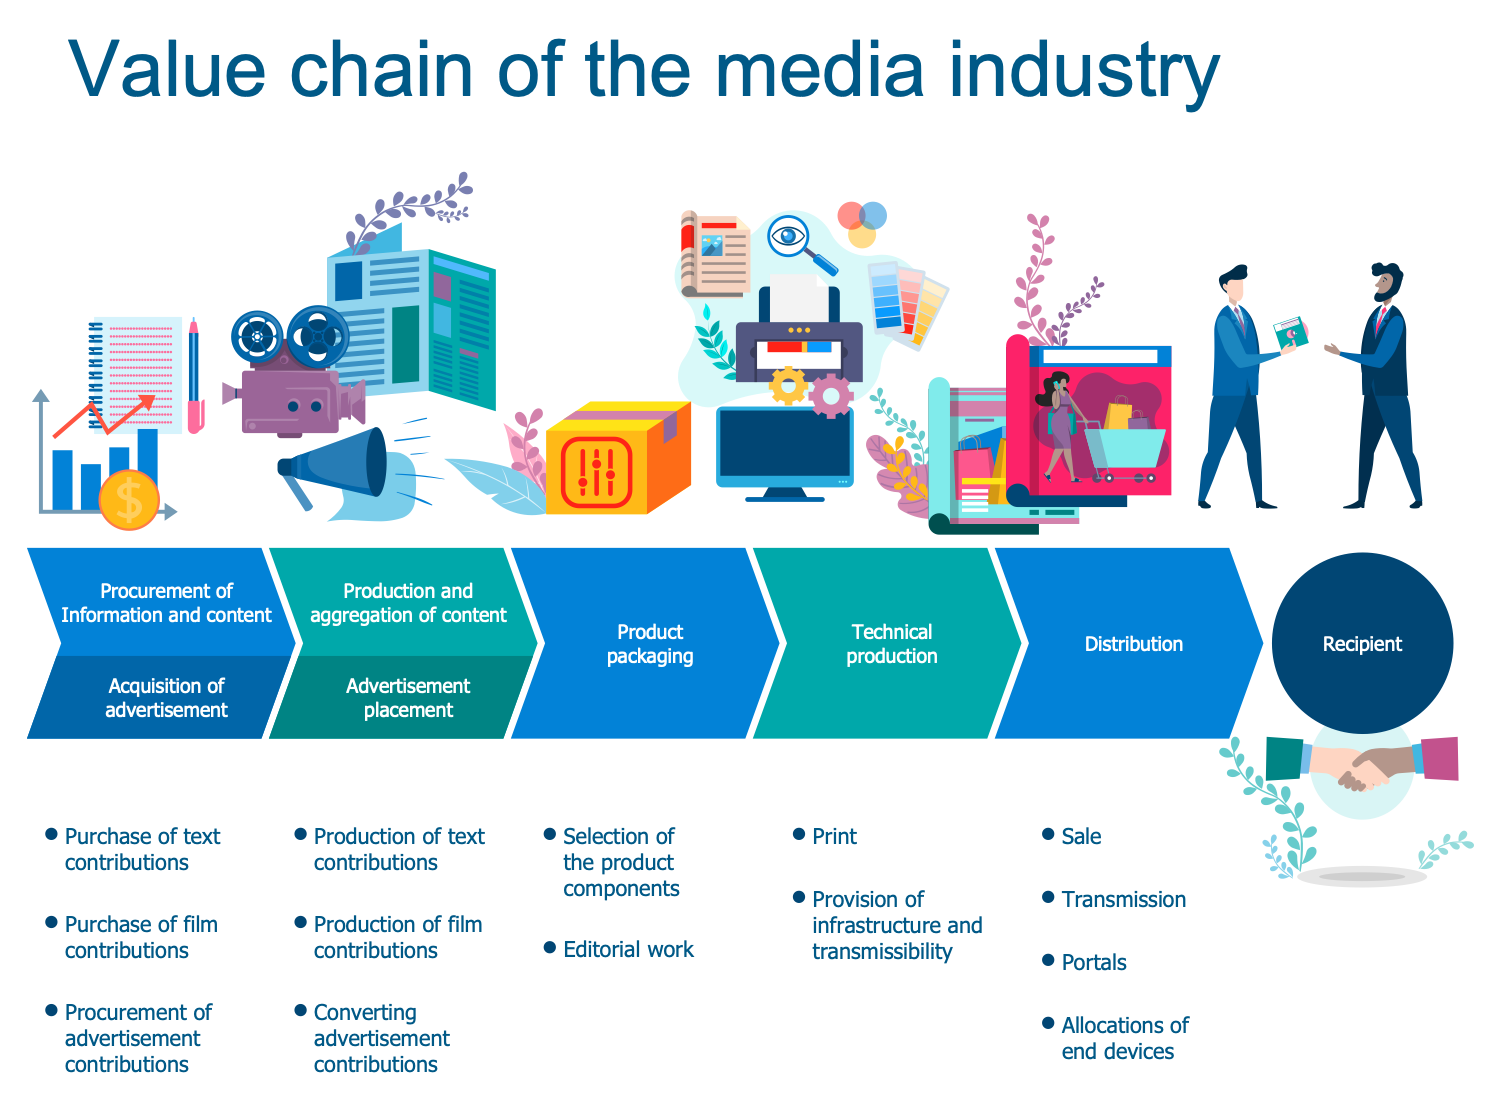
Example 15: Value Chain of the Media Industry
This diagram was created in ConceptDraw DIAGRAM using the combination of libraries from the Mass Media Infographics Solution. An experienced user spent 15 minutes creating this sample.
This sample shows the value chain of the media industry, which extends Michael Porter’s concept, describes the basic principles of the media industry and how to create it until the information and content are delivered to the recipients. In order to understand the specifics of this industry, the most important stages within it were identified and presented in a visual form. Now, it is possible to analyze each stage of the activity more closely, to understand its economic specifics more clearly, and to find ways to optimize each stage of this process. Being a tool of strategic analysis, this value chain allows you to study and analyze the activities for the purpose of strategic planning in the media industry, as well as really effectively identify the sources of competitive advantage. The first step is the procurement of information and content and acquisition of advertisement. The second step is the production and aggregation of content and advertising. Then follow the product packaging, technical production, and distribution.
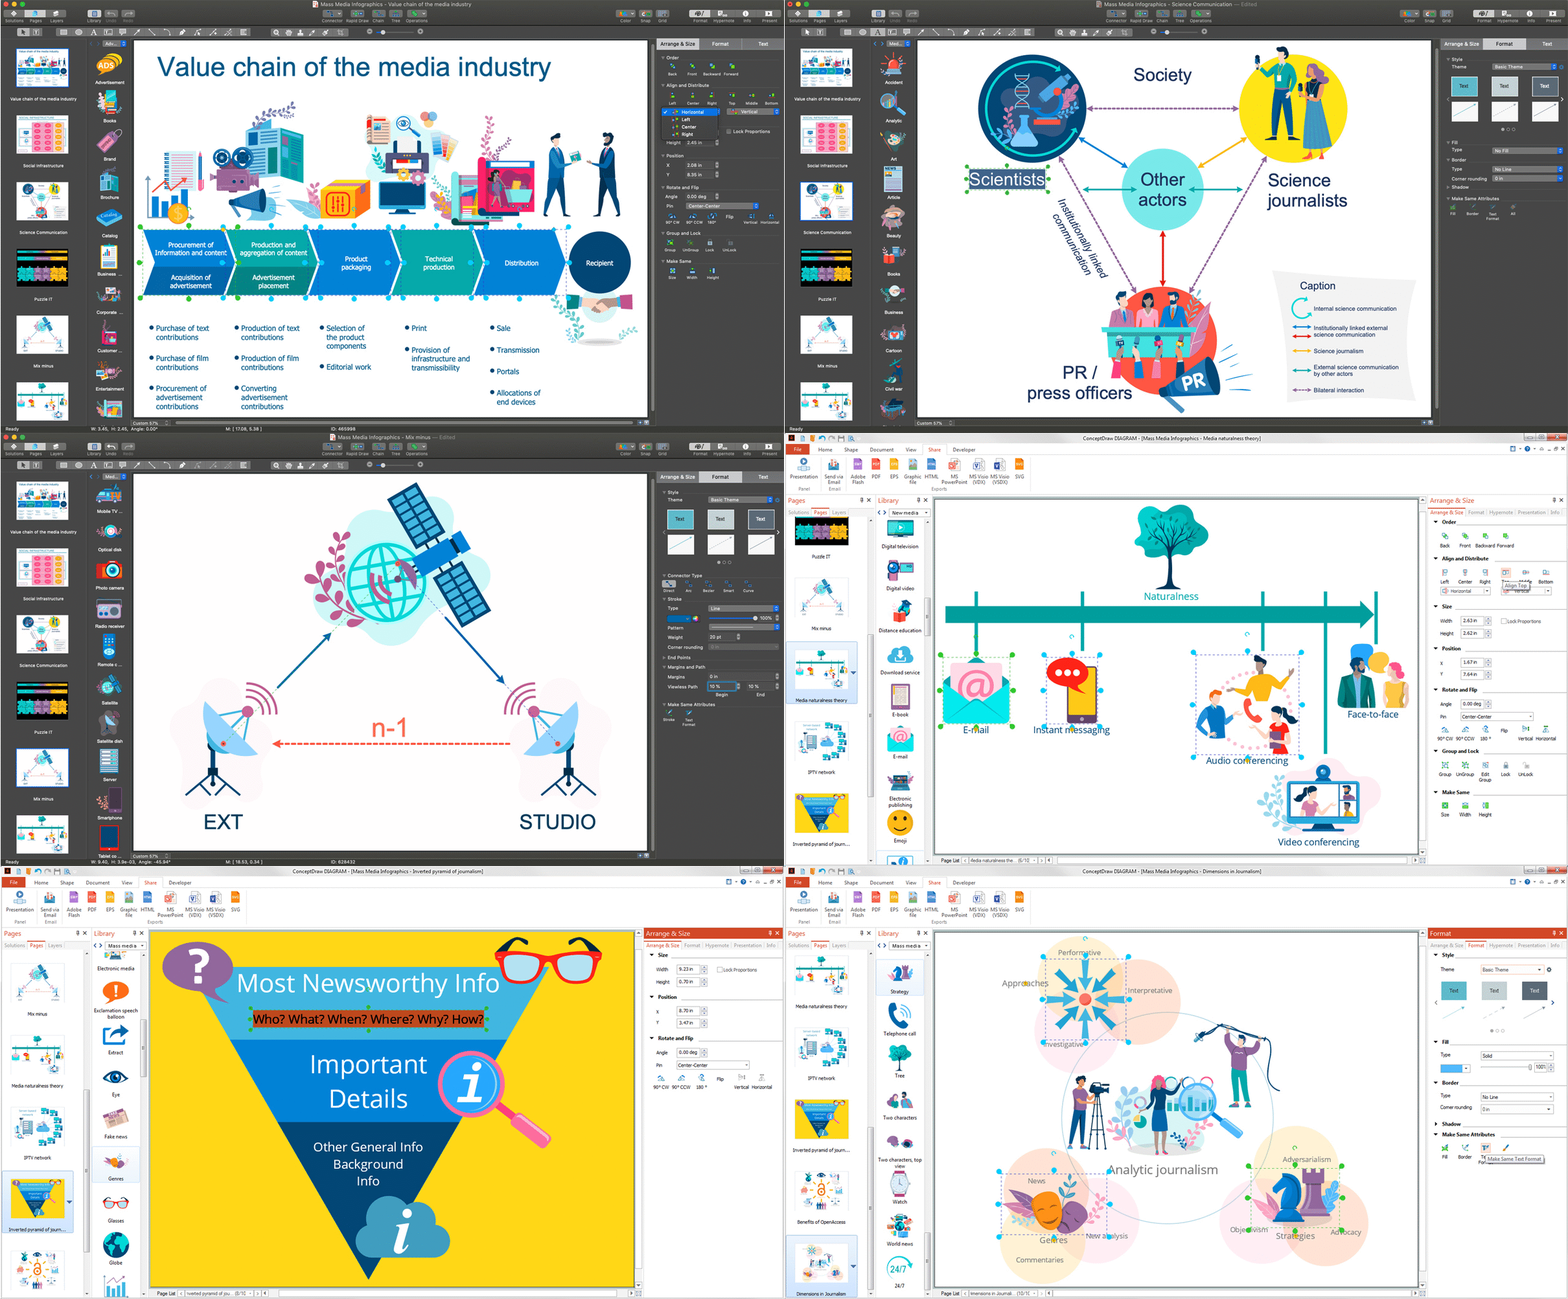
Inside
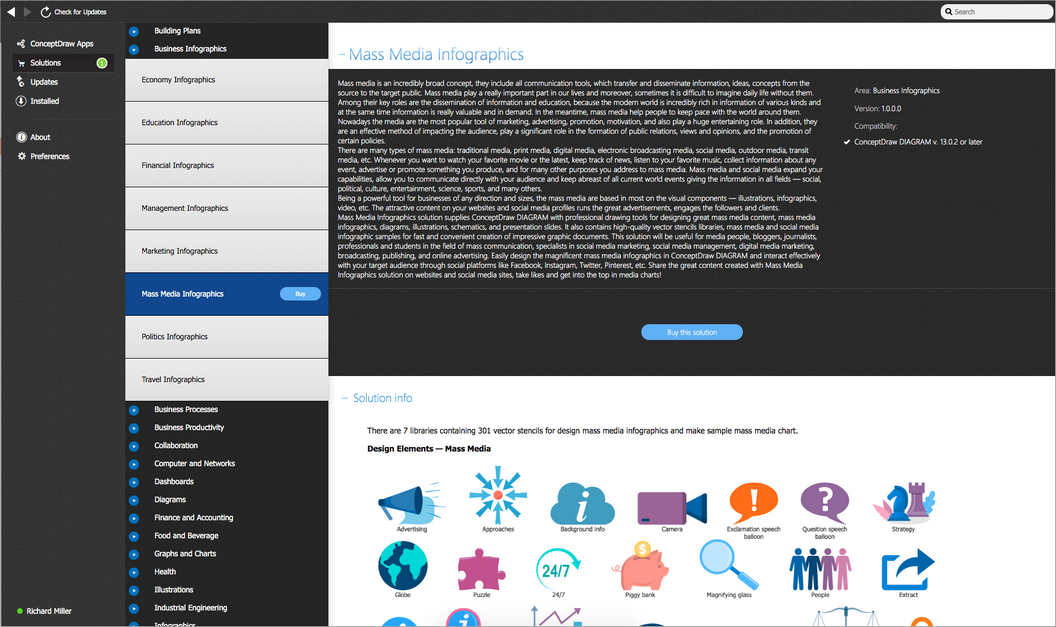
What I Need to Get Started
After ConceptDraw DIAGRAM is installed, the Mass Media Infographics solution can be purchased either from the Business Infographics area of ConceptDraw STORE itself or from our online store. Thus, you will be able to use the Mass Media Infographics solution straight after.
How to install
First of all, make sure that both ConceptDraw STORE and ConceptDraw DIAGRAM applications are downloaded and installed on your computer. Next, install the Mass Media Infographics solution from the ConceptDraw STORE to use it in the ConceptDraw DIAGRAM application.
Start using
Start using the Mass Media Infographics solution to make the professionally looking illustrations by adding the design elements taken from the stencil libraries and editing the pre-made examples that can be found there.
