- Electric and Telecom Plans Free
- Fire and Emergency Plans Free
- Floor Plans Free
- Plant Layout Plans Free
- School and Training Plans Free
- Seating Plans Free
- Security and Access Plans Free
- Site Plans Free
- Sport Field Plans Free
- Business Process Diagrams Free
- Business Process Mapping Free
- Classic Business Process Modeling Free
- Cross-Functional Flowcharts Free
- Event-driven Process Chain Diagrams Free
- IDEF Business Process Diagrams Free
- Logistics Flow Charts Free
- Workflow Diagrams Free
- ConceptDraw Dashboard for Facebook Free
- Mind Map Exchange Free
- MindTweet Free
- Note Exchange Free
- Project Exchange Free
- Social Media Response Free
- Active Directory Diagrams Free
- AWS Architecture Diagrams Free
- Azure Architecture Free
- Cisco Network Diagrams Free
- Cisco Networking Free
- Cloud Computing Diagrams Free
- Computer Network Diagrams Free
- Google Cloud Platform Free
- Interactive Voice Response Diagrams Free
- Network Layout Floor Plans Free
- Network Security Diagrams Free
- Rack Diagrams Free
- Telecommunication Network Diagrams Free
- Vehicular Networking Free
- Wireless Networks Free
- Comparison Dashboard Free
- Composition Dashboard Free
- Correlation Dashboard Free
- Frequency Distribution Dashboard Free
- Meter Dashboard Free
- Spatial Dashboard Free
- Status Dashboard Free
- Time Series Dashboard Free
- Basic Circle-Spoke Diagrams Free
- Basic Circular Arrows Diagrams Free
- Basic Venn Diagrams Free
- Block Diagrams Free
- Concept Maps Free
- Family Tree Free
- Flowcharts Free
- Basic Area Charts Free
- Basic Bar Graphs Free
- Basic Divided Bar Diagrams Free
- Basic Histograms Free
- Basic Line Graphs Free
- Basic Picture Graphs Free
- Basic Pie Charts Free
- Basic Scatter Diagrams Free
- Aerospace and Transport Free
- Artwork Free
- Audio, Video, Media Free
- Business and Finance Free
- Computers and Communications Free
- Holiday Free
- Manufacturing and Maintenance Free
- Nature Free
- People Free
- Presentation Clipart Free
- Safety and Security Free
- Analog Electronics Free
- Audio and Video Connectors Free
- Basic Circuit Diagrams Free
- Chemical and Process Engineering Free
- Digital Electronics Free
- Electrical Engineering Free
- Electron Tube Circuits Free
- Electronic Block Diagrams Free
- Fault Tree Analysis Diagrams Free
- GHS Hazard Pictograms Free
- Home Automation and Wiring Free
- Mechanical Engineering Free
- One-line Diagrams Free
- Power Сircuits Free
- Specification and Description Language (SDL) Free
- Telecom and AV Circuits Free
- Transport Hazard Pictograms Free
- Data-driven Infographics Free
- Pictorial Infographics Free
- Spatial Infographics Free
- Typography Infographics Free
- Calendars Free
- Decision Making Free
- Enterprise Architecture Diagrams Free
- Fishbone Diagrams Free
- Organizational Charts Free
- Plan-Do-Check-Act (PDCA) Free
- Seven Management and Planning Tools Free
- SWOT and TOWS Matrix Diagrams Free
- Timeline Diagrams Free
- Australia Map Free
- Continent Maps Free
- Directional Maps Free
- Germany Map Free
- Metro Map Free
- UK Map Free
- USA Maps Free
- Customer Journey Mapping Free
- Marketing Diagrams Free
- Matrices Free
- Pyramid Diagrams Free
- Sales Dashboard Free
- Sales Flowcharts Free
- Target and Circular Diagrams Free
- Cash Flow Reports Free
- Current Activities Reports Free
- Custom Excel Report Free
- Knowledge Reports Free
- MINDMAP Reports Free
- Overview Reports Free
- PM Agile Free
- PM Dashboards Free
- PM Docs Free
- PM Easy Free
- PM Meetings Free
- PM Planning Free
- PM Presentations Free
- PM Response Free
- Resource Usage Reports Free
- Visual Reports Free
- House of Quality Free
- Quality Mind Map Free
- Total Quality Management TQM Diagrams Free
- Value Stream Mapping Free
- Astronomy Free
- Biology Free
- Chemistry Free
- Language Learning Free
- Mathematics Free
- Physics Free
- Piano Sheet Music Free
- Android User Interface Free
- Class Hierarchy Tree Free
- Data Flow Diagrams (DFD) Free
- DOM Tree Free
- Entity-Relationship Diagram (ERD) Free
- EXPRESS-G data Modeling Diagram Free
- IDEF0 Diagrams Free
- iPhone User Interface Free
- Jackson Structured Programming (JSP) Diagrams Free
- macOS User Interface Free
- Object-Role Modeling (ORM) Diagrams Free
- Rapid UML Free
- SYSML Free
- Website Wireframe Free
- Windows 10 User Interface Free
Oil and Gas
The oil and natural gas sector is the largest and most important in global economics and politics. It is a highly complex and capital-intensive industry, but at the same time influential. It affects national security, geopolitics, elections, is a subject of international negotiations and conflicts. As the global demand for oil and gas products grows, the oil and gas industry strengthens its technological and financial position, develops more and more efficient production and processing technologies. The turnovers of production and sales volumes increase, at the simultaneous decreasing investment and reducing production costs. The prices for oil and gas are always in the focus of global economics.
The oil and gas industry and its products play an important role in modern society and affect everyone's life. Oil and gas are the main sources of fuel and provide more than fifty percent of the world's energy demand. Moreover, these are resources for the chemical, automotive, pharmaceutical and a number of other industries. Oil and gas are related to electricity generation, a variety of petrochemicals, paints, asphalt pavement, and much more.
This industry includes three segments: exploration, production and drilling of oil and gas; an intermediate stream containing transportation and storage; processing and marketing of products.
Global oil and gas consumption is constantly growing. The processes and systems involved in the production and distribution of oil and gas require modern technological innovations and improvement of operational processes. This applies to both methods of optimization of oil and gas production and also transportation and processing mechanisms. These processes include illustration as a way of visualizing the oil and gas sector, a description of its main activities, and environmental standards. The illustration is used to display the fundamentals of companies involved in this sector, explaining key concepts and standards, and offering new ideas and changes.
The diagrams and illustrations are helpful to evaluate gas and oil refining sector activities in previous years and predict their trends for the future. They are constructed to depict the largest oil and gas producers, consumption markets and the richest oil companies. They allow you to display work processes and highlight the factors that have the greatest impact in the sector. The oil and gas infographics are useful for providing an overview of the prospects and challenges facing the industry and highlighting key nuances.
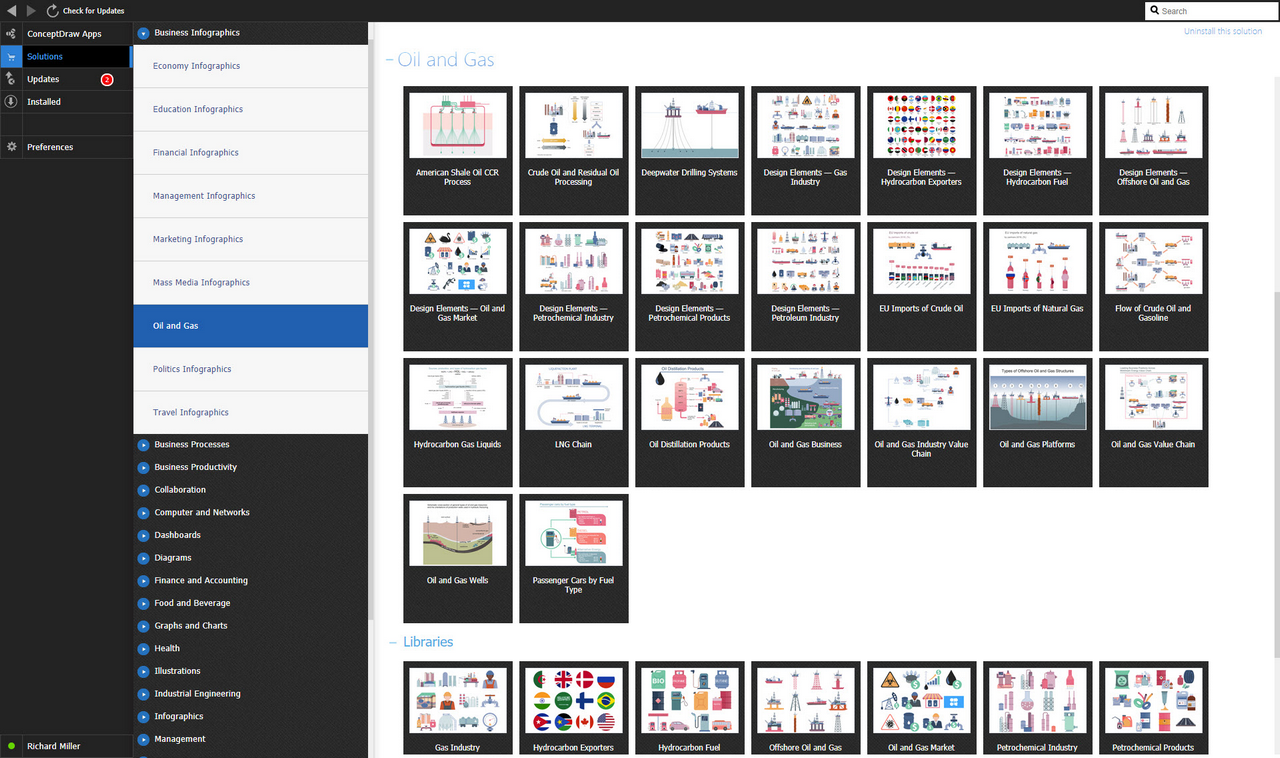
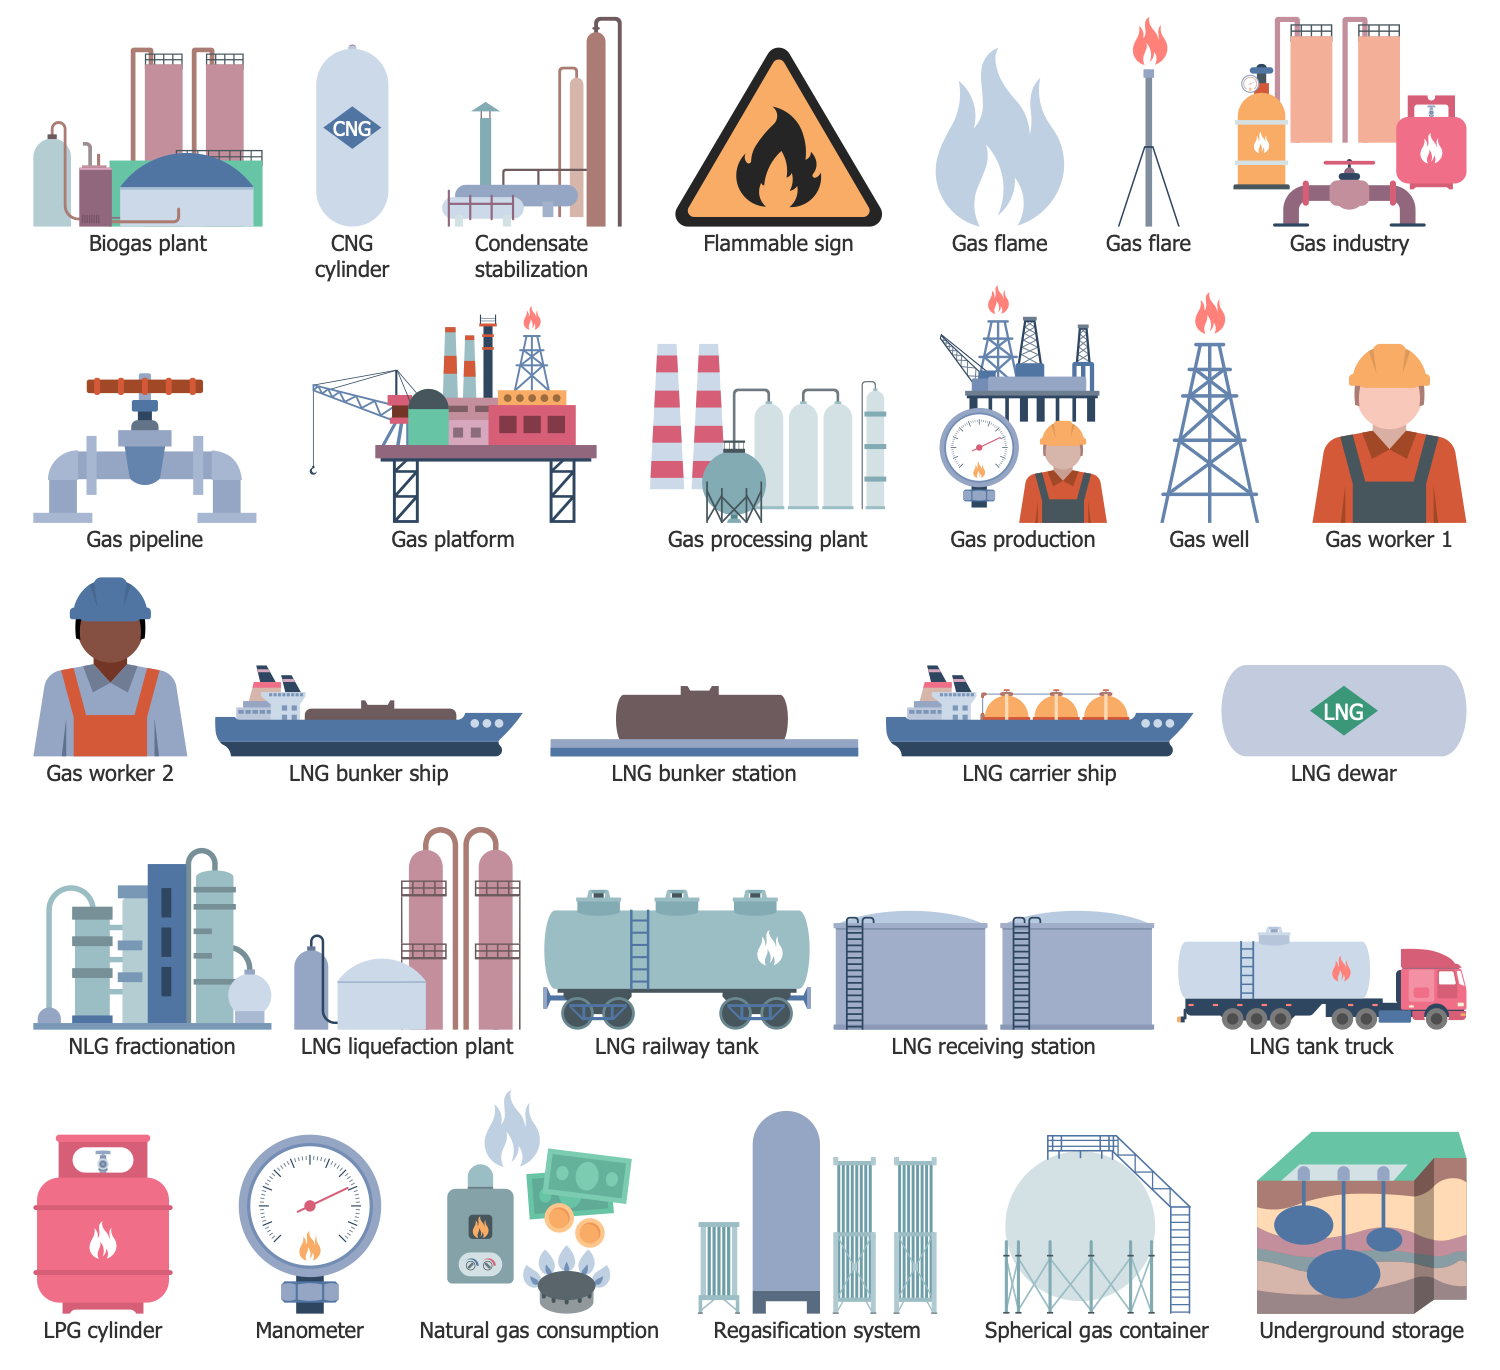
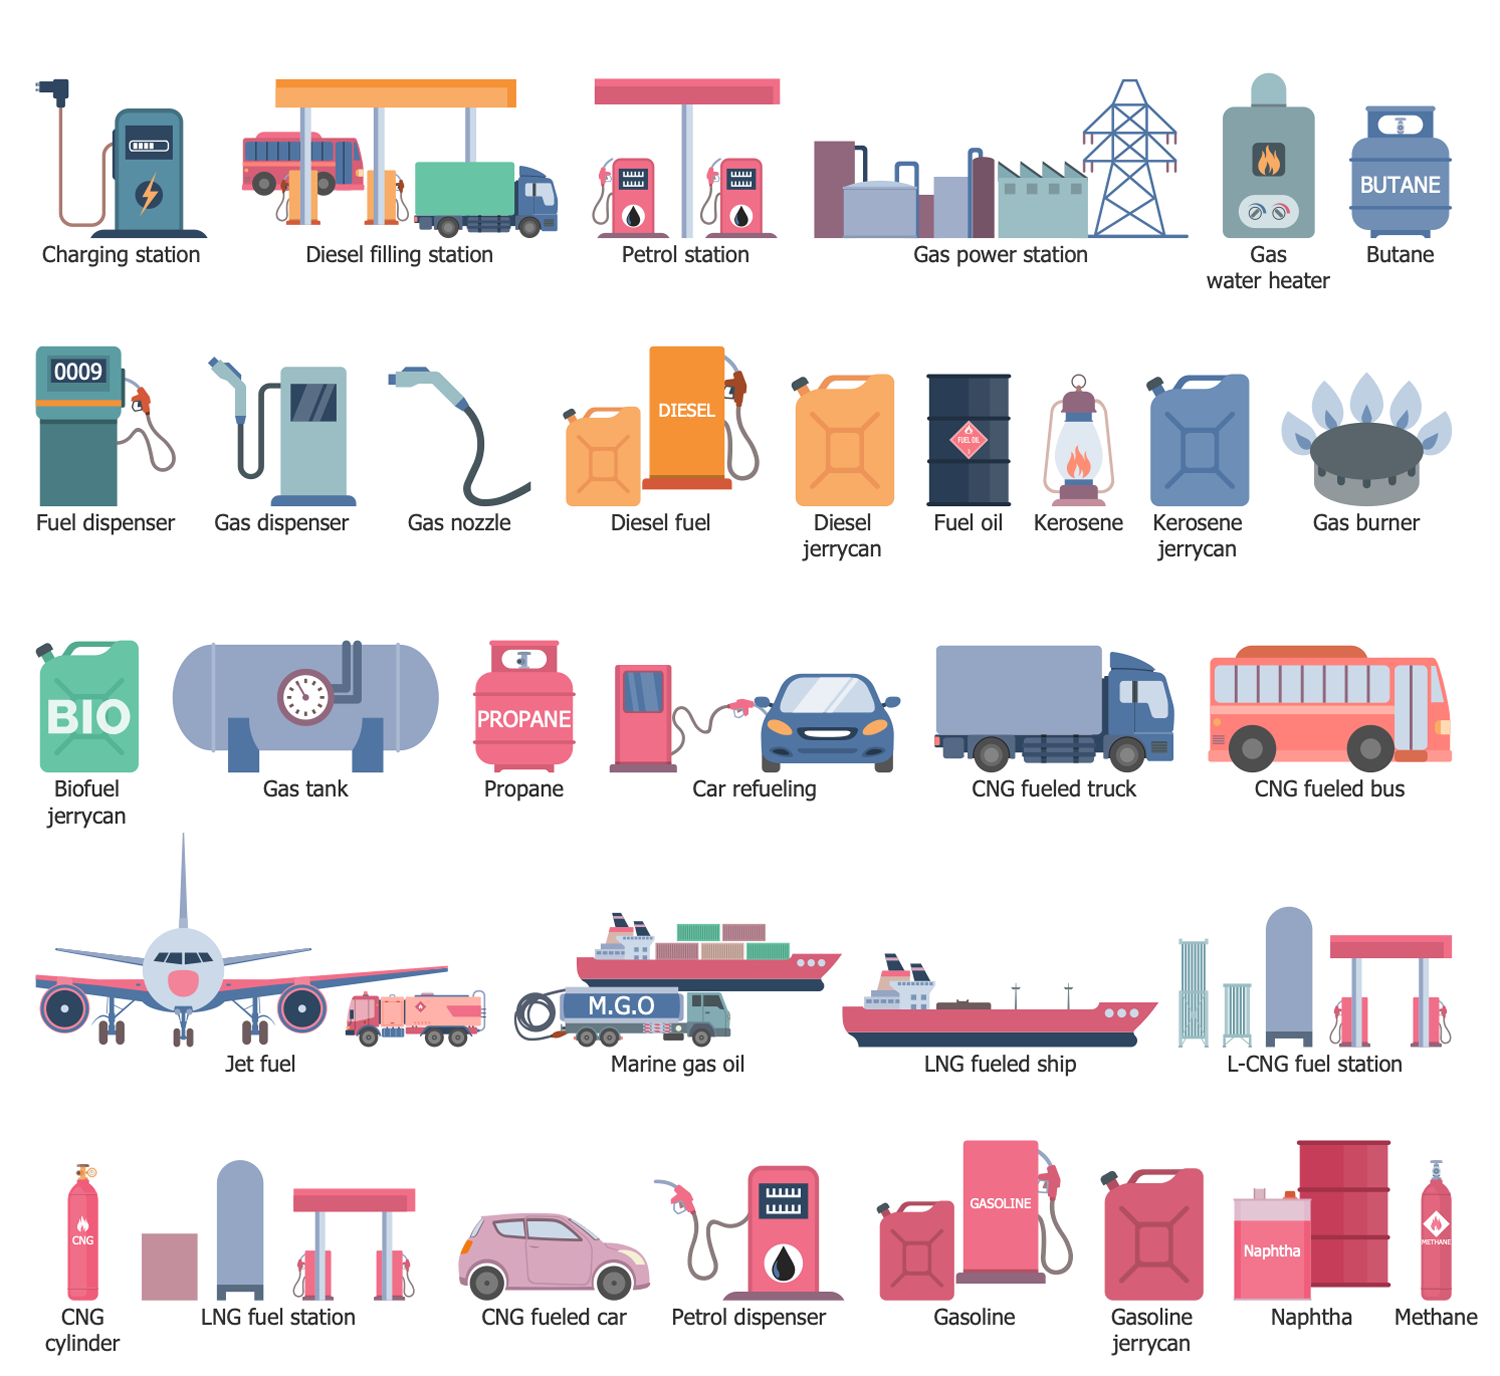
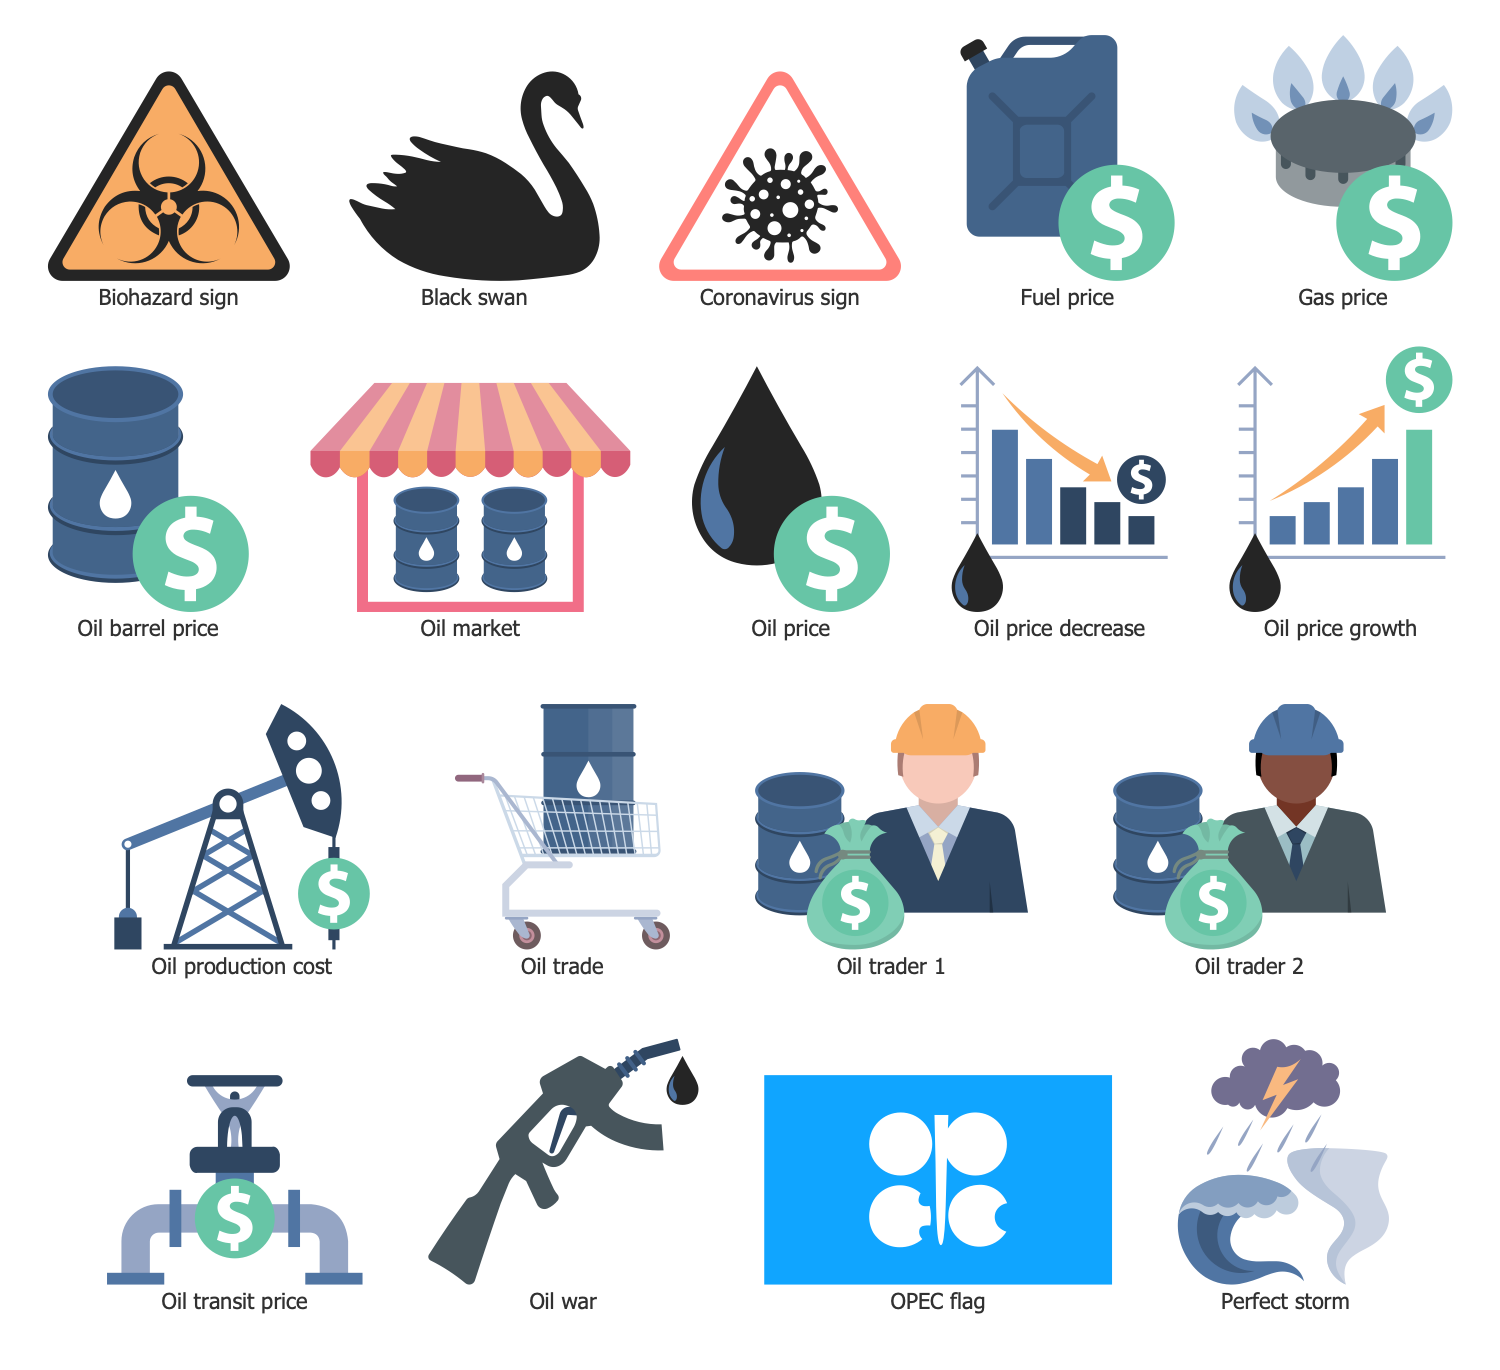
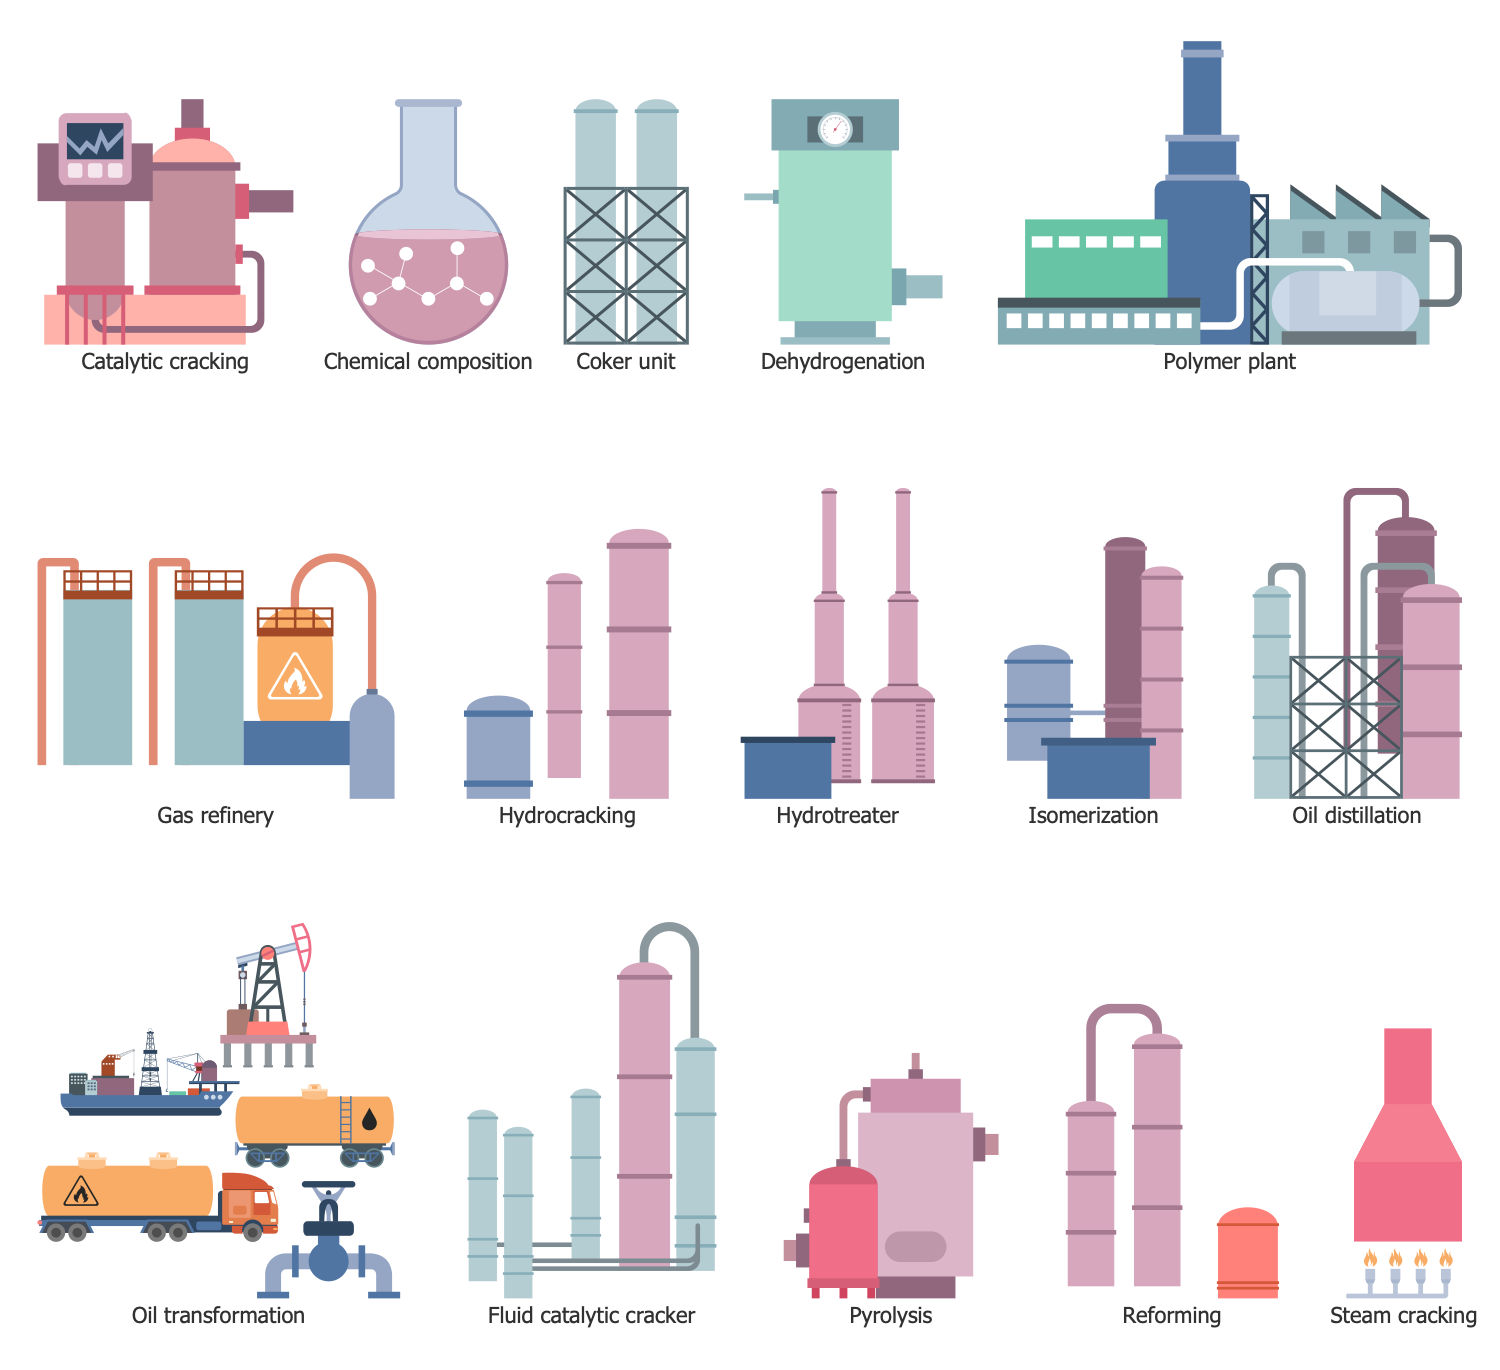
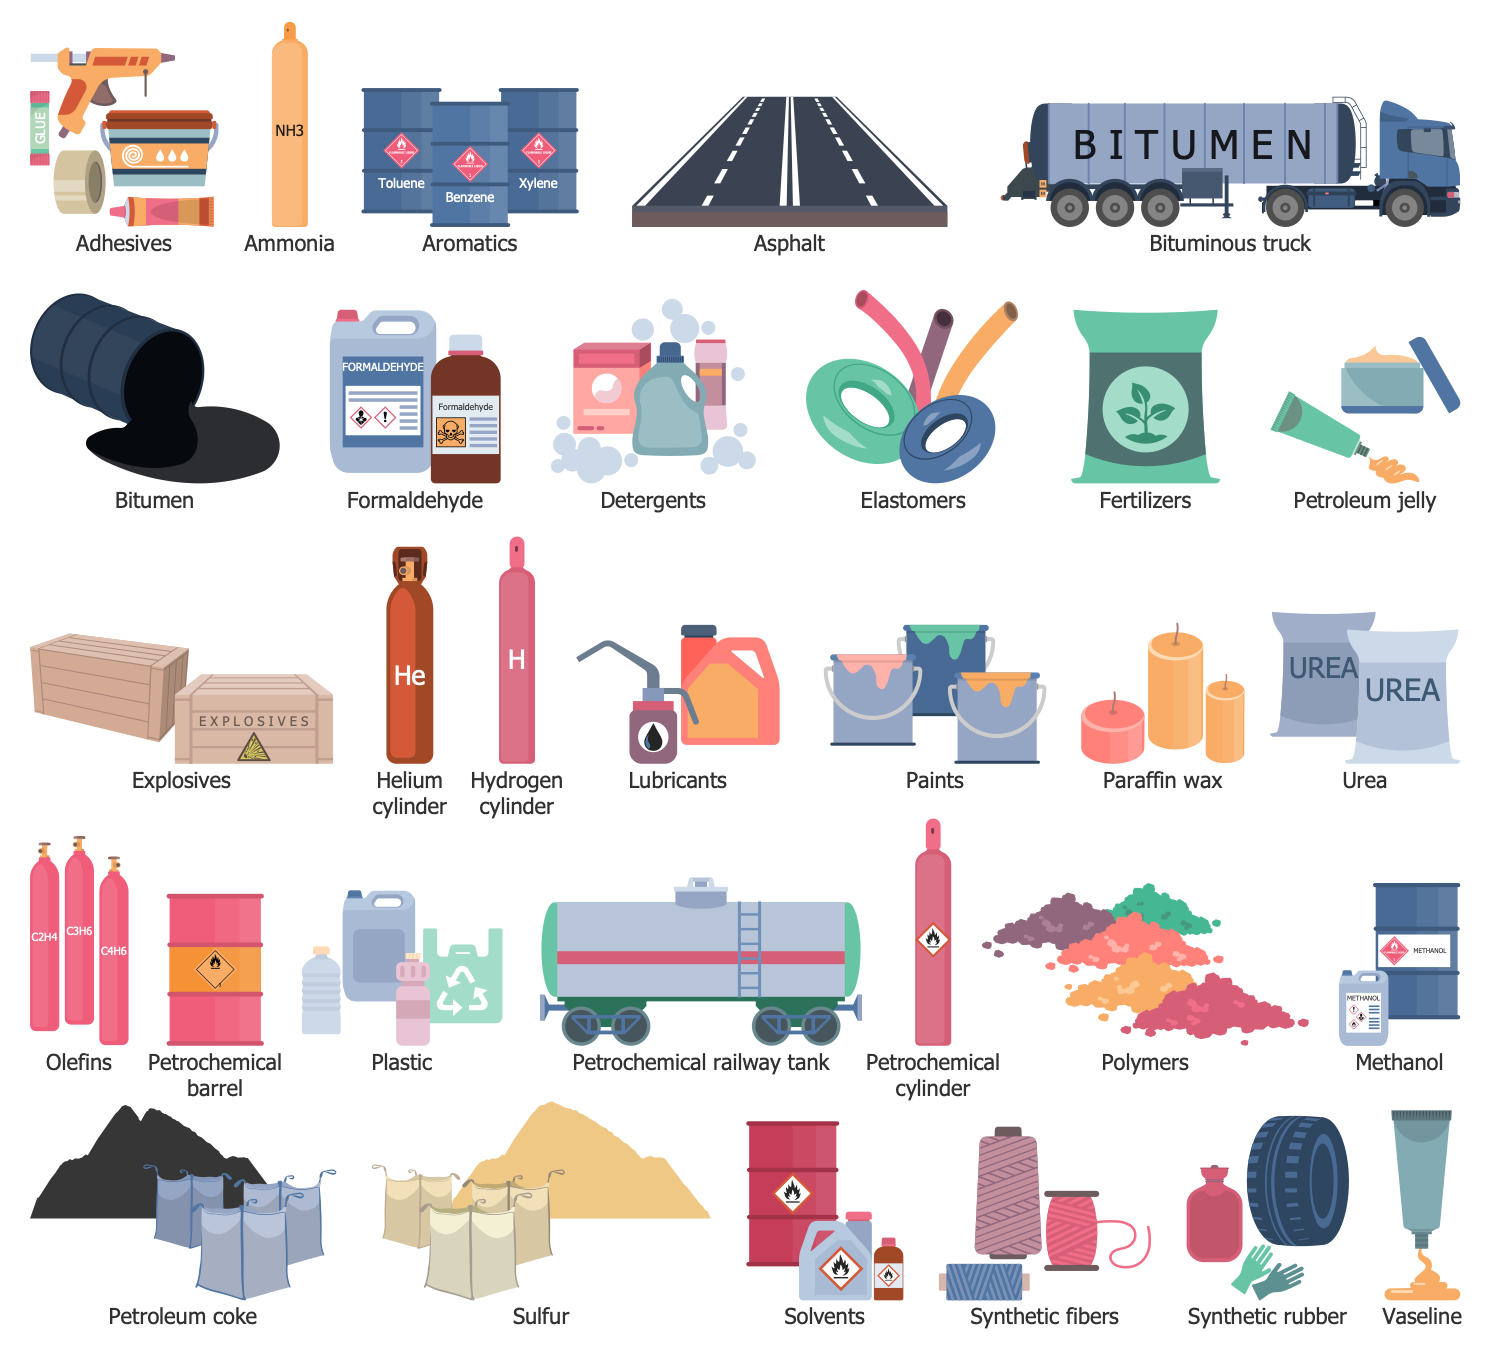
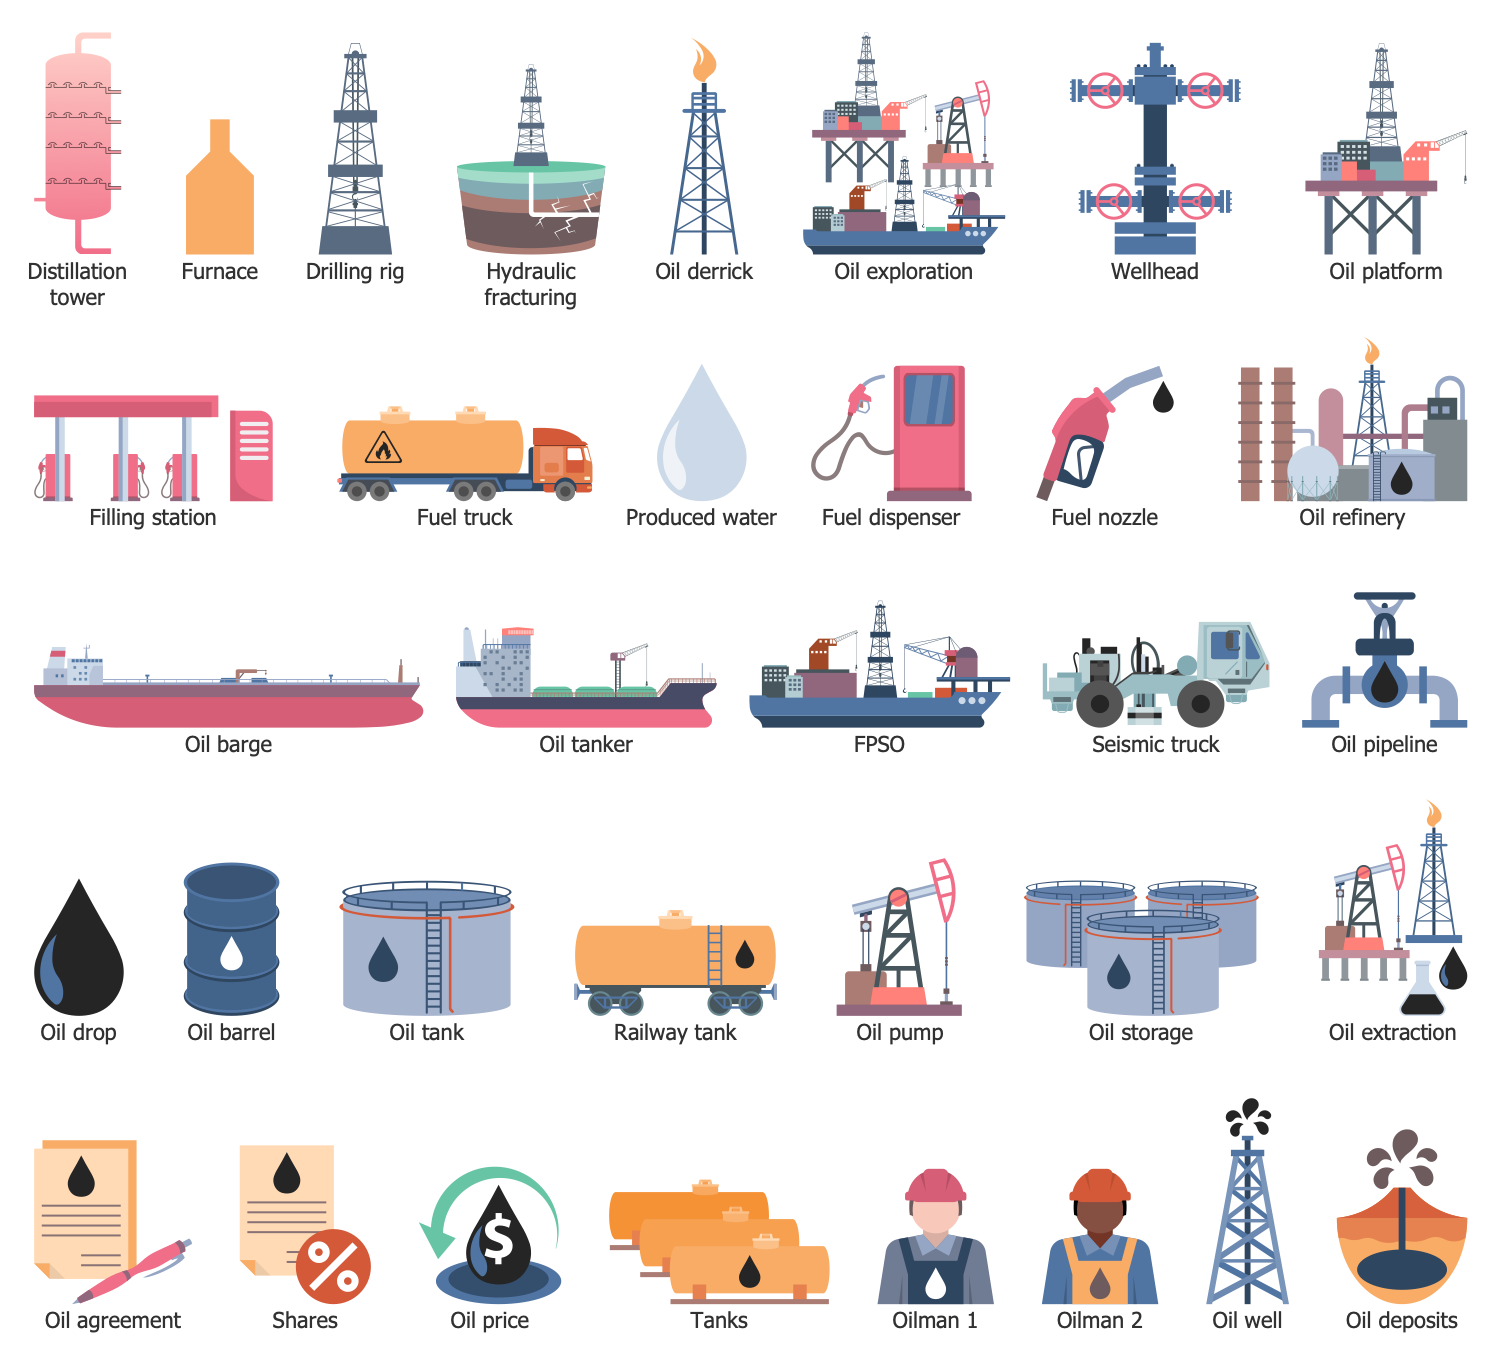
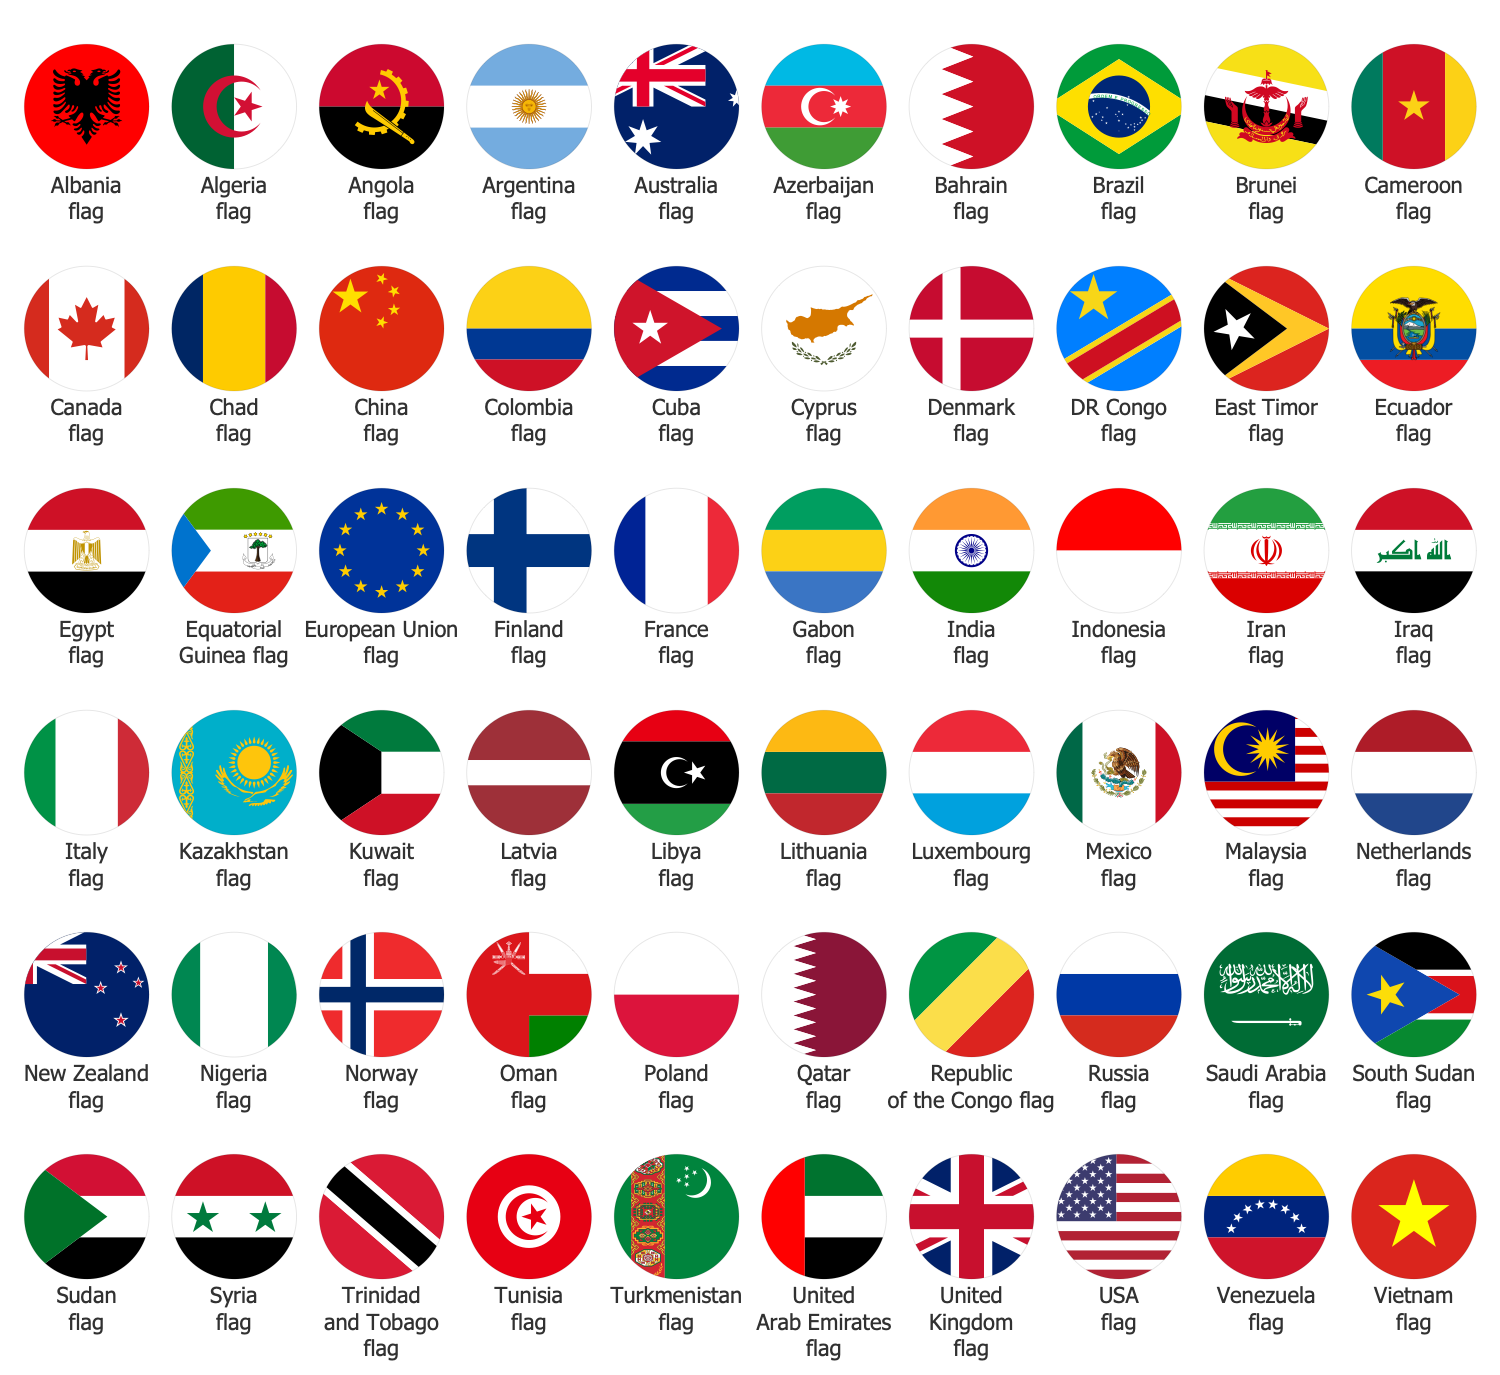
The Oil and Gas solution for ConceptDraw DIAGRAM software provides vector libraries of oil and gas symbols and collection of samples for quick and simple designing the oil and gas industry infographics, illustrations, presentations, diagrams, and oil and gas graphics. The solution libraries are full of icons related to gas and petroleum industries, special symbols for different oil, gas, and petrochemical products, icons of oil refineries and transportation facilities. They include the symbols of equipment for oil and gas production and refueling stations, flags of hydrocarbon exporters, marketing symbols related to the sale of these products and market changes.
The resulting illustrations help to clearly and quickly detail complex information. They are ideal for reporting on the development of best practices in oil and gas exploration and production. Use them to illustrate growth strategies and trends in the oil industry, conduct analysis, forecast the energy industry, and present the results of international energy forums.
-
Buy this solution $25 -
Solution Requirements - This solution requires the following products to be installed:
ConceptDraw DIAGRAM v18 - This solution requires the following products to be installed:
-
Compatibility - Sonoma (14), Sonoma (15)
MS Windows 10, 11 - Sonoma (14), Sonoma (15)
-
Support for this Solution -
Helpdesk
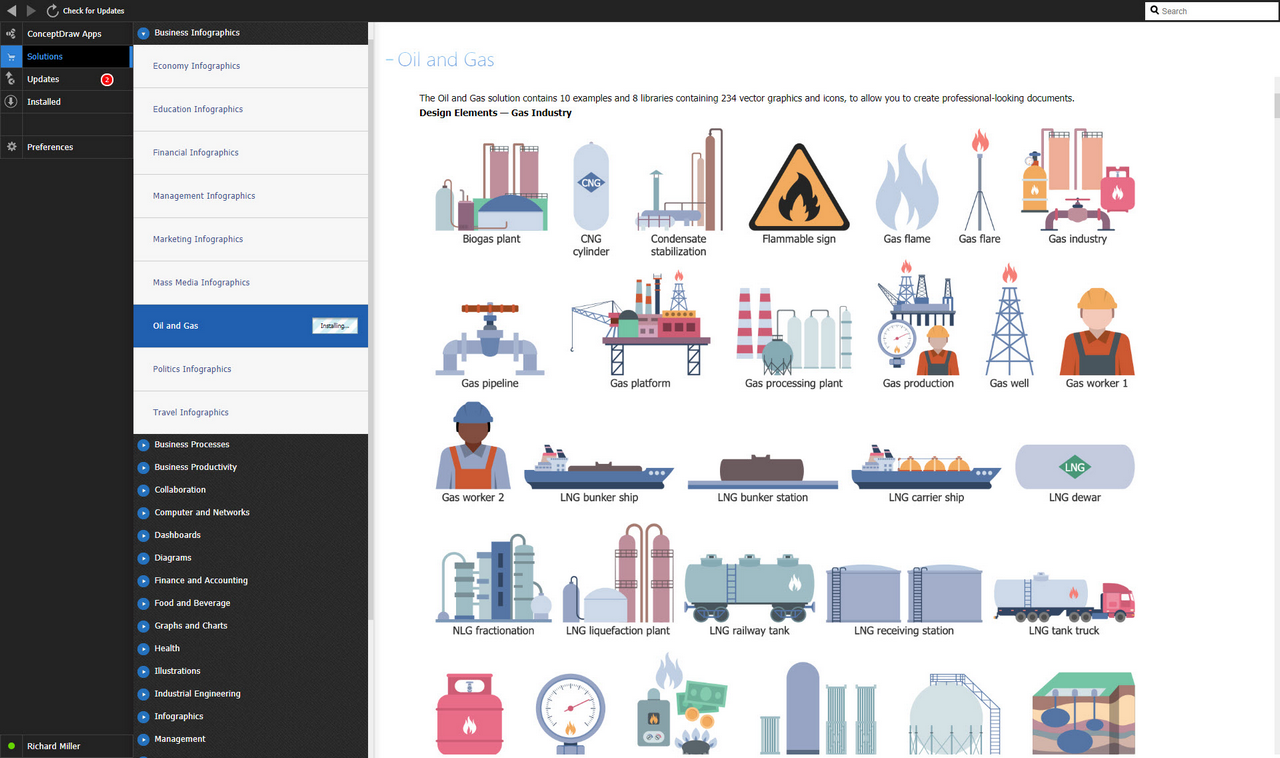
Design Elements — Gas Industry
Design Elements — Hydrocarbon Fuel
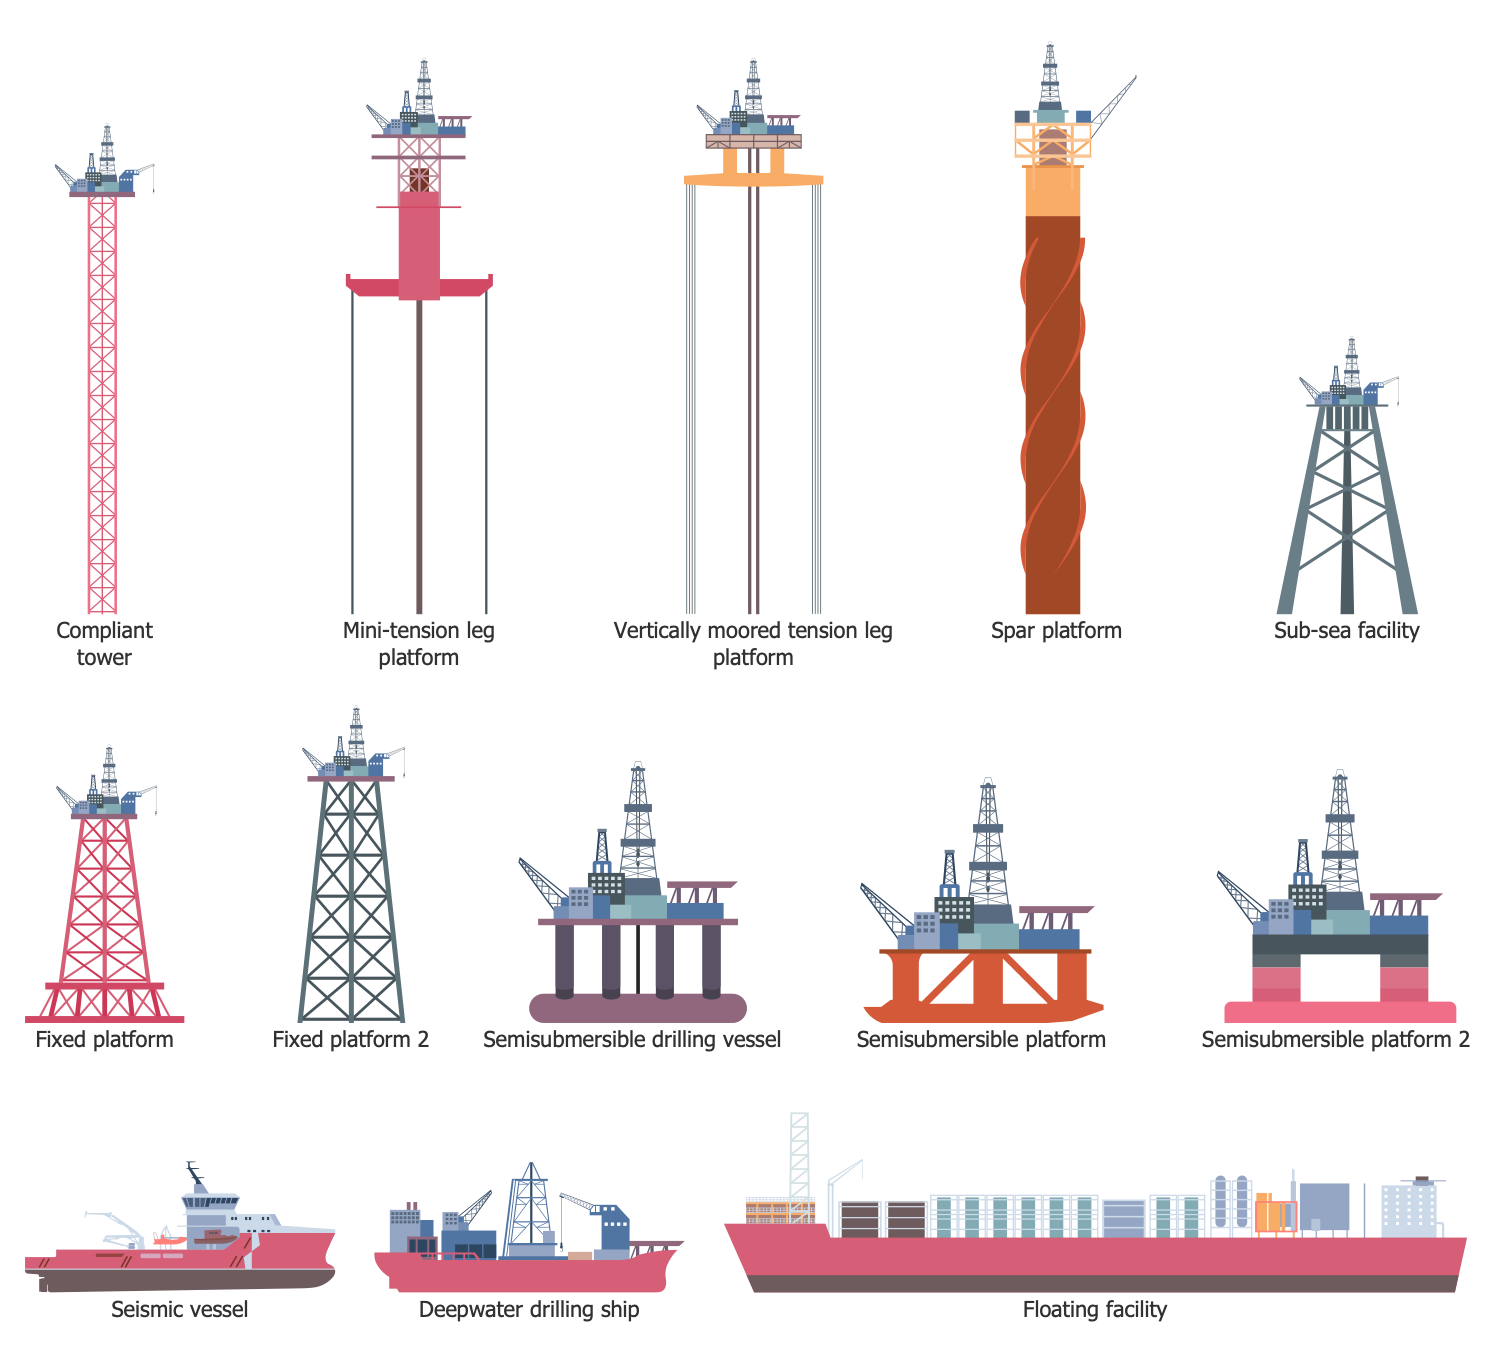
Design Elements — Offshore Oil and Gas
Design Elements — Oil and Gas Market
Design Elements — Petrochemical Industry
Design Elements — Petrochemical Products
Design Elements — Petroleum Industry
Design Elements — Hydrocarbon Exporters
Oil and Gas Examples
There are a few samples that you see on this page which were created in the ConceptDraw DIAGRAM application by using the Oil and Gas solution. Some of the solution's capabilities as well as the professional results which you can achieve are all demonstrated here on this page.
All source documents are vector graphic documents which are always available for modifying, reviewing and/or converting to many different formats, such as MS PowerPoint, PDF file, MS Visio, and many other graphic ones from the ConceptDraw Solution Park or ConceptDraw STORE. The Oil and Gas solution is available to all ConceptDraw DIAGRAM users to get installed and used while working in the ConceptDraw DIAGRAM diagramming and drawing software.
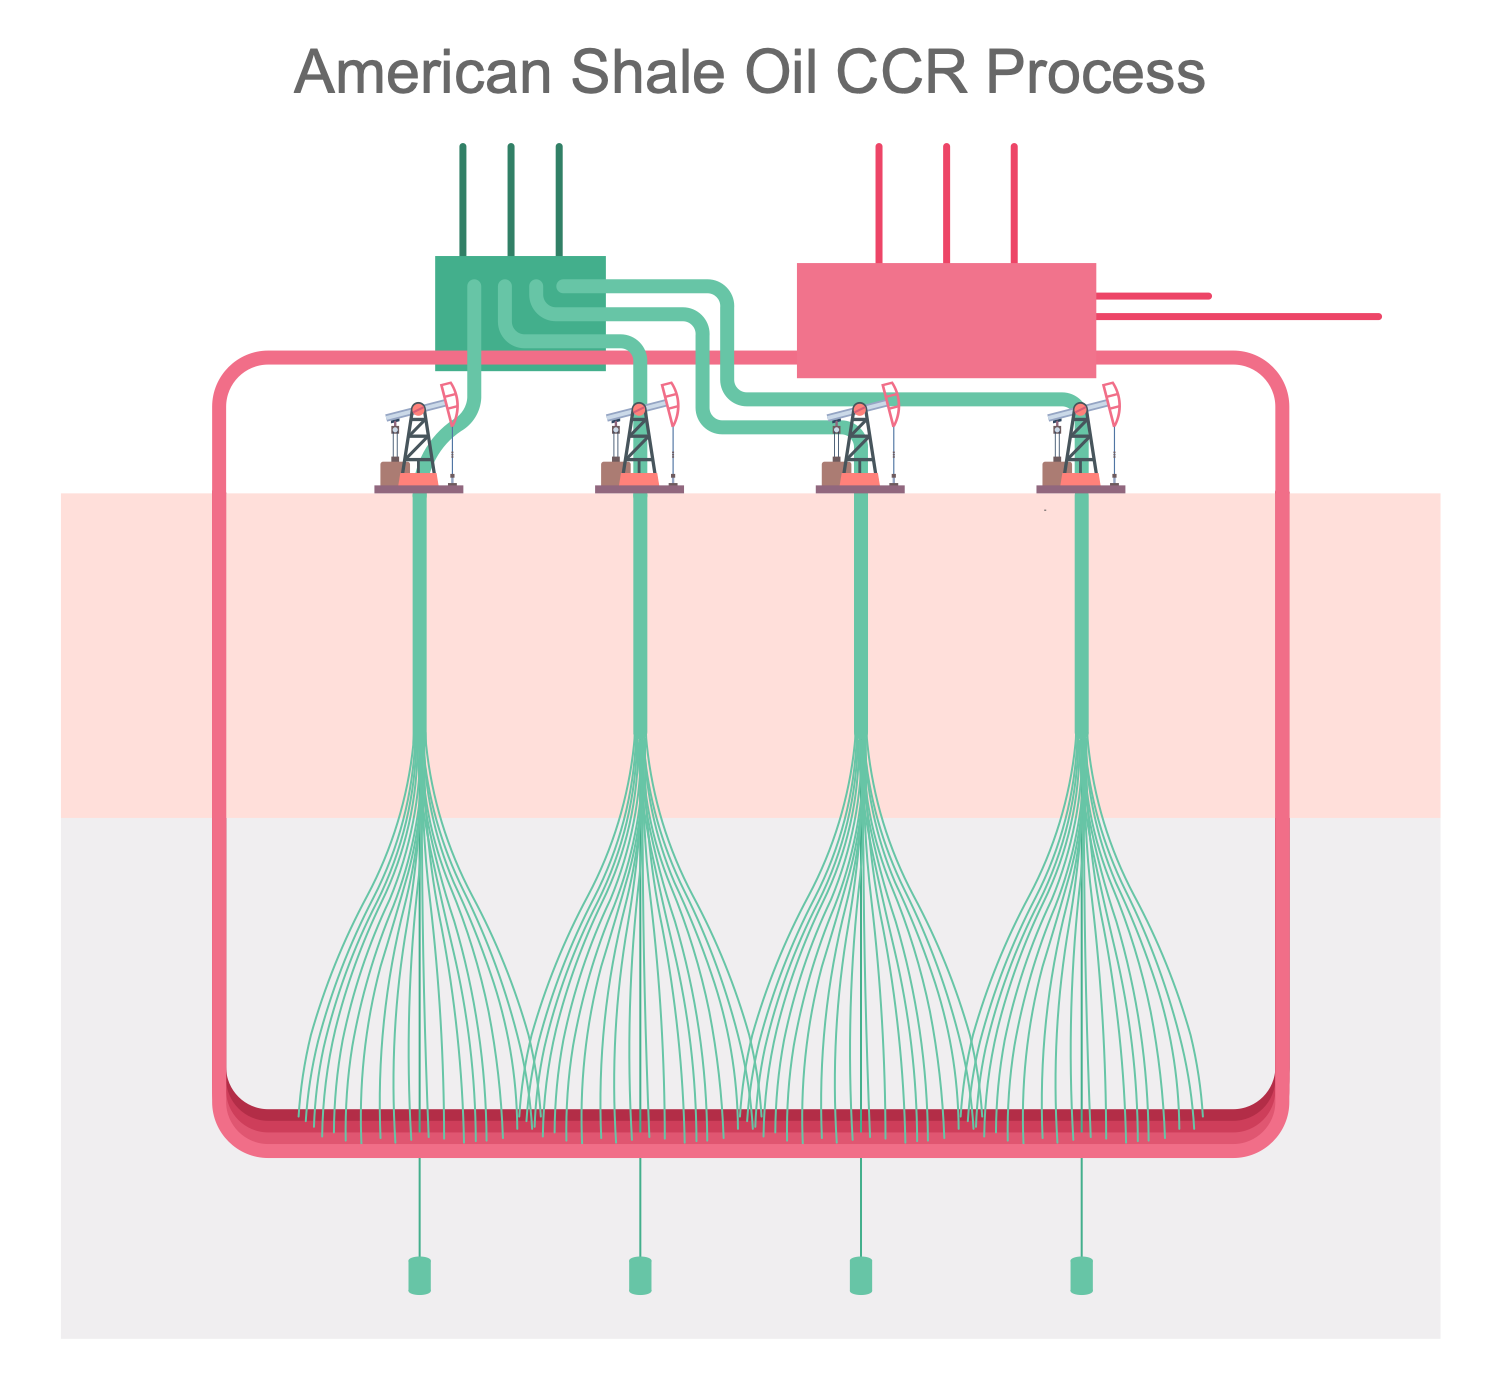
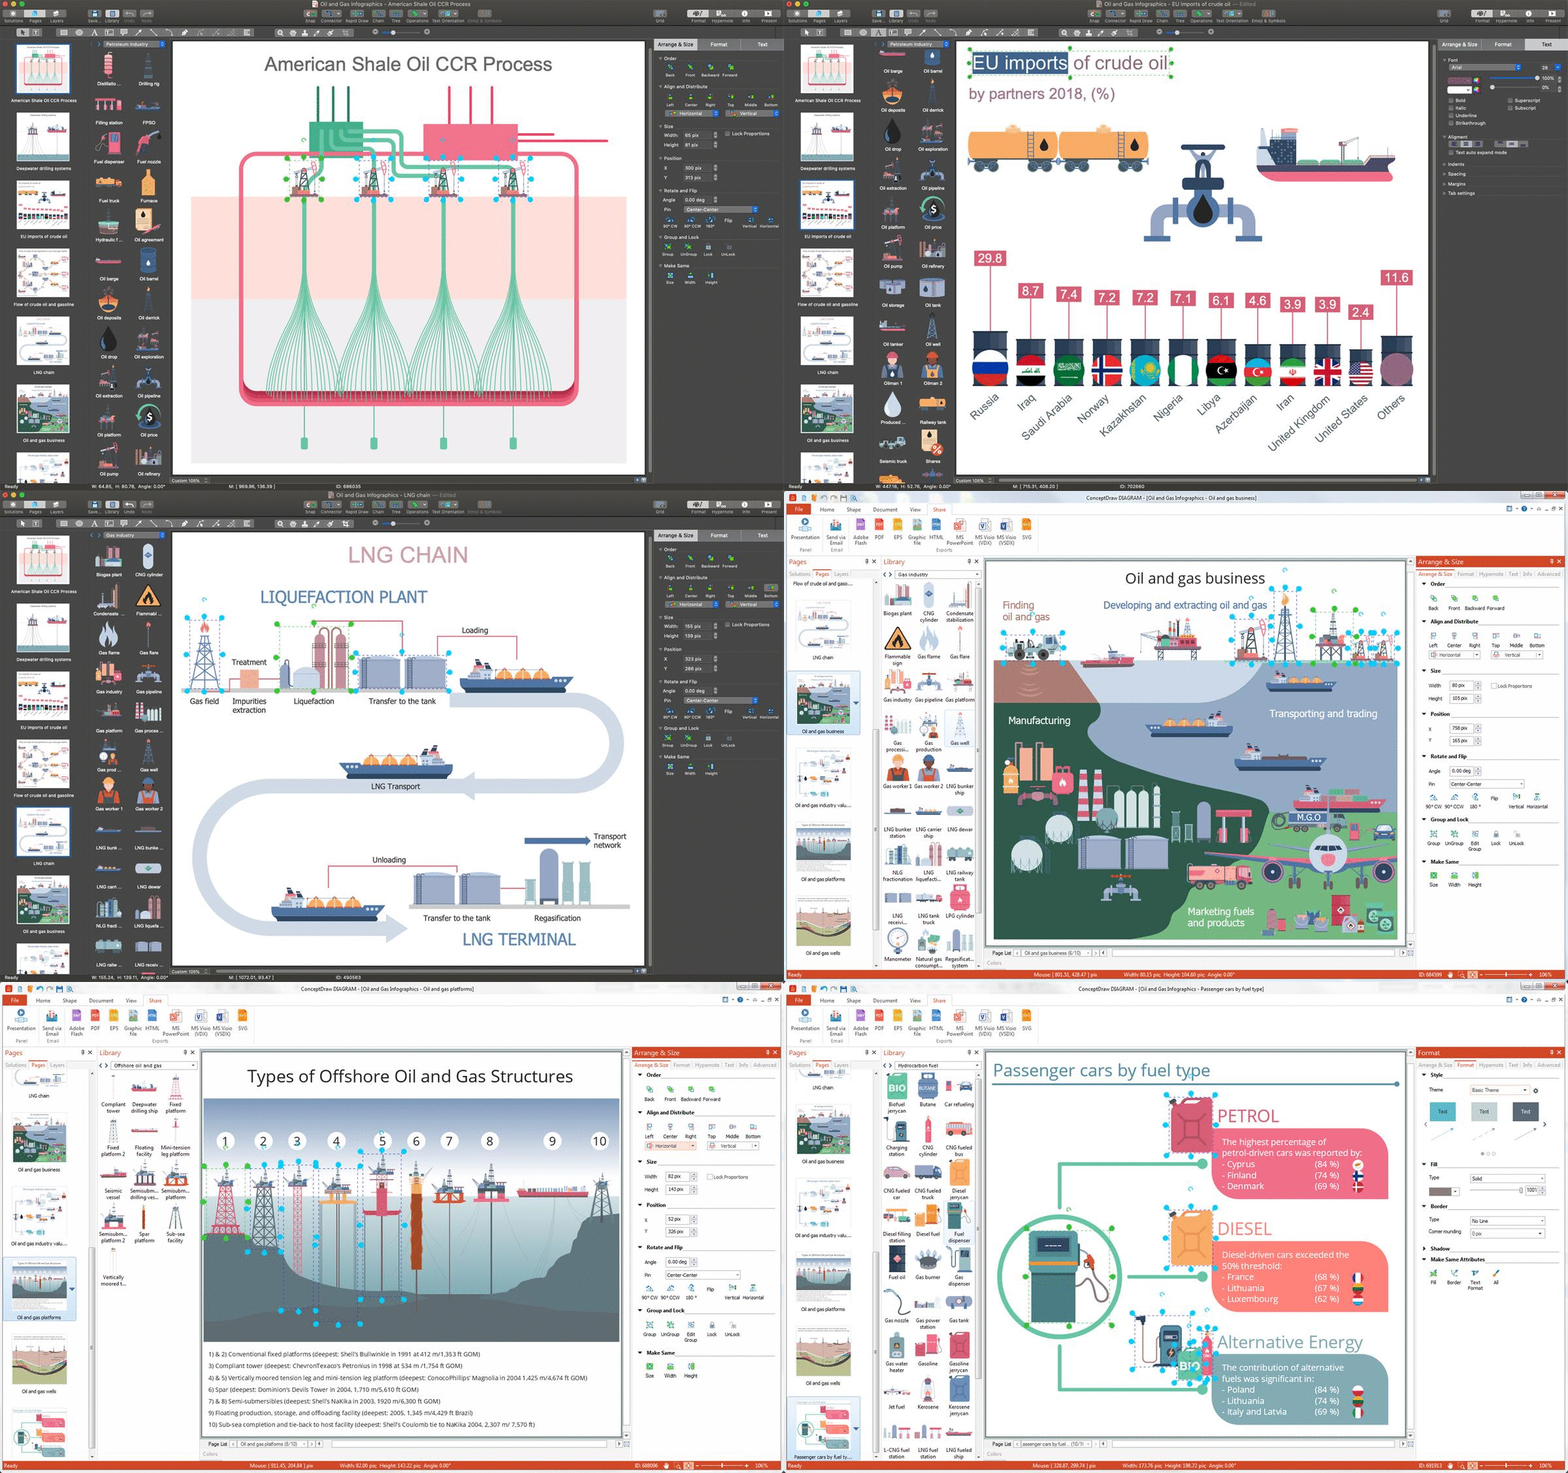
Example 1: American Shale Oil CCR Process
This diagram was created in ConceptDraw DIAGRAM using the combination of libraries from the Oil and Gas Solution. An experienced user spent 10 minutes creating this sample.
This sample illustrates the CCR process of shale oil production used by American Shale Oil company. Shale oil extraction process is an industrial process for unconventional oil production. In 1684, this process was first patented by Great Britain, while the oldest descriptions are dated by 10th century. The process represents a mining of oil shale, extraction of kerogen from it and then conversion into the shale oil by pyrolysis, hydrogenation, or heat treatment methods. This shale oil later is used as fuel oil or as a raw material for oil refining. The mining of oil shale can be realized as above ground (ex situ processing) as underground (in situ processing) via oil wells. American Shale Oil CCR process is in situ processing. The superheated steam is circulated through the pipes placed below the oil shale layer for heating it. There are used two kinds of wells — vertical and horizontal. The horizontal wells apply steam to the oil shale deposit and vertical wells recover the oil. The process is realized at the heat provided by the combustion of natural gas, propane, or oil shale gas at a later stage.
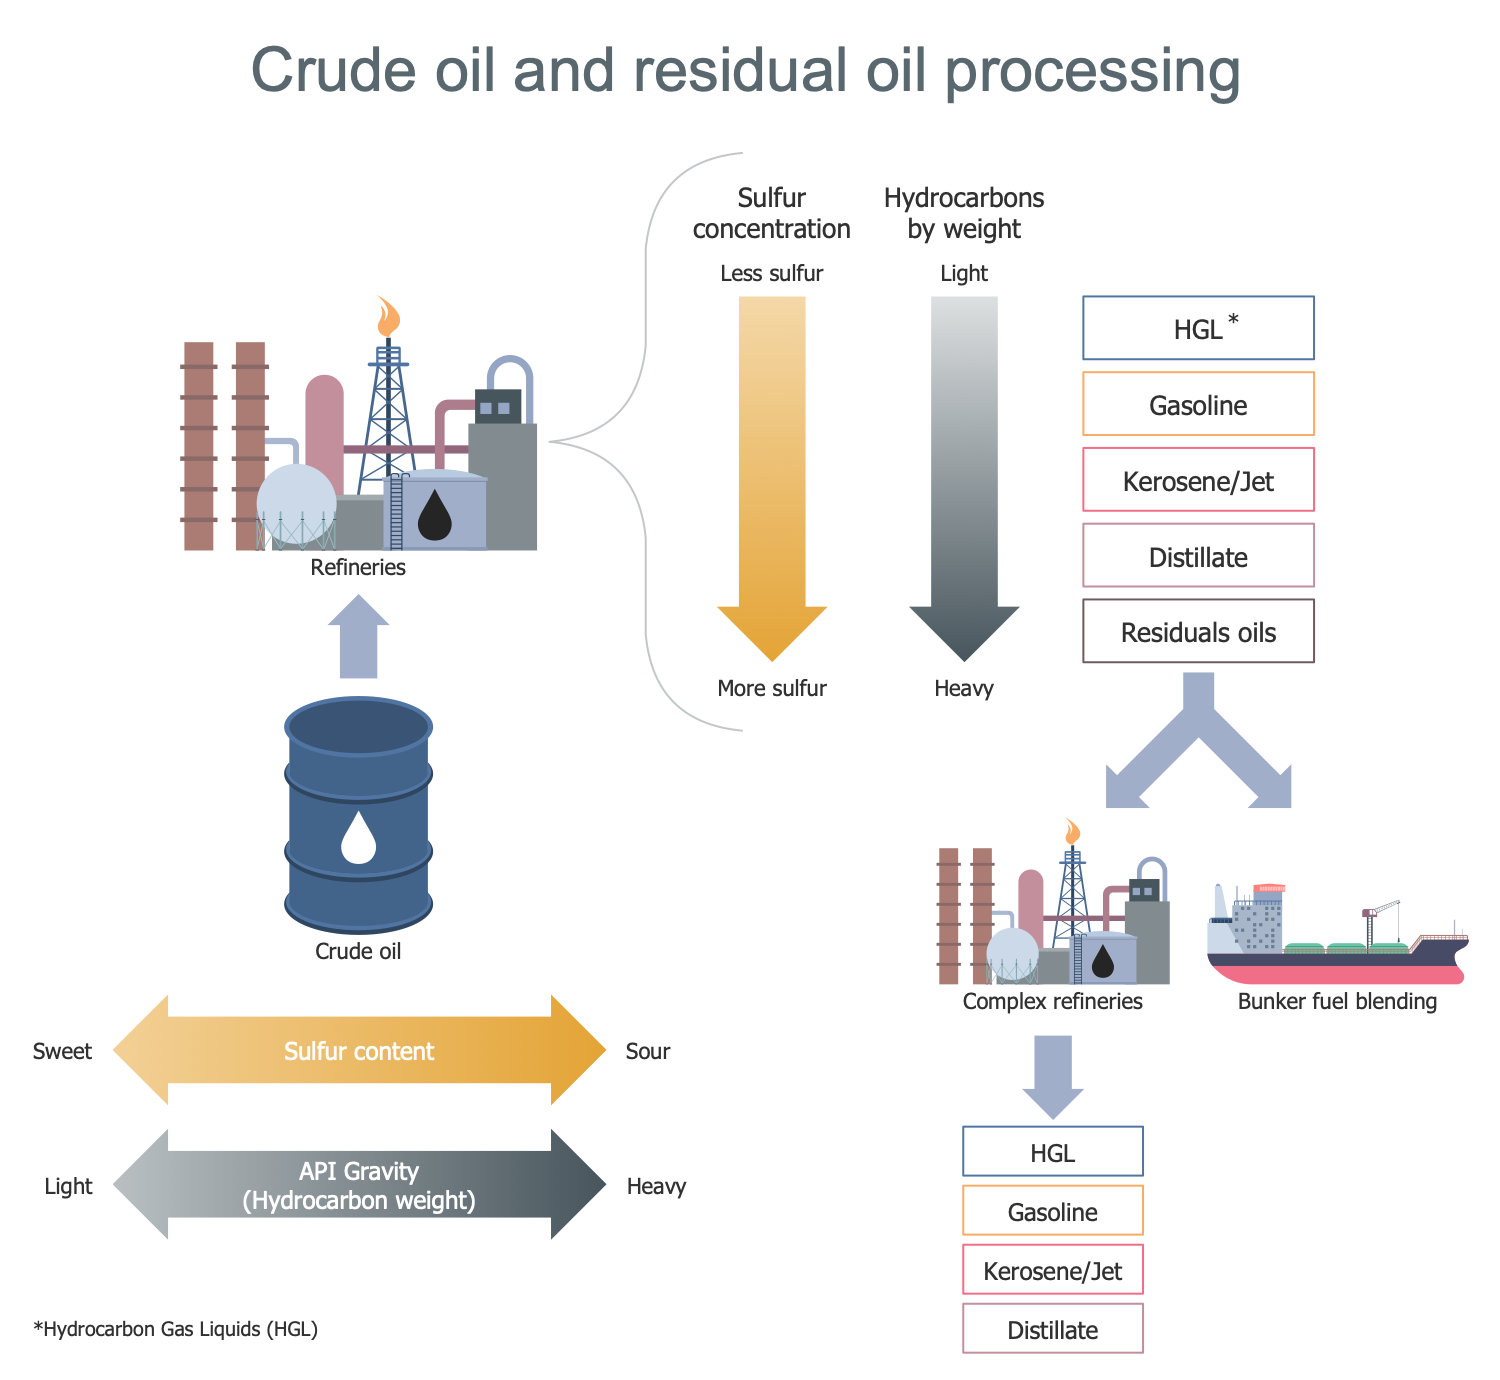
Example 2: Crude Oil and Residual Oil Processing
This diagram was created in ConceptDraw DIAGRAM using the combination of libraries from the Oil and Gas Solution. An experienced user spent 10 minutes creating this sample.
This sample shows crude oil and residual oil processing. In the first stage, the extracted crude oil is sent to the refineries. These are large industrial complexes with special equipment, where chemical-technological processes, called oil refining processes, are implemented. Oil is a very complex mixture of ingredients. The main ones are hydrocarbons. During the processing of crude oil, hydrocarbons are separated and then used to produce a wide variety of petroleum products. These include gasoline or gasoline, kerosene, liquefied petroleum gas (LPG), jet fuel, diesel and fuel oil. A number of chemicals used to make plastics, other useful materials, and intermediates like hydrogen, light hydrocarbons, reformates and pyrolysis gasoline, are also produced in refineries. Sulfur is also a petroleum product because a certain percentage of the sulfur molecules are found in petroleum. Hydrogen sulfide from the purification process is removed from the product stream and converted to sulfur by the Claus process. Use ConceptDraw for Oil and Gas to create visual oil and gas industry infographics in minutes.
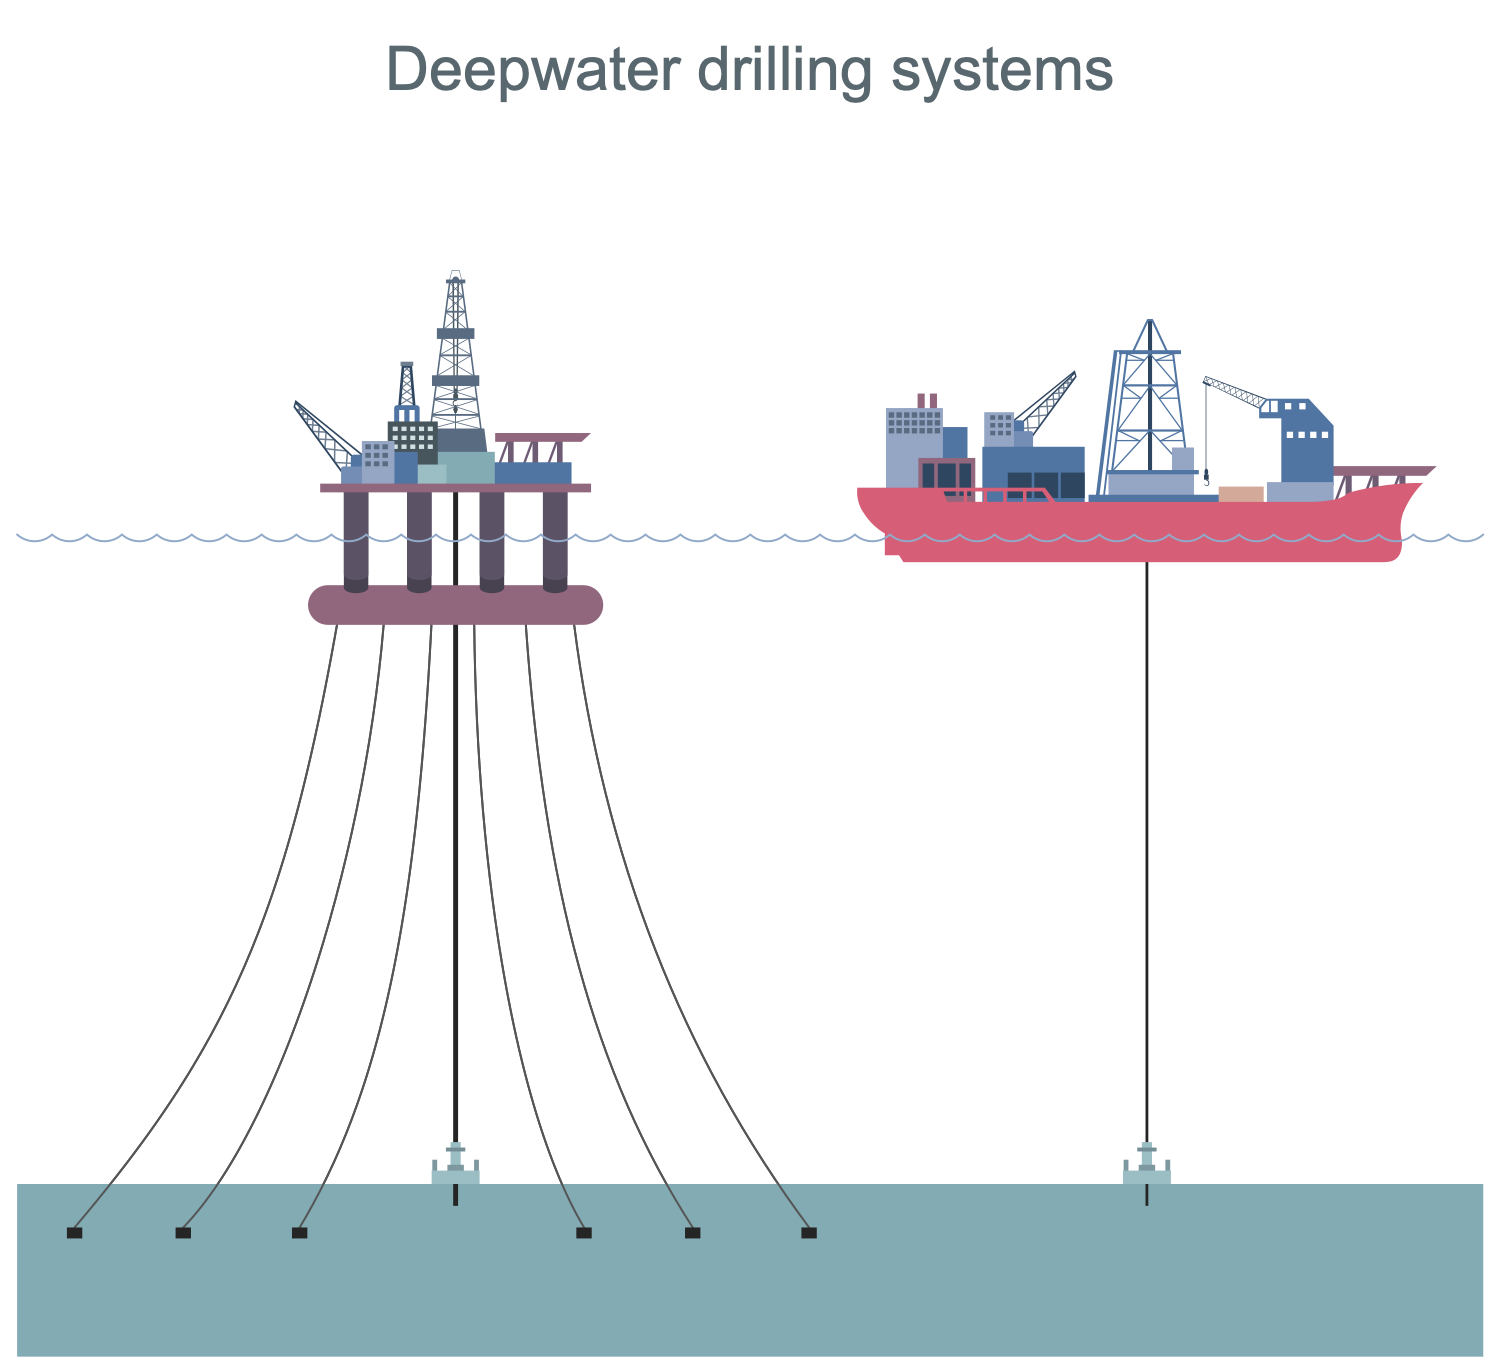
Example 3: Deepwater Drilling Systems
This diagram was created in ConceptDraw DIAGRAM using the combination of libraries from the Oil and Gas Solution. An experienced user spent 5 minutes creating this sample.
This sample shows two types of deepwater drilling systems: a semi-submersible presented at left and a drillship at right. Both vessels include special facilities for drilling. The semi-submersible vessel is partially submerged to allow another vessel to float into place for transport. The drilling is a method of sampling the seabed surface. The sampling is carried out in order to study the soil, determine its mechanical properties, relative density, water content, etc. The drilling records the stratigraphy of the seabed as well as rocks below the seabed. In terms of equipment, the rig includes a drill string made up of a series of pipe segments screwed on butt-to-end. The drill bit assembly is installed on the bottom of this drilling equipment and is used to cut into the seabed. In this case, the cuttings are produced, collected and carried out along the drill pipes together with the drilling fluid mud.
Example 4: EU Imports of Crude Oil
This diagram was created in ConceptDraw DIAGRAM using the combination of libraries from the Oil and Gas Solution. An experienced user spent 10 minutes creating this sample.
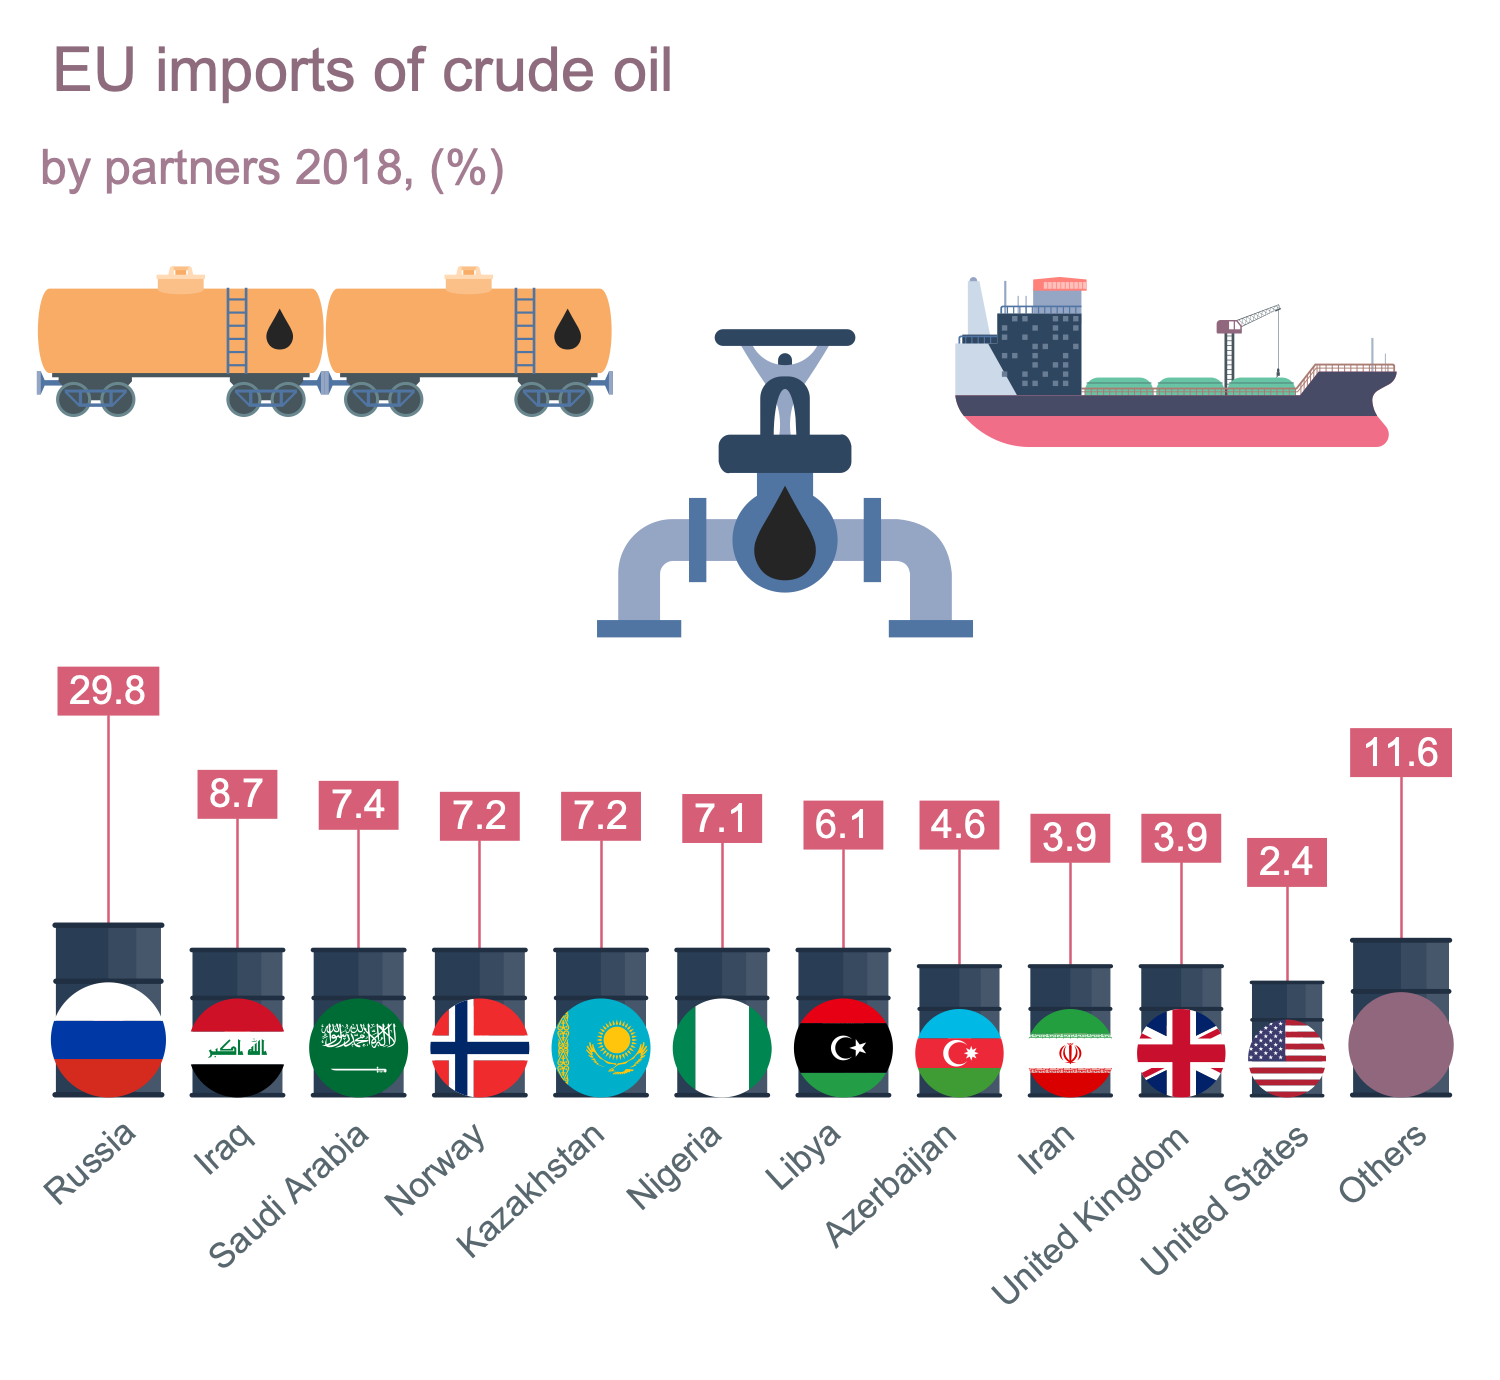
This sample is dedicated to the EU imports of crude oil. The main suppliers of crude oil to the EU are presented in a diagram and quantities of imported raw material in percents are depicted. A crude oil is the largest imported energy product in EU. You can observe a wide variety of countries among the suppliers. The flag symbols along with names are used to present them. Russia is the largest supplier of crude oil to the EU, its percentage (29,8% in 2018) is more than 3 times higher than ones of other countries (Iraq, Saudi Arabia, Norway, Kazakhstan, Nigeria, Libya, Azerbaijan, Iran, United Kingdom, United States, and much more). The import is realized by different ways, by oil pipelines and at the use of special transport equipment and capacities, oil barrels, railway tanks, oil tankers, etc. Some of them are presented here at the use of colorful clipart included to the libraries of the Oil and Gas solution. The illustrative oil and gas graphics and infographics are able to make the complex business information and data easy for perception.
Example 5: EU Imports of Natural Gas
This diagram was created in ConceptDraw DIAGRAM using the combination of libraries from the Oil and Gas Solution. An experienced user spent 10 minutes creating this sample.
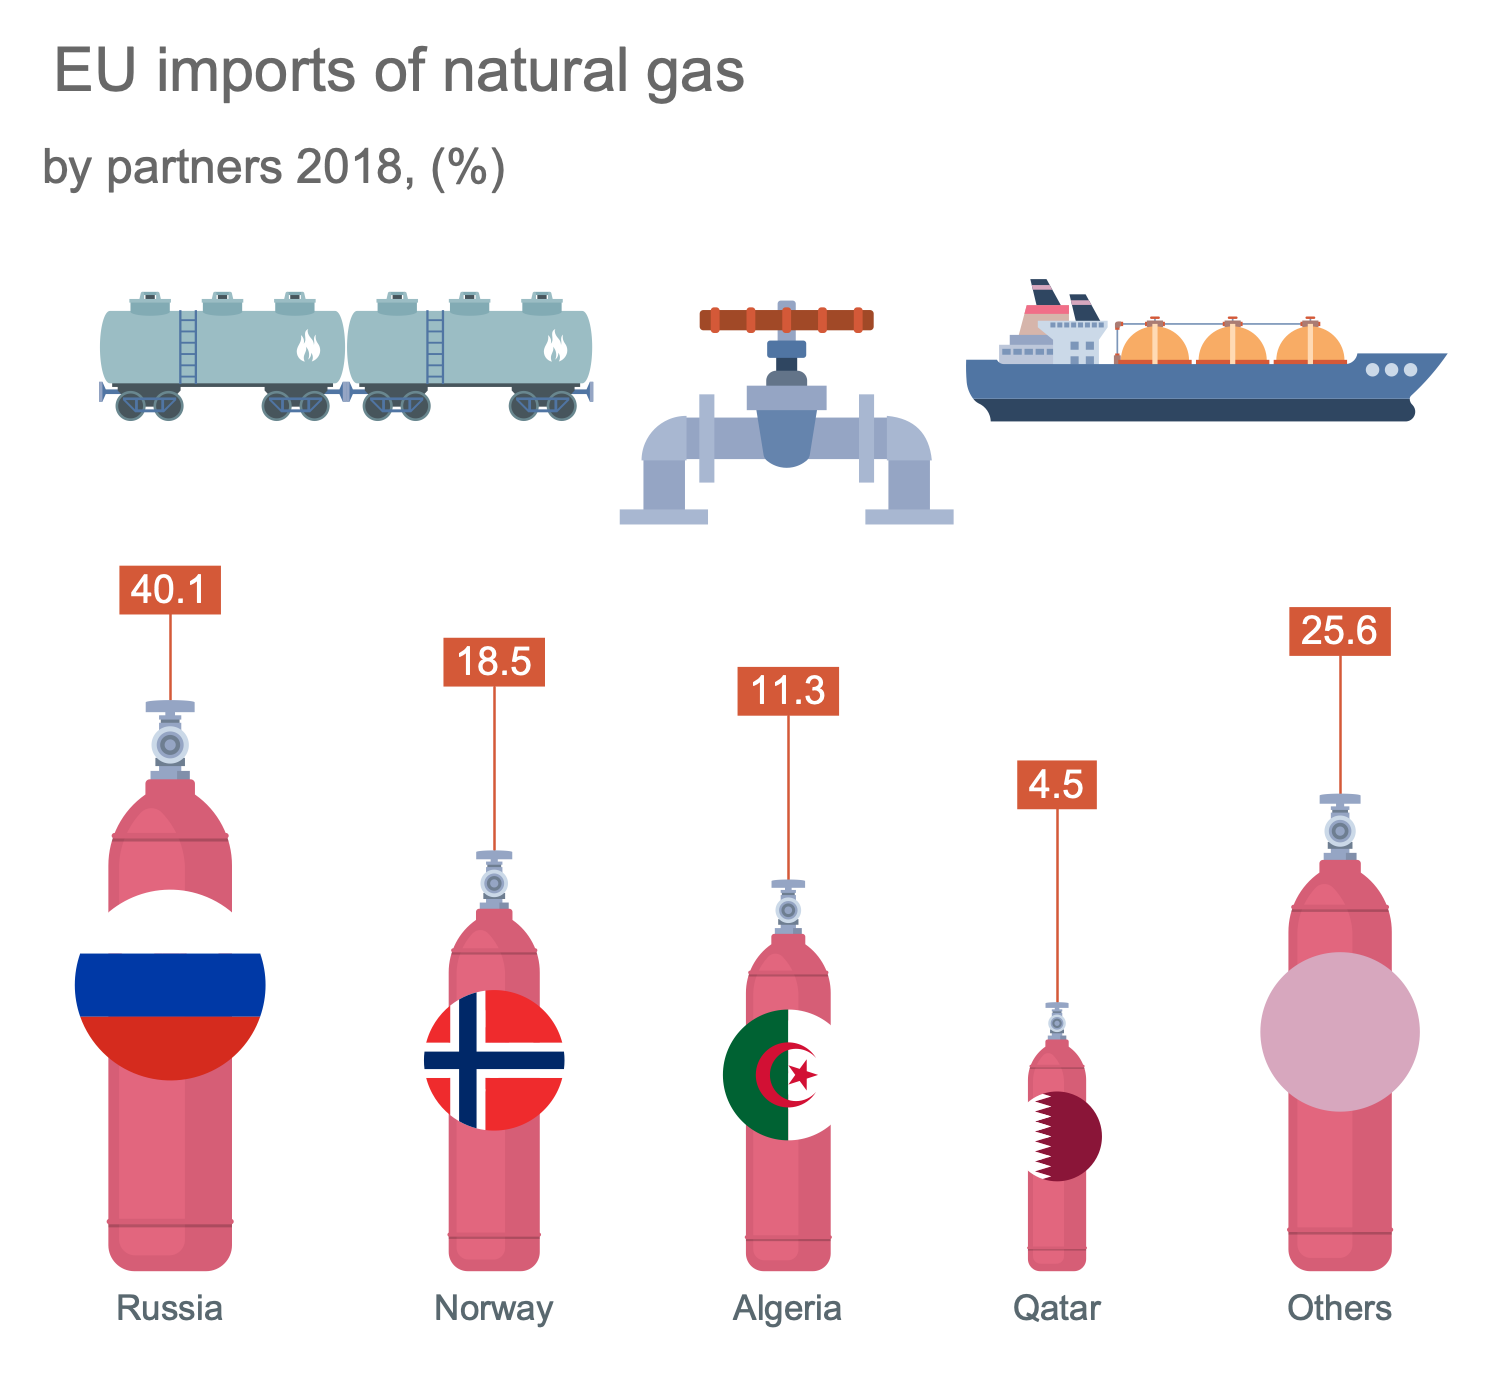
This sample illustrates EU natural gas imports in 2018. It provides an overview of the trade in energy products such as natural gas between the EU countries and the rest of the world. The main suppliers and their percentage in proceeded natural gas to the EU are presented in this diagram. Among the suppliers are Russia, Norway, Algeria, Qatar, and much more. Percentages are also displayed. The predominant country is Russia; in terms of percentage, it significantly exceeds the others. At the same time, the share of Norway is also quite large, although it is two times less than Russia's value. The diagram includes the illustrative clipart of natural gas pipelines, liquefied natural gas (NLG) railway tank, and LNG carrier ship used for transportation of this raw material. These clipart and more others you can find in solution libraries. The use of pre-made oil and gas symbols is the easiest way of drawing the industry illustrating diagrams and infographics.
Example 6: Flow of Crude Oil and Gasoline
This diagram was created in ConceptDraw DIAGRAM using the combination of libraries from the Oil and Gas Solution. An experienced user spent 15 minutes creating this sample.
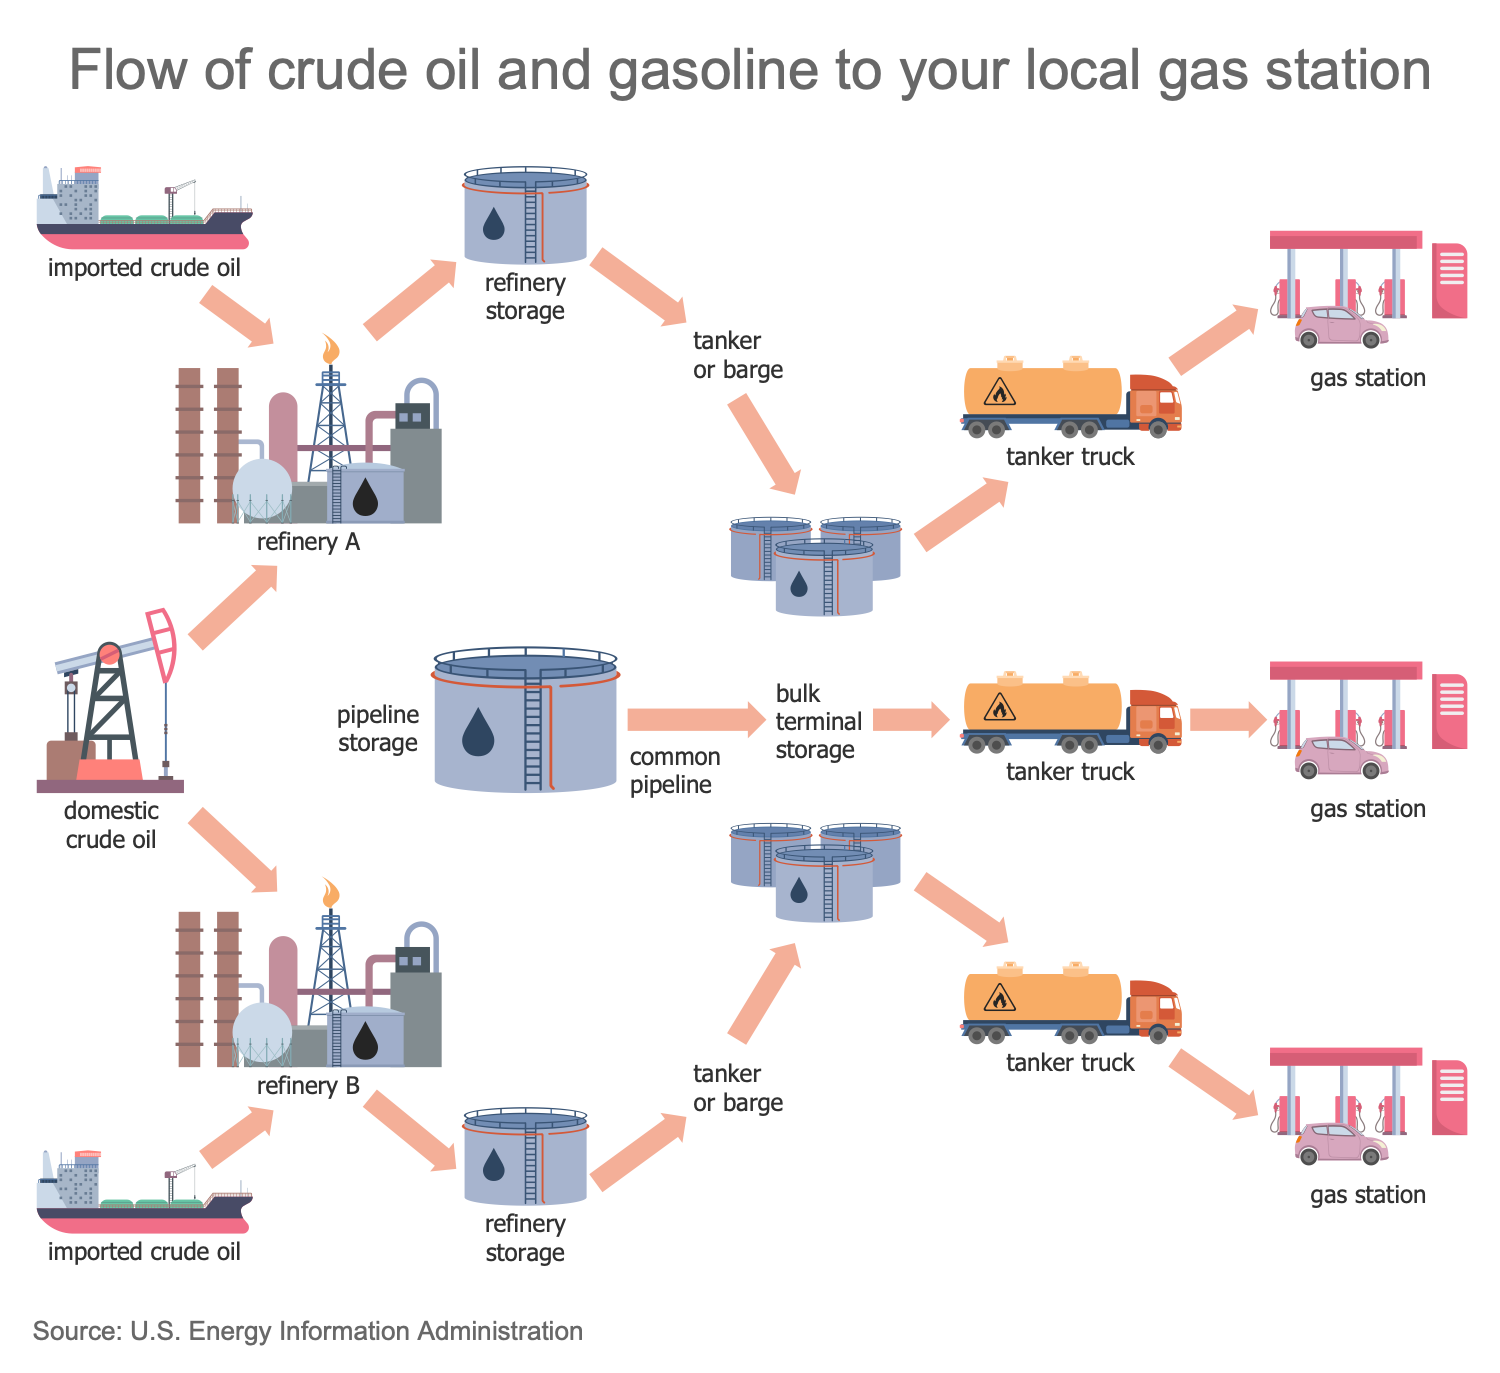
This sample illustrates the Flow of Crude Oil and Gasoline to the local gas station. Gasoline is a fuel made from crude oil and used as an engine fuel in vehicles. The imported and domestic crude oil is delivered to refineries where it is used for gasoline production. The produced gasoline is distributed to refinery storages and pipeline storage. The tankers and barges are used to transport it to bulk terminal storage. The filling of the pipeline storage via a common pipeline also goes there. The tanker trucks are used to transport gasoline from the bulk terminal storage to gas stations. The use of a flowchart to explain the flow of crude oil starting from its extraction to gasoline production is a perfect choice. The high-illustrative diagrams and flowcharts are able to make any process easily comprehensible by everyone.
Example 7: Hydrocarbon Gas Liquids
This diagram was created in ConceptDraw DIAGRAM using the combination of libraries from the Oil and Gas Solution. An experienced user spent 15 minutes creating this sample.
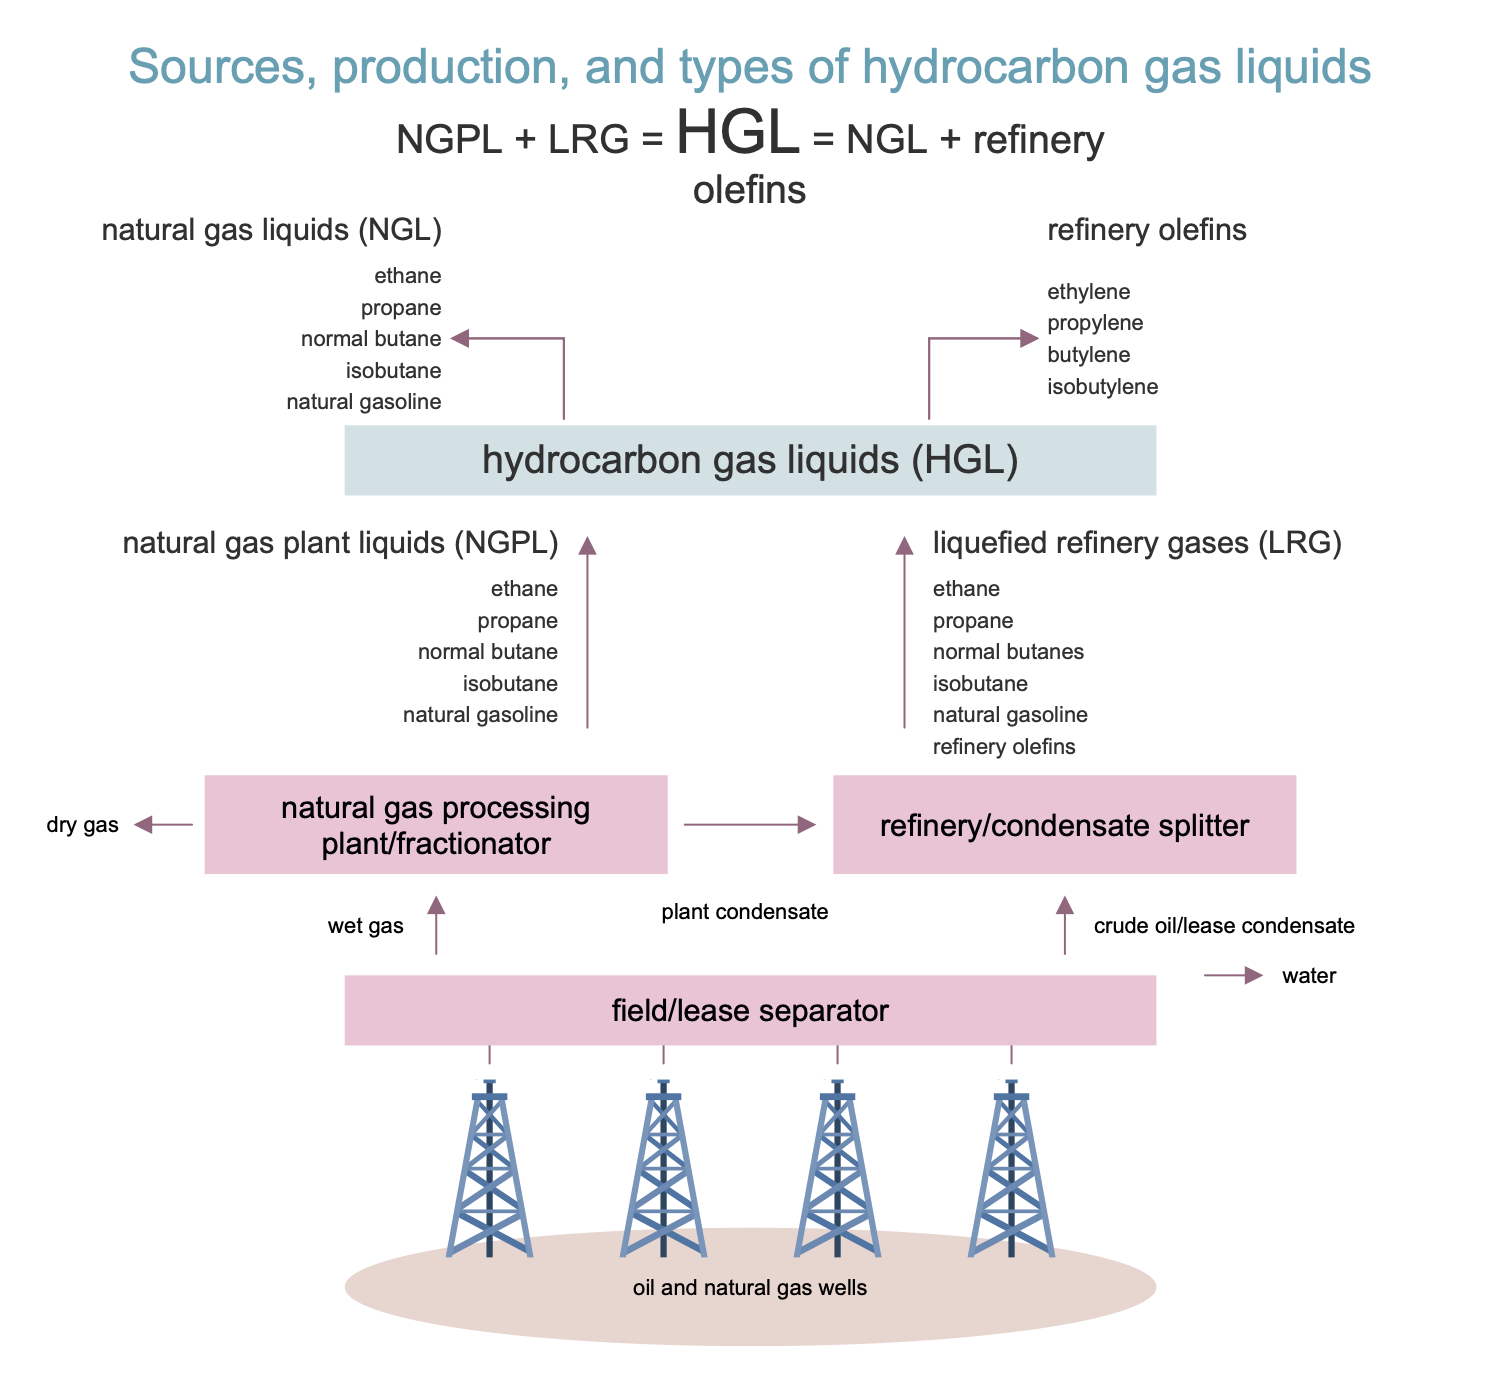
This sample shows the sources, production, and types of hydrocarbon gas liquids (HGLs). HGLs are the high-value products used as fuels or feedstock for making petroleum products and petrochemicals. They are also applied to make chemicals, plastics, and synthetic rubber, additives for motor gasoline production, diluents for transportation of heavy crude oil. HGLs are extracted from natural gas at natural gas processing plants and also from crude oil at the petrochemical plants. At the last ones they are then refined into petroleum products. HGLs include natural gas liquids (ethane, propane, normal butane, isobutane, natural gasoline) and refinery olefins (ethylene, propylene, butylene, isobutylene). The hydrocarbon gas liquids can be in a gaseous or liquid state, depending on pressure and temperature. They are in gas state at atmospheric pressure and liquids under higher pressures or at the cooling. For each type of HGLs the pressures and temperatures of liquefying significantly vary.
Example 8: LNG Chain
This diagram was created in ConceptDraw DIAGRAM using the combination of libraries from the Oil and Gas Solution. An experienced user spent 10 minutes creating this sample.
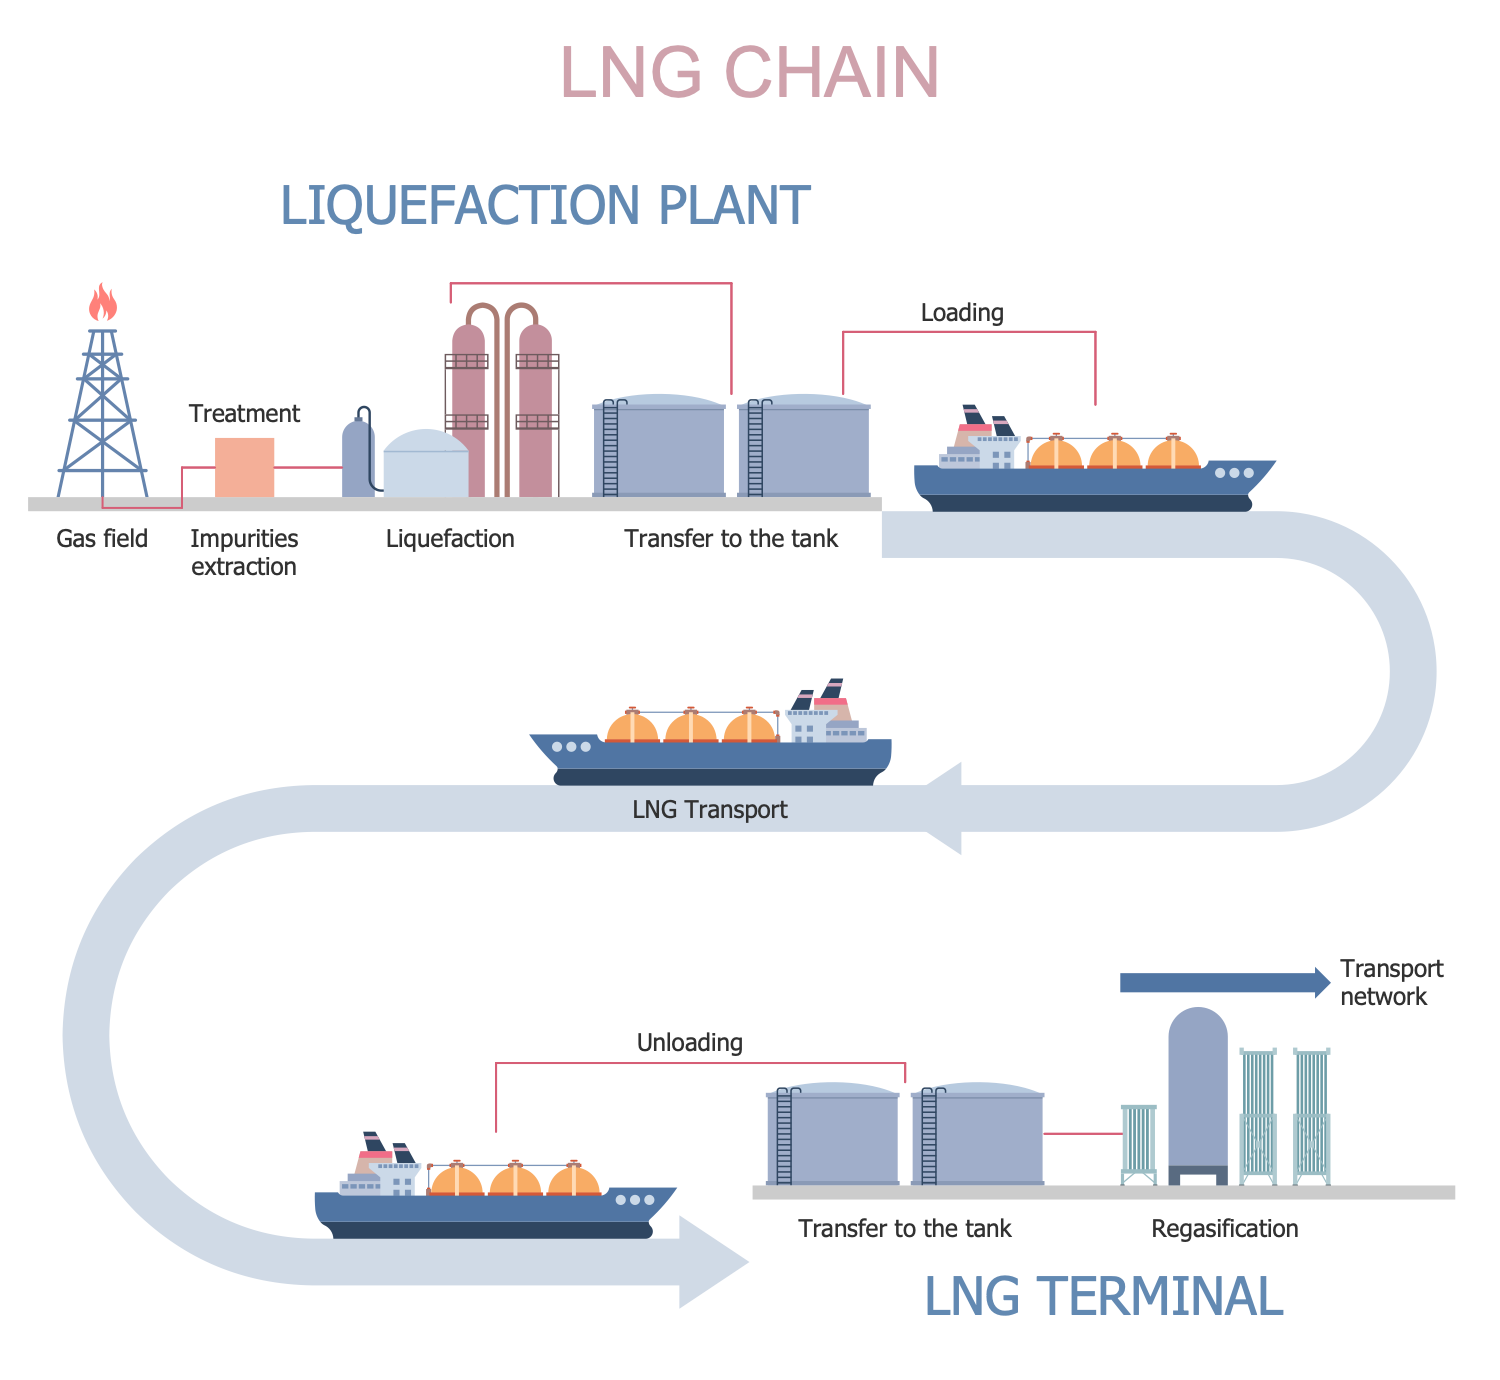
This sample shows the LNG chain. It begins from the gas field, where the natural gas is mined. Then natural gas is entered into the system for treatment and extraction of different impurities like mercury, water, hydrogen sulfide, carbon dioxide, etc. At the next step of the process, the natural gas enters the liquefaction unit and is cooled to between -145 °C and -163 °C. The liquefied natural gas (LNG) is then stored in specialized double-wall insulated tanks at atmospheric pressure and transported by trucks or trailers. Before the transportation, the LNG loading is realized. When the gas is delivered to the destination, it is unloaded and transferred to the vacuum insulated or flat-bottom tanks to be stored there. After that, LNG enters a regasification facility, is pumped into a vaporizer, and heated back into gaseous state. Now LNG is ready for distribution and is delivered to the end-user by a pipeline distribution system.
Example 9: Oil and Gas Business
This diagram was created in ConceptDraw DIAGRAM using the combination of libraries from the Oil and Gas Solution. An experienced user spent 15 minutes creating this sample.
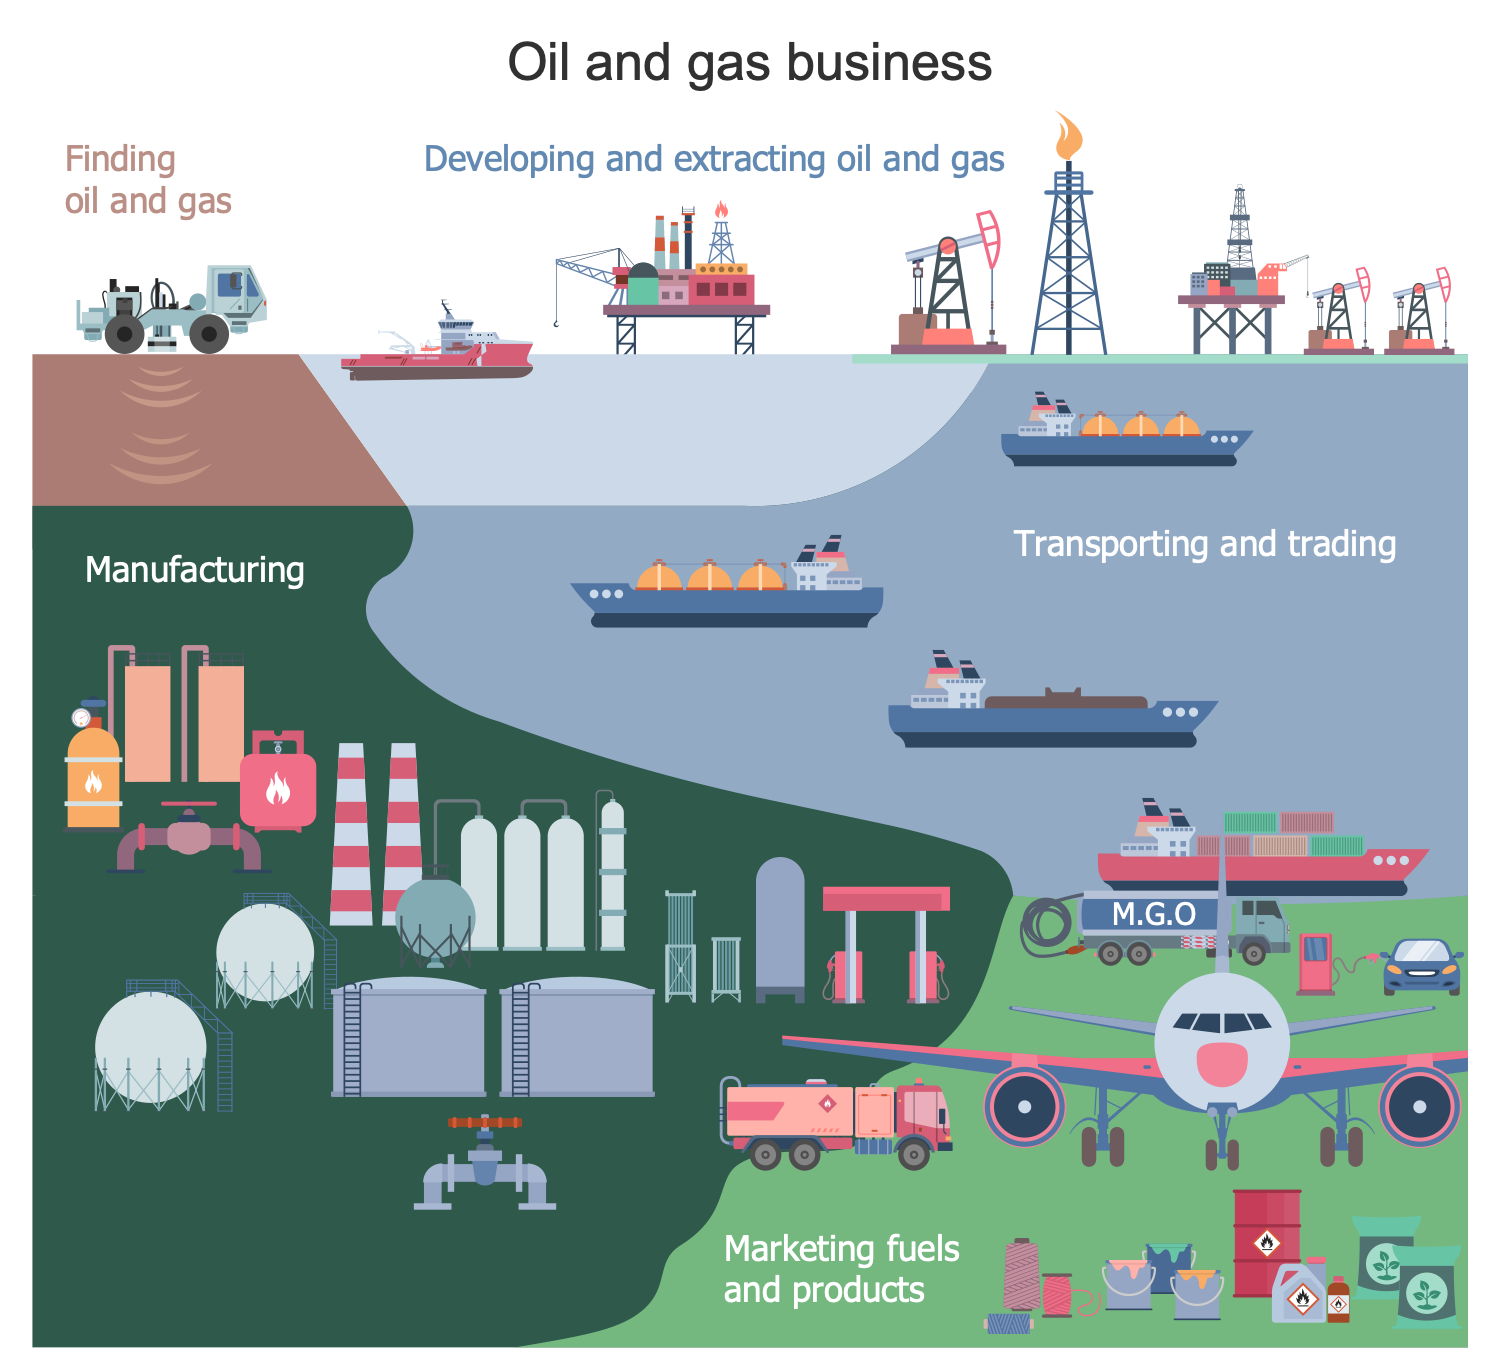
This sample shows the whole cycle of the oil and gas business. The energy industry is a business of large investment and profits. The oil and gas business plays a really influential role in the global economics. The oil and its products are known as "black gold" for their extreme monetary value. It is a major industry in the energy market. The business process begins with finding oil and gas, developing, drilling, and extracting them. Then follow the steps of transporting and trading oil and gas, refining and manufacturing fuels and petroleum products. Fuel oil and gasoline (petrol) are the most popular products of the oil industry. Annually the huge volumes of these products are manufactured. Petroleum is used in the manufacturing process of chemical products, pharmaceuticals, fertilizers, pesticides, solvents, plastics, synthetic fragrances, and more. The business process in this sector is ending by marketing and selling.
Example 10: Oil and Gas Industry Value Chain
This diagram was created in ConceptDraw DIAGRAM using the combination of libraries from the Oil and Gas Solution. An experienced user spent 10 minutes creating this sample.
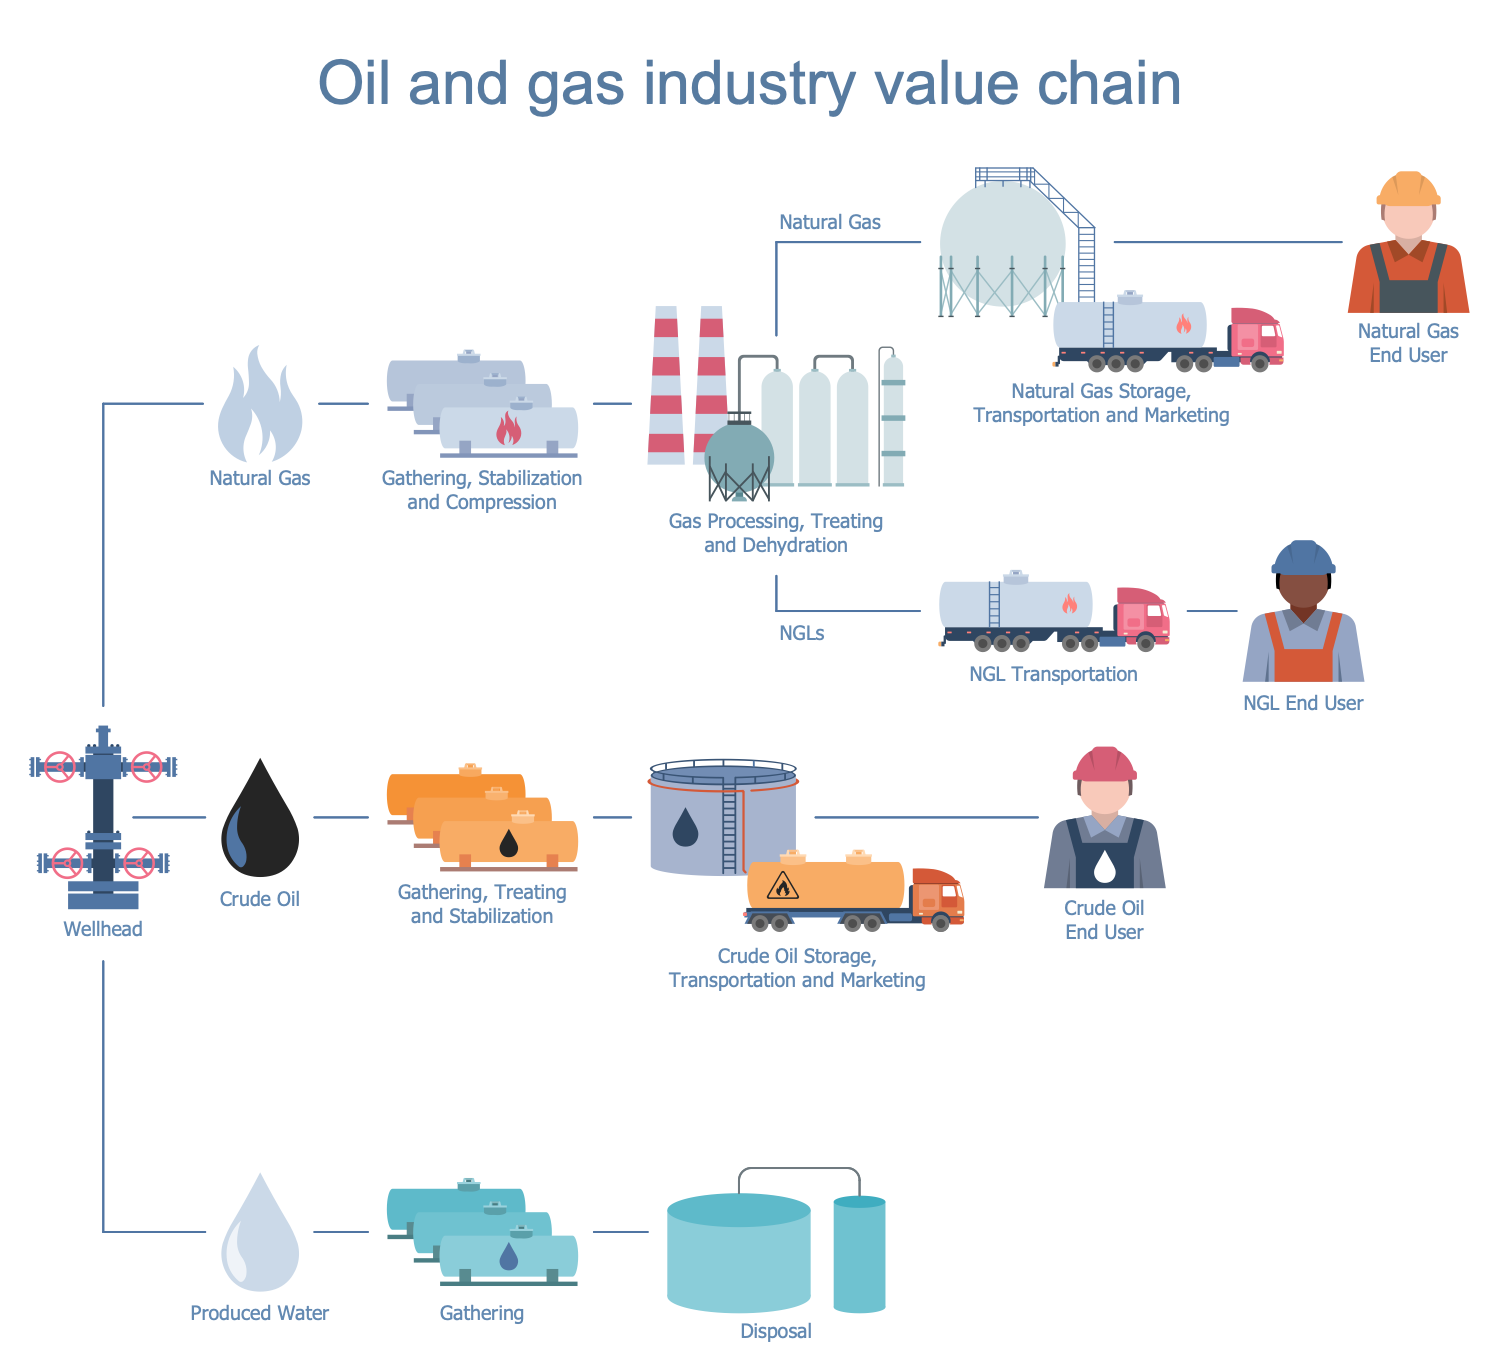
This sample shows the steps of the oil and gas industry value chain. The sequence of steps begins by the supply source of crude oil and natural gas (NLG) — a wellhead and ends by trading mechanisms applied to sell the oil products and gas. At first, you see the transferring of natural gas to the point of its gathering, stabilization, and compression. At the next step its processing, treating, and dehydration are realized. Next, the NLG storage, transportation, and marketing are implemented, or just its transportation to the end-user without going other processes. As for the crude oil, first, it is gathered, treated, and stabilized. Then is realized its storage, marketing, and finally transportation to the end-user. The information about produced water is also included to this diagram. It is gathered and then disposed of. The value-chains are helpful for any business process. Their analysis allows increasing production efficiency and achieving a maximum value for the least possible cost.
Example 11: Oil and Gas Platforms
This diagram was created in ConceptDraw DIAGRAM using the combination of libraries from the Oil and Gas Solution. An experienced user spent 10 minutes creating this sample.
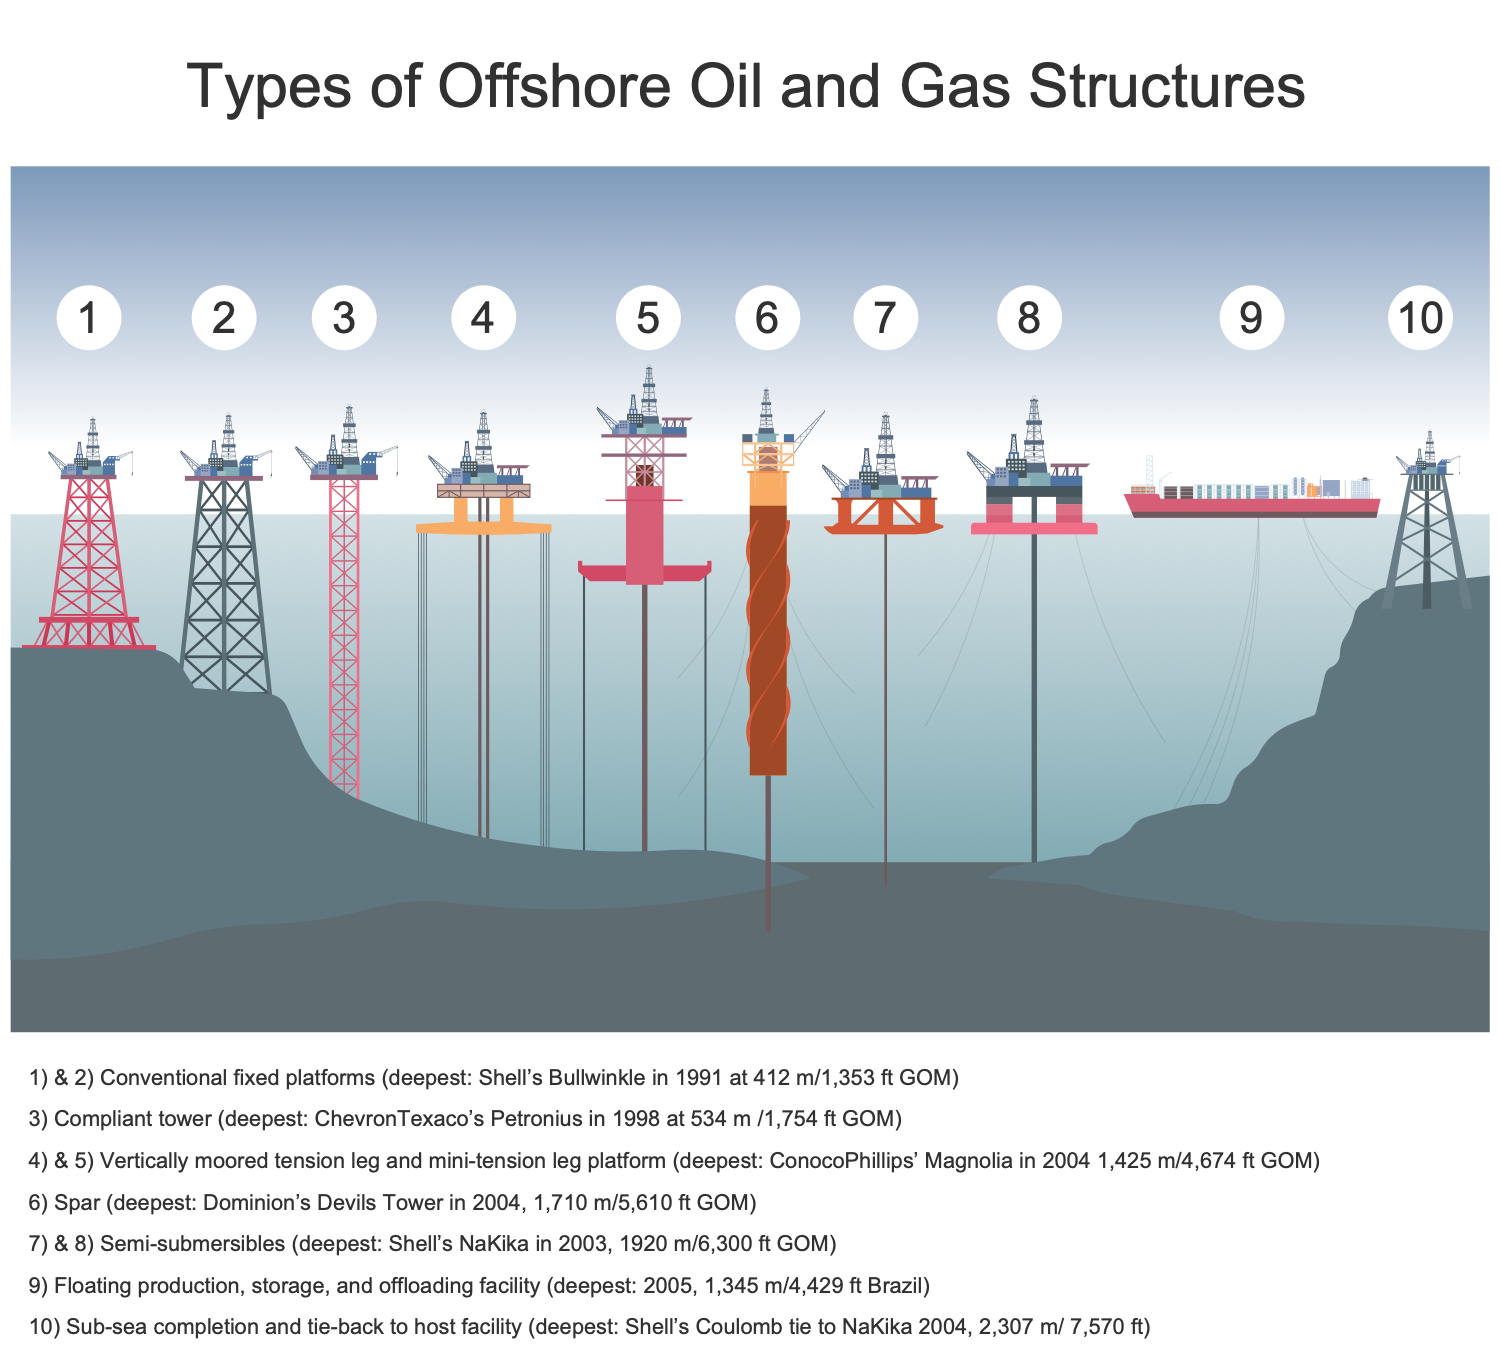
This sample shows a variety of types of oil and gas platforms: conventional fixed platforms, compliant tower, vertically moored tension leg, mini-tension leg platform, spar, semi-submersibles, floating production, storage, and offloading (FPSO) facility, sub-sea completion and tie-back to host facility. The fixed platforms are immobile, built on concrete or steel legs for long-term use. The compliant towers sustain significant lateral deflections and forces. They consist of a slender, flexible towers, and pile foundation. Tension-leg platforms (TLPs) are used in large water depths and are floating platforms tethered to the seabed to eliminate the vertical movements of the structure. Spars are moored to the seabed, have mooring lines and large counterweight at the seabed. They are more stable than TLPs. Semi-submersible platforms possess a good buoyancy and weight sufficient to keep the structure upright. FPSO is one of the best sources for floating production. Sub-sea completion and tie-back to host facilities are popular in the development of new oil and gas reserves.
Example 12: Oil and Gas Value Chain
This diagram was created in ConceptDraw DIAGRAM using the combination of libraries from the Oil and Gas Solution. An experienced user spent 15 minutes creating this sample.
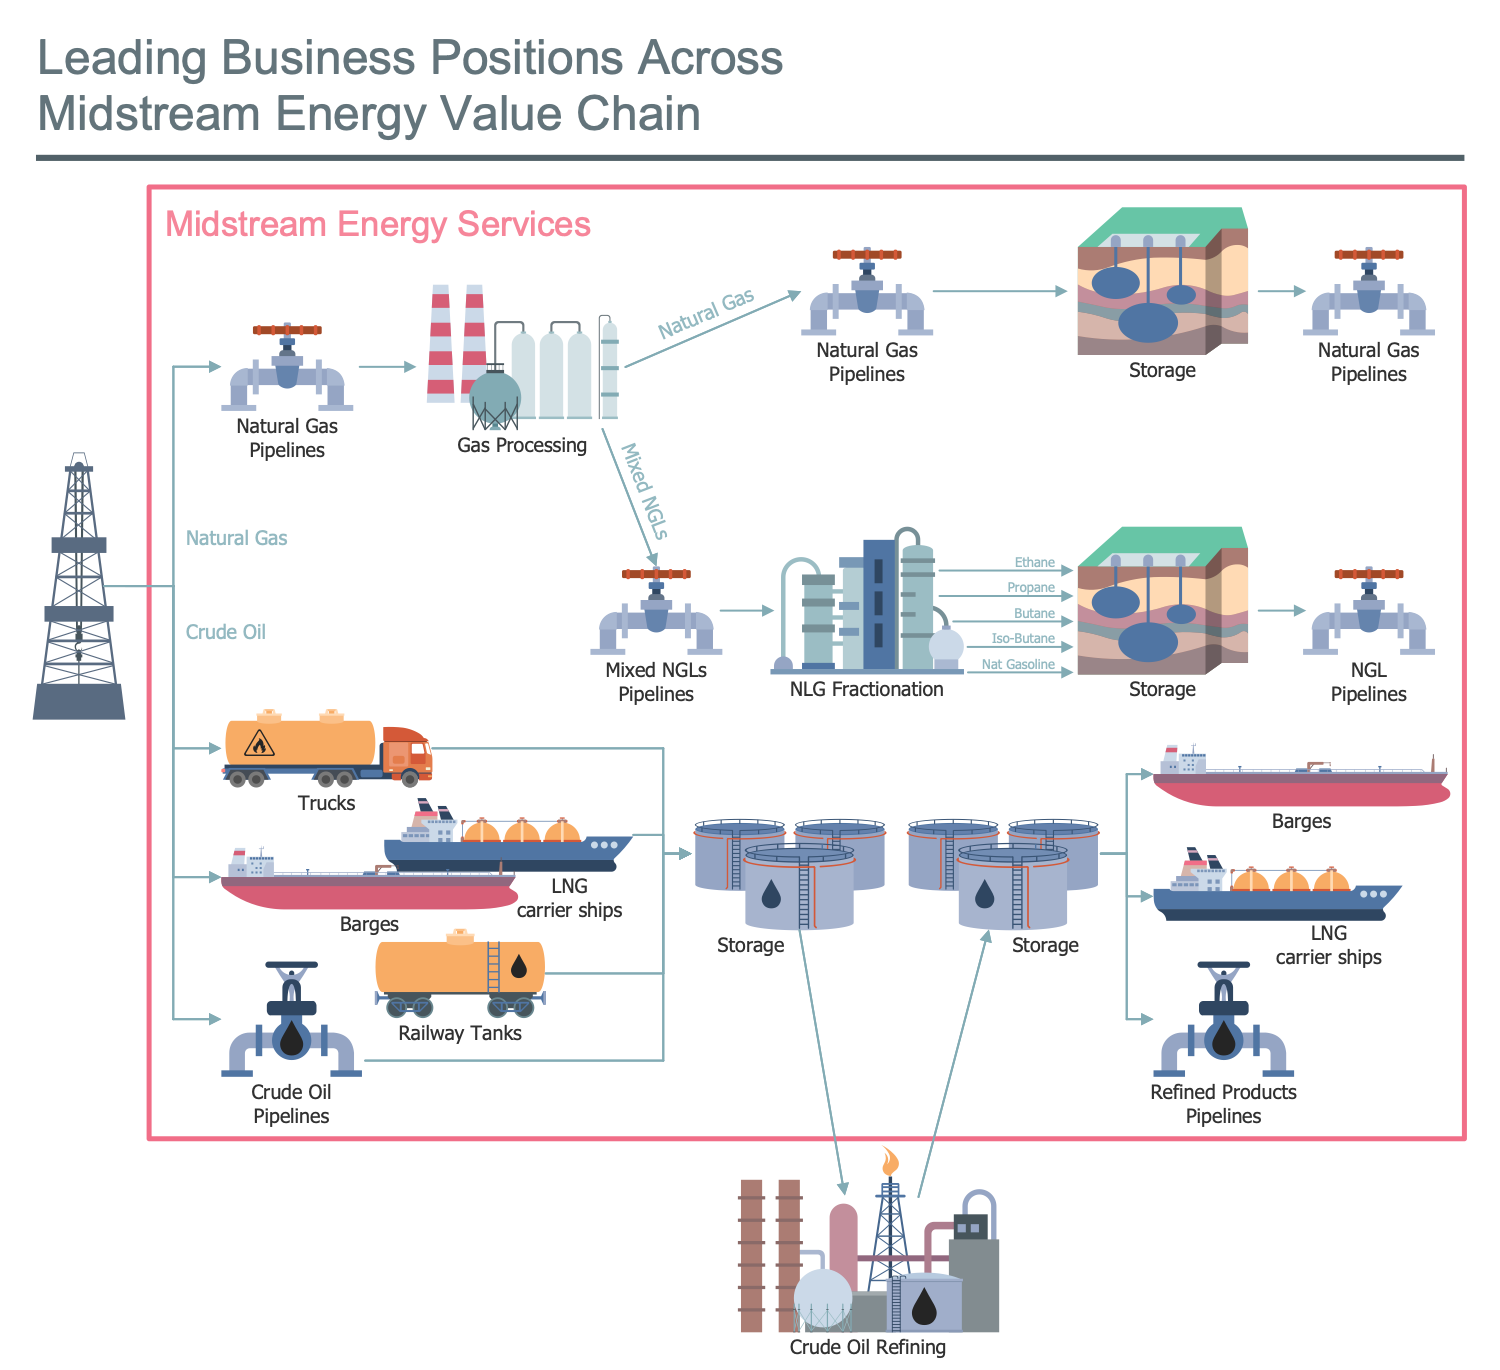
This sample describes the crude oil and natural gas value chain. The leading business positions across the mindstream energy value chain are depicted. You see a sequence of all activities that occur on the way to value formation. It begins with the supply sources of gas and oil. The natural gas is moved by pipelines to the processing and then to storage. The mixed NLG after the fractionation is also moved to storage until the moment of realization in the wholesale markets. As for the crude oil, it is transported to the storage and refining points by trucks, barges, LNG carrier ships, and railway tanks. The refined products are transferred by transport facilities and pipelines. The construction of a value chain is a common way applied in different areas to describe the full range of activities needed to create some product or service. The value-chain analysis allows increasing production efficiency and achieving a maximum value for the least possible cost.
Example 13: Oil and Gas Wells
This diagram was created in ConceptDraw DIAGRAM using the combination of libraries from the Oil and Gas Solution. An experienced user spent 10 minutes creating this sample.
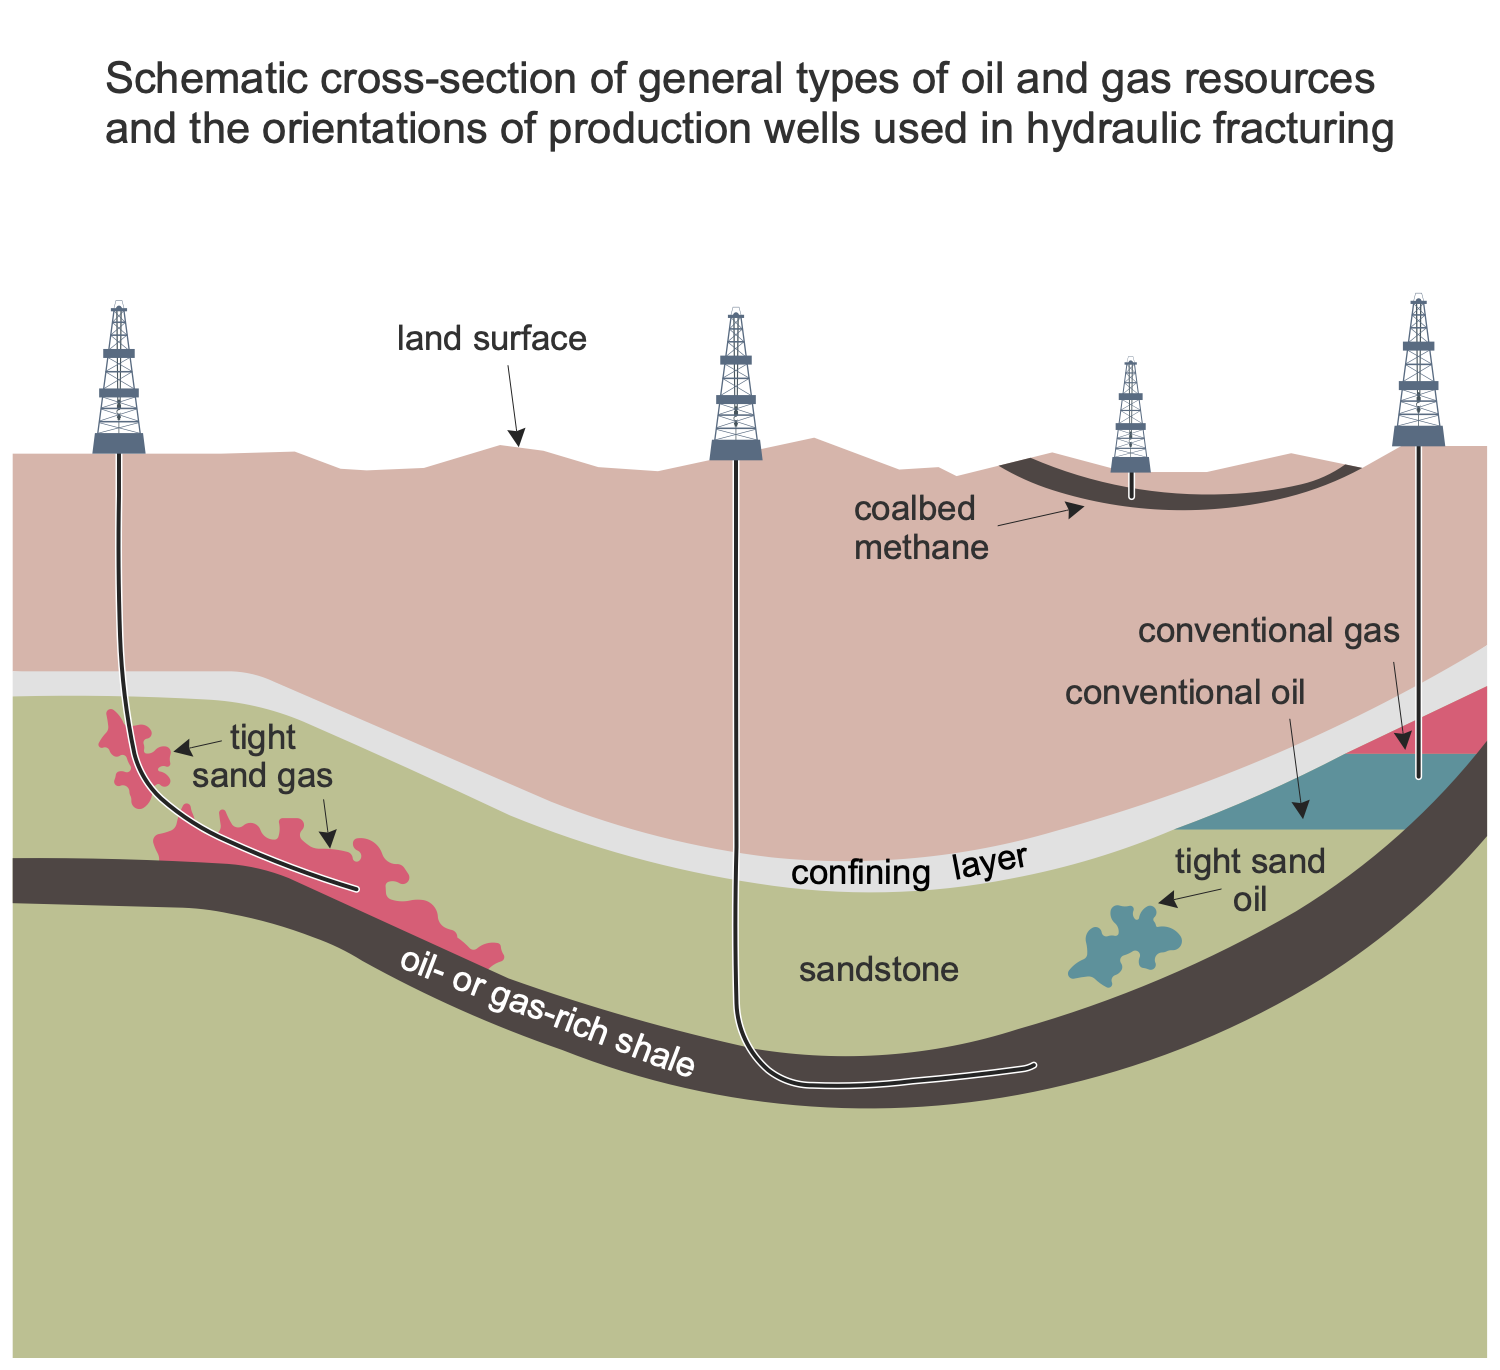
This sample shows the types of oil and gas wells and principles of producing of oil, gas, and also tight oil. Tight oil is a light crude oil contained in shale and tight sandstone formations of low permeability. The production from tight oil formations occurs at the application of multi-stage hydraulic fracturing and precise directional drilling. The producing of conventional oil and gas from the deposit by the use of a vertical well is presented on the right side. The layer of oil or gas-rich shale is presented at the bottom of a diagram. The oil and gas are caught at a trap between this layer and a confining layer presented above. Striving to visuality, the conventional oil and gas were colored differently in a diagram. Three other wells present the producing of unconventional formations. A horizontal well presented at the center produces oil from an oil-rich shale formation, the left well produces gas from a tight sand formation and the last one is a vertical well producing coalbed methane.
Example 14: Oil Distillation Products
This diagram was created in ConceptDraw DIAGRAM using the combination of libraries from the Oil and Gas Solution. An experienced user spent 15 minutes creating this sample.
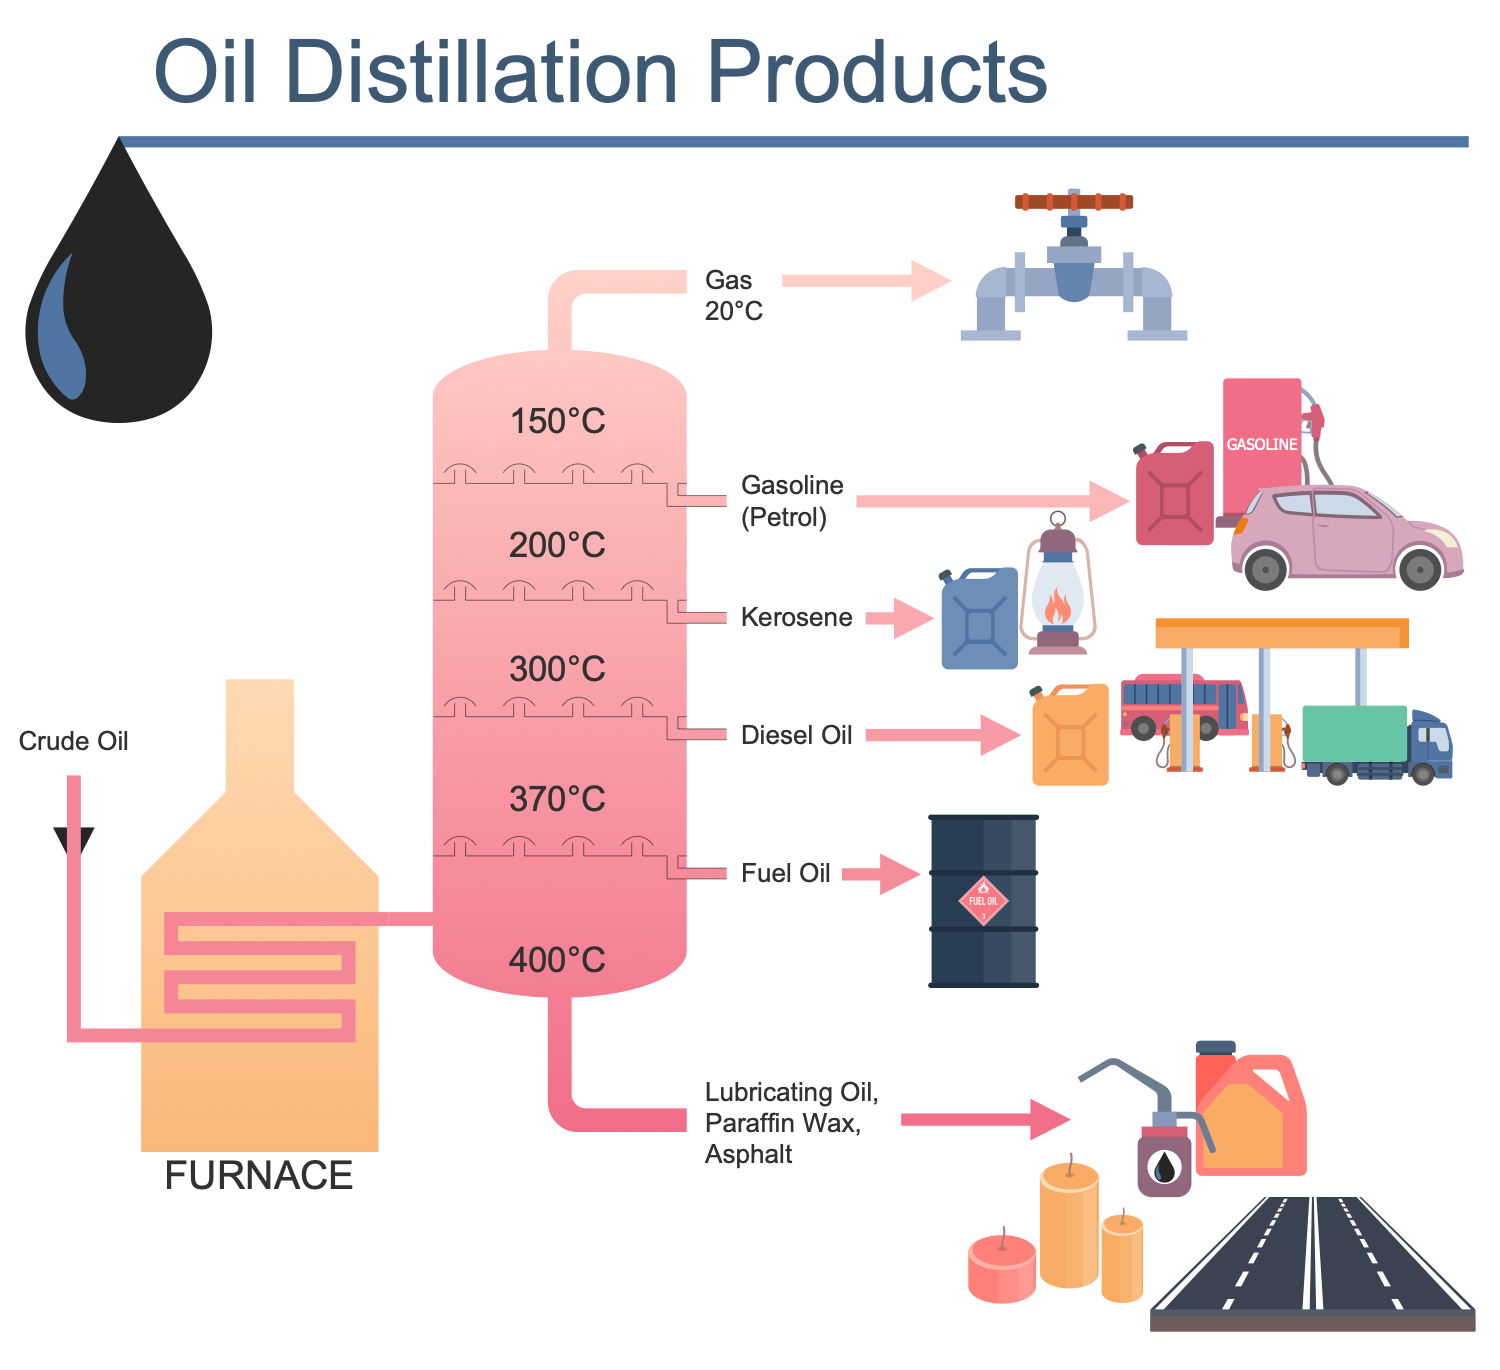
This sample shows a variety of products received in result of the crude oil distillation. The oil distillation process is a multi-stage process of physical and chemical processing of crude oil. The oil is make up of a large number of different hydrocarbons. To get a particular petroleum product, you need substances with certain characteristics. That is why the process of oil refining begins with its separation into fractions through its distillation. The atmospheric and vacuum distillation of crude oil are applied. The process takes place at the heating. The boiling points vary for different hydrocarbons. Thus, the gasoline fraction is released at a temperature of 150°C, the kerosene fraction at 200°C, diesel at 300°C, and fuel oil at 370°C. The fractions boiling at a temperature above 360°C are not separated during atmospheric distillation. The fuel oil is further distilled in a vacuum column. In result, the fractions of lubricating oils, paraffin wax, and other oil products are separated.
Example 15: Passenger Cars by Fuel Type
This diagram was created in ConceptDraw DIAGRAM using the combination of libraries from the Oil and Gas Solution. An experienced user spent 15 minutes creating this sample.
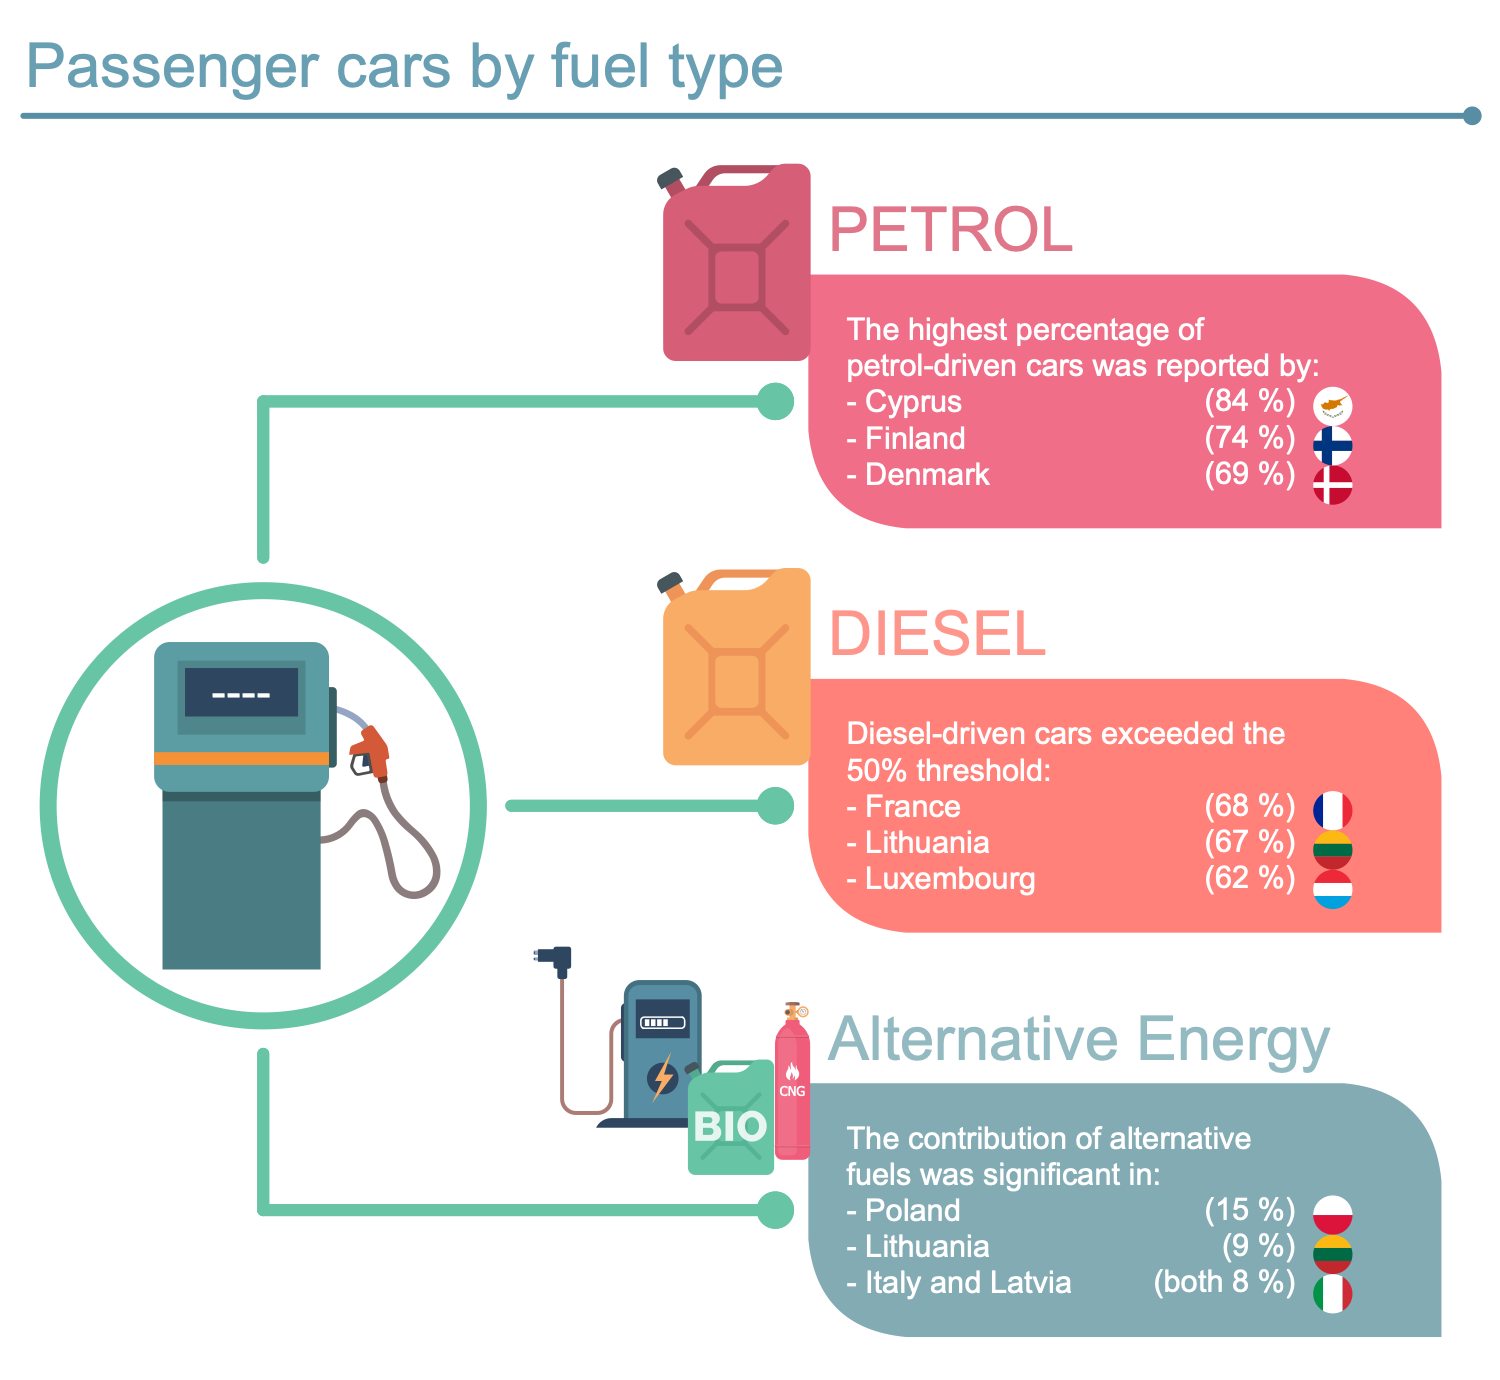
This sample shows the statistics on the prevalence of passenger cars by fuel type in EU countries in 2017. Today, people are free to choose cars according to the type of fuel. The three most popular groups are presented in this diagram: petrol-driven, diesel-driven, and alternative energy used cars. At this, the highest percentage of petrol-driven cars was reported in Cyprus (84%), Finland (74%), and Denmark (69%). The countries, where the diesel-driven cars exceeded the 50% threshold are France (68%), Lithuania (67%), and Luxembourg (62%). The contribution of alternative fuels is less than other ones, but however, it is also significant. This type of fuel is non-petroleum fuel. Alternative fuel vehicles are electric vehicles, hybrid electric vehicles, flex-fuel vehicles, solar electric vehicles, biodiesel vehicles, hydrogen vehicles, CNG vehicles, etc. Alternative fuel vehicles are the most common in Poland (15%), Lithuania (9%), Italy and Latvia (8% each).
Inside
What I Need to Get Started
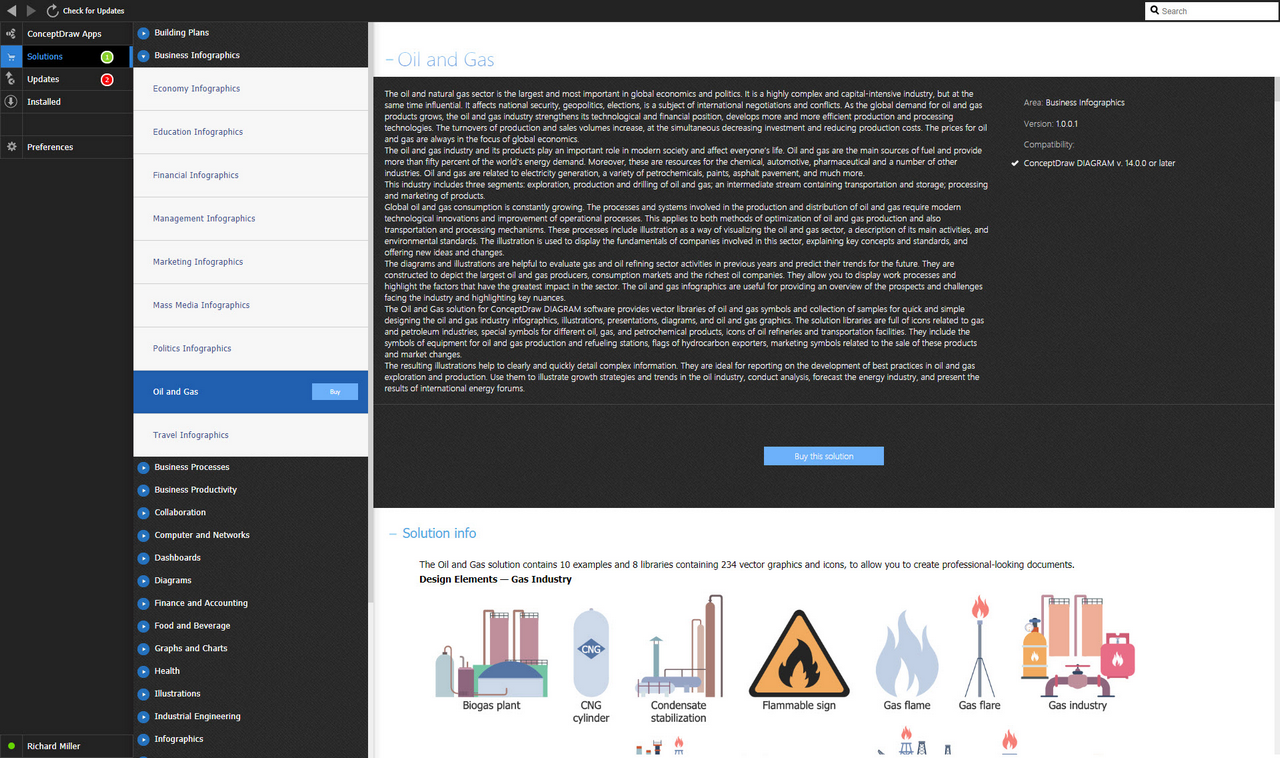
After ConceptDraw DIAGRAM is installed, the Oil and Gas solution can be purchased either from the Business Infographics area of ConceptDraw STORE itself or from our online store. Thus, you will be able to use the Oil and Gas solution straight after.
How to install
First of all, make sure that both ConceptDraw STORE and ConceptDraw DIAGRAM applications are downloaded and installed on your computer. Next, install the Oil and Gas solution from the ConceptDraw STORE to use it in the ConceptDraw DIAGRAM application.
Start using
Start using the Oil and Gas solution to make the professionally looking illustrations by adding the design elements taken from the stencil libraries and editing the pre-made examples that can be found there.
