- Electric and Telecom Plans Free
- Fire and Emergency Plans Free
- Floor Plans Free
- Plant Layout Plans Free
- School and Training Plans Free
- Seating Plans Free
- Security and Access Plans Free
- Site Plans Free
- Sport Field Plans Free
- Business Process Diagrams Free
- Business Process Mapping Free
- Classic Business Process Modeling Free
- Cross-Functional Flowcharts Free
- Event-driven Process Chain Diagrams Free
- IDEF Business Process Diagrams Free
- Logistics Flow Charts Free
- Workflow Diagrams Free
- ConceptDraw Dashboard for Facebook Free
- Mind Map Exchange Free
- MindTweet Free
- Note Exchange Free
- Project Exchange Free
- Social Media Response Free
- Active Directory Diagrams Free
- AWS Architecture Diagrams Free
- Azure Architecture Free
- Cisco Network Diagrams Free
- Cisco Networking Free
- Cloud Computing Diagrams Free
- Computer Network Diagrams Free
- Google Cloud Platform Free
- Interactive Voice Response Diagrams Free
- Network Layout Floor Plans Free
- Network Security Diagrams Free
- Rack Diagrams Free
- Telecommunication Network Diagrams Free
- Vehicular Networking Free
- Wireless Networks Free
- Comparison Dashboard Free
- Composition Dashboard Free
- Correlation Dashboard Free
- Frequency Distribution Dashboard Free
- Meter Dashboard Free
- Spatial Dashboard Free
- Status Dashboard Free
- Time Series Dashboard Free
- Basic Circle-Spoke Diagrams Free
- Basic Circular Arrows Diagrams Free
- Basic Venn Diagrams Free
- Block Diagrams Free
- Concept Maps Free
- Family Tree Free
- Flowcharts Free
- Basic Area Charts Free
- Basic Bar Graphs Free
- Basic Divided Bar Diagrams Free
- Basic Histograms Free
- Basic Line Graphs Free
- Basic Picture Graphs Free
- Basic Pie Charts Free
- Basic Scatter Diagrams Free
- Aerospace and Transport Free
- Artwork Free
- Audio, Video, Media Free
- Business and Finance Free
- Computers and Communications Free
- Holiday Free
- Manufacturing and Maintenance Free
- Nature Free
- People Free
- Presentation Clipart Free
- Safety and Security Free
- Analog Electronics Free
- Audio and Video Connectors Free
- Basic Circuit Diagrams Free
- Chemical and Process Engineering Free
- Digital Electronics Free
- Electrical Engineering Free
- Electron Tube Circuits Free
- Electronic Block Diagrams Free
- Fault Tree Analysis Diagrams Free
- GHS Hazard Pictograms Free
- Home Automation and Wiring Free
- Mechanical Engineering Free
- One-line Diagrams Free
- Power Сircuits Free
- Specification and Description Language (SDL) Free
- Telecom and AV Circuits Free
- Transport Hazard Pictograms Free
- Data-driven Infographics Free
- Pictorial Infographics Free
- Spatial Infographics Free
- Typography Infographics Free
- Calendars Free
- Decision Making Free
- Enterprise Architecture Diagrams Free
- Fishbone Diagrams Free
- Organizational Charts Free
- Plan-Do-Check-Act (PDCA) Free
- Seven Management and Planning Tools Free
- SWOT and TOWS Matrix Diagrams Free
- Timeline Diagrams Free
- Environmental, Social, and Corporate Governance $25
- Australia Map Free
- Continent Maps Free
- Directional Maps Free
- Germany Map Free
- Metro Map Free
- UK Map Free
- USA Maps Free
- Customer Journey Mapping Free
- Marketing Diagrams Free
- Matrices Free
- Pyramid Diagrams Free
- Sales Dashboard Free
- Sales Flowcharts Free
- Target and Circular Diagrams Free
- Cash Flow Reports Free
- Current Activities Reports Free
- Custom Excel Report Free
- Knowledge Reports Free
- MINDMAP Reports Free
- Overview Reports Free
- PM Agile Free
- PM Dashboards Free
- PM Docs Free
- PM Easy Free
- PM Meetings Free
- PM Planning Free
- PM Presentations Free
- PM Response Free
- Resource Usage Reports Free
- Visual Reports Free
- House of Quality Free
- Quality Mind Map Free
- Total Quality Management TQM Diagrams Free
- Value Stream Mapping Free
- Astronomy Free
- Biology Free
- Chemistry Free
- Language Learning Free
- Mathematics Free
- Physics Free
- Piano Sheet Music Free
- Android User Interface Free
- Class Hierarchy Tree Free
- Data Flow Diagrams (DFD) Free
- DOM Tree Free
- Entity-Relationship Diagram (ERD) Free
- EXPRESS-G data Modeling Diagram Free
- IDEF0 Diagrams Free
- iPhone User Interface Free
- Jackson Structured Programming (JSP) Diagrams Free
- macOS User Interface Free
- Object-Role Modeling (ORM) Diagrams Free
- Rapid UML Free
- SYSML Free
- Website Wireframe Free
- Windows 10 User Interface Free
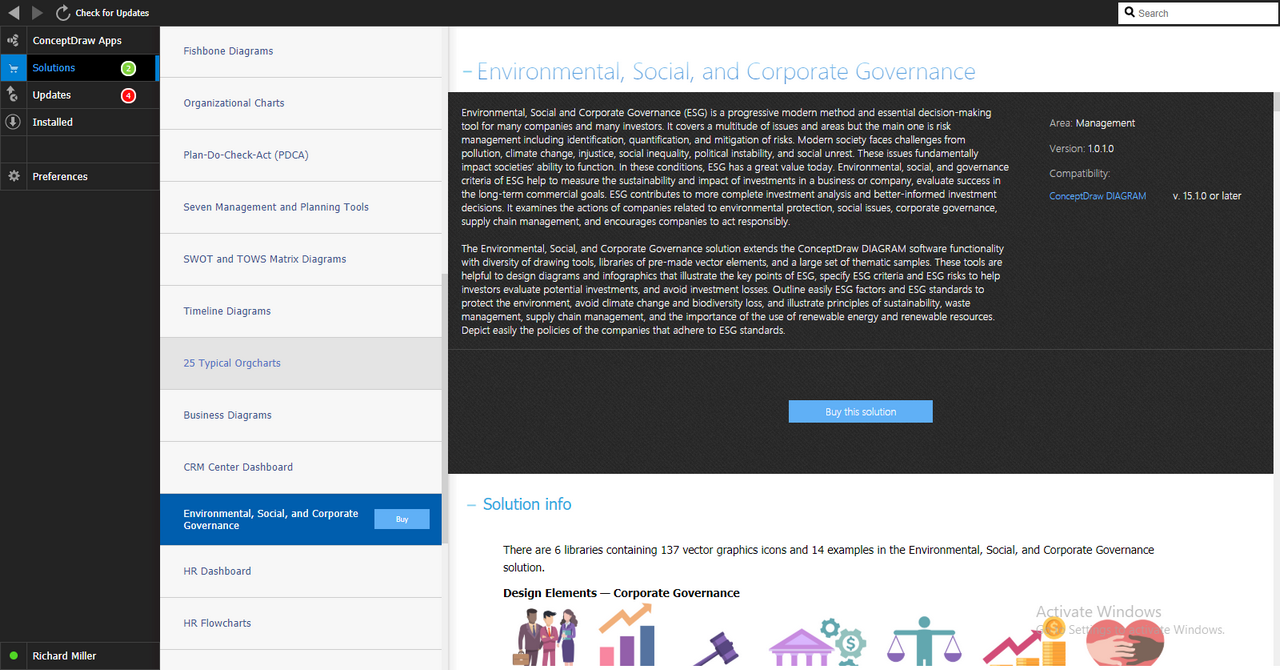
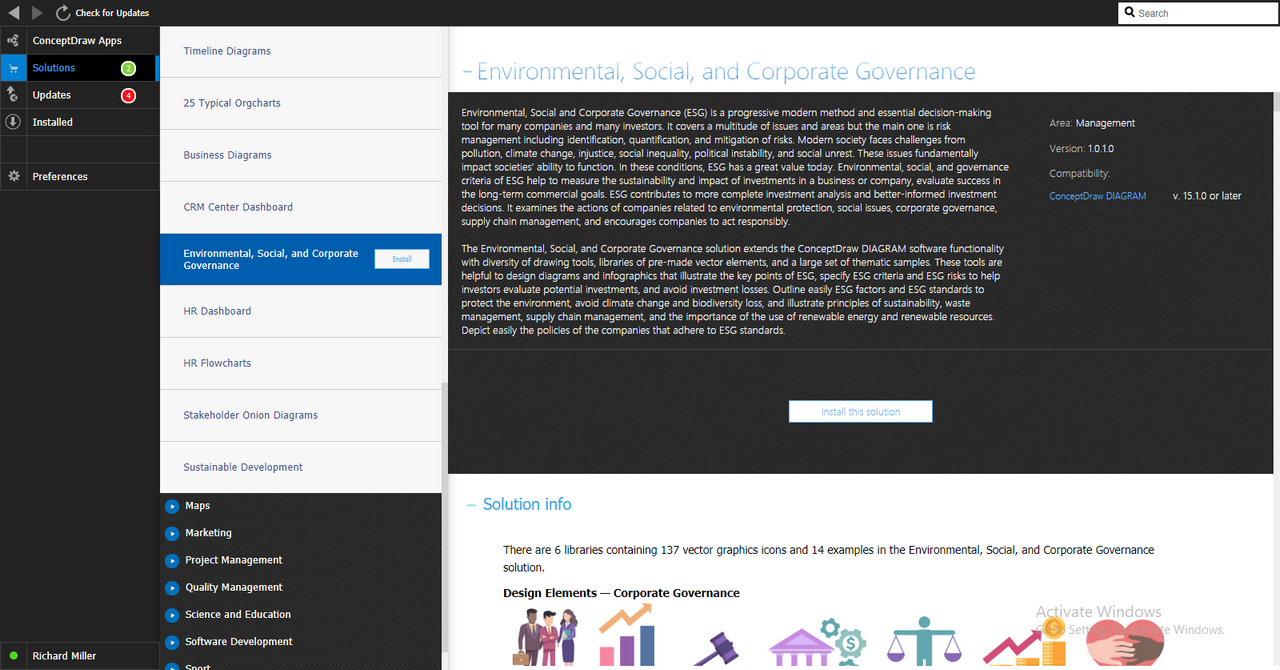
Environmental, Social, and Corporate Governance
Environmental, Social and Corporate Governance (ESG) is a progressive modern method and essential decision-making tool for many companies and many investors. It covers a multitude of issues and areas but the main one is risk management including identification, quantification, and mitigation of risks. Modern society faces challenges from pollution, climate change, injustice, social inequality, political instability, and social unrest. These issues fundamentally impact societies’ ability to function. In these conditions, ESG has a great value today.
Investors are interested in socially responsible companies. ESG contributes to more complete investment analysis and better-informed investment decisions. Most investors consider ESG criteria along with traditional financial analysis to compare companies and better assess risk when making investment decisions. The ESG examines the actions of companies related to environmental protection, social issues, corporate governance, supply chain management, and encourages companies to act responsibly. It is for this reason that investing in ESG is also referred to as sustainable investment and socially responsible investment.
Environmental criteria consider how a company protects the environment, avoids pollution of water, air, and soil, and limits emissions of harmful pollutants, chemicals, direct and indirect greenhouse gas emissions. These include renewable energy policy, waste management, resource depletion control, deforestation, and efforts to combat various climate risks, including climate change, floods, fires, etc.
Social criteria are focused on managing social relationships with suppliers, employees, customers and the communities in which the company operates. They take into account workplace policy, employee relations, conflict prevention, respect for human rights, health and safety policy, working conditions, equity, employee training and fair wages.
Governance criteria are related to the company's government and decision-making, tax strategy, audit, transparency of financial reporting, political stances and lobbying, donations, accountability, inclusivity, compliance, anti-bribery and corruption, and relationships with shareholders, investors, and customers.
These three ESG criteria help to measure the sustainability and impact of investments in a business or company, evaluate success in the long-term commercial goals. This is relevant information for investors who are considering companies, evaluating their behavior and determining future financial results before making an investment. Because environmental, social and governance performance has the highest priority for the investors. ESG helps to reduce risks and increase profitability. Because ESG-focused companies are more resilient, conscientious, and less risky. Therefore, investments in such organizations are currently growing.
The Environmental, Social, and Corporate Governance solution extends the ConceptDraw DIAGRAM software functionality with diversity of drawing tools, libraries of pre-made vector elements, and a large set of thematic samples. These tools are helpful to design diagrams and infographics that illustrate the key points of ESG, specify ESG criteria and ESG risks to help investors evaluate potential investments, and avoid investment losses. Outline easily ESG factors and ESG standards to protect the environment, avoid climate change and biodiversity loss, and illustrate principles of sustainability, waste management, supply chain management, and the importance of the use of renewable energy and renewable resources. Depict easily the policies of the companies that adhere to ESG standards.
-
Buy this solution $25 -
Solution Requirements - This solution requires the following products to be installed:
ConceptDraw DIAGRAM v18 - This solution requires the following products to be installed:
-
Support for this Solution -
Helpdesk
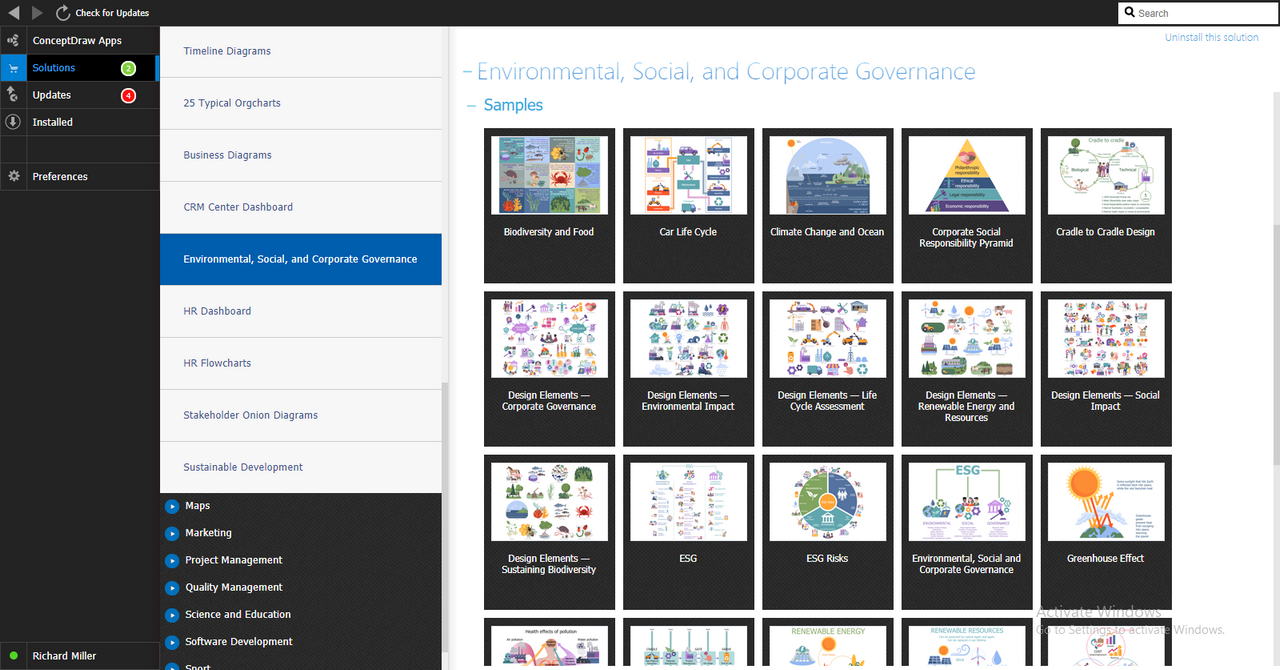
The Environmental, Social and Corporate Governance solution has 6 libraries containing 137 vector graphics icons and 14 examples. Created to help anyone who needs to present information in a compelling visual form that instantly conveys the meaning of ESG-related activities in the field of economy, environment and society.
Design Elements — Corporate Governance

Design Elements — Environmental Impact

Design Elements — Social Impact

Design Elements — Life Cycle Assessment

Design Elements — Renewable Energy and Resources

Design Elements — Sustaining Biodiversity

Environmental, Social, and Corporate Governance Examples
There are a few samples that you see on this page which were created in the ConceptDraw DIAGRAM application by using the Environmental, Social, and Corporate Governance solution. Some of the solution's capabilities as well as the professional results which you can achieve are all demonstrated here on this page.
All source documents are vector graphic documents which are always available for modifying, reviewing and/or converting to many different formats, such as MS PowerPoint, PDF file, MS Visio, and many other graphic ones from the ConceptDraw Solution Park or ConceptDraw STORE. The Environmental, Social, and Corporate Governance solutions are available to all ConceptDraw DIAGRAM users to install and use it for working in diagramming and drawing.
Example 1: Biodiversity and Food
This diagram was created in ConceptDraw DIAGRAM using a combination of libraries from the Environmental, Social, and Corporate Governance Solution. An experienced user spent 15 minutes creating this sample.
This sample shows the problem of biodiversity loss on Earth. Losses concern all forms of life: fauna, birds, insects, plants, and the underwater world. Biodiversity loss can be both local and global. At the same time, the local reduction or disappearance of individual species in a particular habitat is temporary or permanent. Meanwhile, global extinction is more serious. This is an irreversible process that causes a biodiversity crisis. However, even local death of some species can cause serious disturbances in the food chain and ultimately lead to global consequences. This sample reflects the world state and trends in this area, which are really important for the population. Because the negative impact on human health refers to the consequences of biodiversity loss. The current global loss of biodiversity is driven by population growth and human activities, changes in the use and management of land and water resources, overconsumption of resources, overfishing, and air, soil, and water pollution. This is the sixth mass extinction that is of great concern to international environmental organizations. The UN Convention on Biological Diversity sets global goals and obligations in this area.

Example 2: Car Life Cycle
This diagram was created in ConceptDraw DIAGRAM using a combination of libraries from the Environmental, Social, and Corporate Governance Solution. An experienced user spent 10 minutes creating this sample.
This sample shows an auto life cycle and is a way of its whole-life cost accounting from the construction to recycling. The cost of living is a key component of economic valuation. It includes financial costs for the material extraction and processing, auto production and operation, and longer-term costs including maintenance, depreciation, and recycling. It also contains environmental and social costs including energy extraction and refining costs, road construction, environmental costs, disaster preparedness and recovery costs, etc. These data have value for both manufacturers and consumers. They allow manufacturers to analyze and minimize whole-life costs considering direct, indirect, and intangible costs and draw conclusions about environmental costs. They also help consumers to compare several modifications, evaluate their value, costs, and benefits, and make a purchase decision. Because low costs to create or purchase do not mean further low long-term maintenance and operation costs. Furthermore, the initial saving may cause increased maintenance expenditure throughout the life cycle. A little additional initial investment can significantly decrease maintenance costs and help to create a worthwhile cost-effective product. The whole-life cost helps consumers choose a car that fits their needs and has the highest benefit-cost ratio option.

Example 3: Climate Change and Ocean
This diagram was created in ConceptDraw DIAGRAM using a combination of libraries from the Environmental, Social, and Corporate Governance Solution. An experienced user spent 15 minutes creating this sample.
This infographic sample shows an overview of climatic changes and their effects on the ocean. Ocean warming is one of the global issues nowadays. This sample helps investigate the cause and effects of ocean surface warming. The root cause is an excess of solar radiation entering the atmosphere. Being reflected by ice, this radiation is taken up by the surface of the ocean and causes its warming. Further heating leads to heating of the intermediate layer of water, melting of continental ice, which causes local desalination, thermal expansion and an increase in the ocean level. The heating of vast areas of the ocean surface causes enormous evaporation and salinization of the water. Decreased solubility of gases and reduced oxygen concentration in the ocean are also the result of ocean surface warming, which is detrimental to the entire marine ecosystem. In addition, an excess of anthropogenic carbon dioxide causes ocean acidification and a shortage of hydrocarbons. As a result, shells and other minerals dissolve, and the amount of marine phytoplankton is reduced.

Example 4: Corporate Social Responsibility Pyramid
This diagram was created in ConceptDraw DIAGRAM using a combination of libraries from the Environmental, Social, and Corporate Governance Solution. An experienced user spent 5 minutes creating this sample.
This sample is dedicated to corporate social responsibility (CSR). It is international private business self-regulation including internal responsibility and regulation at all levels including regional, national, and international. The offered pyramid describes corporate social responsibility as a combination of several responsibilities. It includes four levels: economic responsibility, legal responsibility, ethical responsibility, and philanthropic responsibility. CSR is a part of the strategic business development of a company. The coordination of CSR methods with a company's business model and their integration into it leads to success. In addition, CSR supports the brand's development and contribution to its reputation, social goals, and volunteering. It encourages companies in making a positive impact on the environment, reducing waste and pollution, participating in educational and social programs, and satisfying the interests and needs of all stakeholders including consumers, employees, investors, etc. Because the relations with the public have a positive impact on the business development and contribute to the enhancement of the company's profits.

Example 5: Cradle to Cradle Design
This diagram was created in ConceptDraw DIAGRAM using a combination of libraries from the Environmental, Social, and Corporate Governance Solution. An experienced user spent 10 minutes creating this sample.
This sample shows a cradle-to-cradle (C2C) approach to product and system design. It takes natural processes as the basis of an industry model and aims to create efficient and waste-free systems. The C2C concept suggests that industry should protect and enrich ecosystems. Also, according to C2C, all materials involved in the creation and operation of products must have a continuous life cycle. At the same time, materials are divided into biological and technical, depending on their nature, origin, and composition. The group of technical materials includes non-toxic and harmless synthetic materials that are reusable and continuously used, processed without loss of quality and integrity, and without harming the environment. Biological substances are of natural origin and their release into the environment during long-term use does not have a negative impact. They include organic products, nutrients, and plants. These substances decompose in the soil and enter the food chain as nutrients for bacteria. This sample also lists the key criteria for sustainable production: 100% renewable energy, sustainable use of water resources and clean water production, the positive impact of social responsibility on society, reuse of materials, recyclability and compostability, and consideration of the impact of materials on human health and the environment.

Example 6: Environmental, Social and Corporate Governance
This diagram was created in ConceptDraw DIAGRAM using a combination of libraries from the Environmental, Social, and Corporate Governance Solution. An experienced user spent 10 minutes creating this sample.
This infographic sample represents the key points of ESG. It is a complex approach including three aspects — environmental, social, and corporate governance. The environmental aspect includes climate change strategy, biodiversity, water efficiency, energy efficiency, carbon intensity, and environmental management system. The social aspect of ESG includes equal opportunities, freedom of association, health and safety, human rights, customer and products responsibility, and child labor. And finally, the governance aspect contains business ethics, compliance, board independence, executive compensation, and shareholder democracy. These are three directions according to which the companies provide sustainable development management. Today, investing in sustainability and working towards ESG goals is essential to the success of a company. Additional requirements for the activities of companies have appeared as a result of environmental degradation, global warming, economic inequality between rich and poor countries. The assessment of the compliance and degree of involvement of a company or corporation with the goals of the ESG is carried out by government organizations and financial institutions.

Example 7: ESG Risks
This diagram was created in ConceptDraw DIAGRAM using a combination of libraries from the Environmental, Social, and Corporate Governance Solution. An experienced user spent 10 minutes creating this sample.
The rapidly developed business world causes a complex of risks and changes. This infographic sample shows three categories of risks: environmental, social, and corporate governance (ESG) risks. The social risks are related to human health and safety, working conditions, employee relations, inequalities, diversity, and inclusion. The environmental risks are related to climate change and include environmental protection from pollution, waste, GHG emissions, loss of biodiversity, deforestation, and water security. The governance risks are related to the company's activities and include policies and standards, donations and political lobbying, executive remuneration, board diversity and structure, elimination of bribery and corruption. ESG risk management has incredibly important value. At the same time, for each specific industry, some aspects may be more relevant than others. The ESG risk management policy involves the timely identification, management and mitigation of ESG risks. This is necessary to reduce the negative impact on the environment, eliminate future risks, support sustainability, social justice and organize a balanced work of companies.

Example 8: ESG
This diagram was created in ConceptDraw DIAGRAM using a combination of libraries from the Environmental, Social, and Corporate Governance Solution. An experienced user spent 15 minutes creating this sample.
Today, the focus is on the protection of the environment, society, human rights, animal welfare, and corporate governance. As for the environment, the threat of climate change is extremely increasing, and more control over greenhouse gas emissions, waste and water management and other factors is required. This example infographic illustrates environmental, social and corporate governance (ESG) responsibilities. Environmental responsibilities are related to climate change, natural resources, waste management, innovation, greenhouse gas emissions, resource depletion, animal welfare, biodiversity, supply chain management, energy efficiency, and carbon intensity. Social responsibilities are the most extensive group. It includes all questions related to society, health, safety, working conditions, human rights, child labor, and human capital management. Social responsibilities also include employee relations, equal opportunities, freedom of association, customer and products responsibility, diversity, value chain, and impact on local communities. Corporate governance includes risk management, board diversity and structure, transparency, anti-bribery and corruption, political lobbying, executive compensation, shareholder rights, business ethics, and donations. Corporate governance directs and controls companies, turns their activities into accountable and transparent for investors.

Example 9: Greenhouse Effect
This diagram was created in ConceptDraw DIAGRAM using a combination of libraries from the Environmental, Social, and Corporate Governance Solution. An experienced user spent 5 minutes creating this sample.
This infographic sample illustrates the greenhouse effect. The Earth's atmosphere is transparent for the sunlight that passes through it and heats the planet's surface, and only some sunlight is reflected back into space. Greenhouse gases are capable to catch solar radiation energy within a planet's atmosphere. They include gases with three or more atoms and most diatomic gases with two different atoms. Water vapor, carbon dioxide (CO2), methane (CH4), tropospheric ozone are the most common examples of greenhouse gases. They differ in effect, residence time in the atmosphere, and altitude. In addition, greenhouse gases are divided into two groups: direct and indirect. Direct greenhouse gases can directly absorb solar energy in certain wavelength ranges, indirect greenhouse gases produce other greenhouse gases but do not absorb solar energy themselves. The warmed Earth's surface radiates heat taken from sunlight; greenhouse gases absorb it and prevent from escaping into space. As the result, the planet's warming occurs. Besides, greenhouse gases absorb and emit infrared radiation. They heat and pass heat to the surrounding air. When hitting the surface, radiant heat increases its temperature. The natural greenhouse effect is a process that allows our planet to keep warm and not freeze. But excessive greenhouse effect and increasing anthropogenic warming of the Earth is a problem at the moment.

Example 10: Health Effects of Pollution
This diagram was created in ConceptDraw DIAGRAM using a combination of libraries from the Environmental, Social, and Corporate Governance Solution. An experienced user spent 10 minutes creating this sample.
This infographic sample includes an overview of the main effects of environmental pollution on human health. The presence of harmful substances in the atmosphere, water and soil damages the environment, changes the climate, destroys the ozone layer, degrades the environment, harms the health of people and other living beings. The air pollution substances include methane, nitrous oxides, carbon dioxide, carbon monoxide, sulfur dioxide, particulates, and other substances. Water pollution is caused by both chemicals and biological microorganisms — bacteria and parasites. Soil contamination is mainly a result of human activities such as industrial activities, agricultural activities, sewage discharges, urban runoff, and improper disposal of waste. It is caused by pesticides, heavy metals, petroleum hydrocarbons, etc. All kinds of pollution caused by both human activities and natural phenomena are harmful factors for human health and can cause diseases of the respiratory, nervous, and cardiovascular systems, gastrointestinal tract, and other systems. They can cause allergies, skin irritations, nausea, gastroenteritis, cancer, and even death to humans and other living organisms. The health risks are related to both indirect and direct contact with the contaminated soil, vapor from the contaminants, drinking polluted water, and also bathing, washing, irrigation with it, human consumption of foods with toxic metals grown on the polluted soil, etc.

Example 11: Life-cycle Assessment
This diagram was created in ConceptDraw DIAGRAM using a combination of libraries from the Environmental, Social, and Corporate Governance Solution. An experienced user spent 10 minutes creating this sample.
This diagram shows the Life Cycle Assessment (LCA) stages. It is a methodology for evaluating cumulative environmental impacts including potential ones. LCA is associated with all stages of the life cycle of a process, service, or product, from "cradle-to-grave". In other words, it includes all stages from raw material extraction and processing, through the manufacture, distribution, use, and maintenance to the final disposal and recycling of the product. The main goal of the LCA is to document and improve the overall environmental profile of a certain product, service, or process. It includes the inventory of materials, accounting of energy inputs, calculation of emissions to the environment and ecological consequences, and considers the impact on human health. Estimating the potential environmental impact is made based on the inputs and identified releases. The recommended ISO LCA standard is used to calculate LCA. However, some deviations and application of various methods are acceptable. The results of LCA help to detect the products, services, and processes with minimal impact on the environment.

Example 12: Renewable Energy
This diagram was created in ConceptDraw DIAGRAM using a combination of libraries from the Environmental, Social, and Corporate Governance Solution. An experienced user spent 5 minutes creating this sample.
Energy is a fuel of life and a necessity in the modern world. Today, two types of energy are used — renewable and non-renewable. Renewable energy is a more preferable type of energy because it is accumulated from renewable resources that are naturally replenished. In addition, renewable energy resources exist over vast geographic areas, in contrast to non-renewable energy sources that are concentrated in limited areas. The vast majority of newly installed energy generation systems around the world are renewable. This sample ESG infographic shows the most common forms of renewable energy: solar, hydro, geothermal, wind, and biomass. Renewable energy is often used to generate electricity for the grid, to power off-grid systems, to heat or cool air and water. Most renewable energy sources are sustainable. With rapid technological developments, renewable energy systems are becoming more efficient and cheaper, and their popularity is growing. Renewable energy sources currently account for about 20% of global energy consumption and this amount will increase. Research even shows that a global transition to 100% renewable energy across all sectors is also possible and cost-effective.

Example 13: Renewable Resources
This diagram was created in ConceptDraw DIAGRAM using a combination of libraries from the Environmental, Social, and Corporate Governance Solution. An experienced user spent 5 minutes creating this sample.
This ESG infographic sample shows renewable natural resources. These resources are restored, reproduced again and again, and replaced in a short and finite amount of time. Renewable energy resources are a part of Earth's natural environment and the largest components of Earth's ecosphere. Sunlight, wind, rain, tides, waves, and geothermal heat are examples of renewable energy sources. They exist over wide geographical areas and are replenished after their depletion by usage and consumption. The use of renewable energy sources has many advantages, in addition to being inexhaustible, reliable and sustainable, reduce global warming, improve public health and provide stable energy prices. Many countries are looking to increase their share of the renewable energy market; some of them even offer special discounts for consumers. Meanwhile, the use of renewable resources also requires careful management so as not to exceed nature's ability to replenish them. Because in an environment of growing demand, unregulated industrial development and overuse of resources can have unexpected negative results. Scientific research and life cycle assessments help assess the sustainability of various natural resources.

Example 14: Triple Bottom Line
This diagram was created in ConceptDraw DIAGRAM using a combination of libraries from the Environmental, Social, and Corporate Governance Solution. An experienced user spent 10 minutes creating this sample.
This infographic shows a triple bottom line (TBL or 3BL). It is an accounting system used to evaluate the performance of a company or organization and add value to the business. The traditional accounting system takes into account only financial results. TBL expands on the traditional reporting structure to include three parts: social, environmental (or ecological), and economic (or financial). TBL's social line includes charitable contributions, employee welfare and fair trade. The ecological line includes waste management, resource consumption and land use. And the economic line includes the costs of underemployment, growth, and income. Taking into account the social and environmental impact of the company is really important. After all, if its activities cause a negative environmental impact, which requires additional costs and efforts to eliminate, any positive results lose their meaning. In addition, TBL assumes that all stakeholders, all people influencing the activities of the company, including employees, suppliers, customers, creditors, government agencies and others, are responsible. TBL helps companies analyze their operations and maximize profits without compromising the environment. The publication of data showing a positive environmental impact is encouraged.

Inside

What I Need to Get Started
After ConceptDraw DIAGRAM is installed, the Environmental, Social, and Corporate Governance solution can be purchased either from the Management area of ConceptDraw STORE itself or from our online store. Thus, you will be able to use the Environmental, Social, and Corporate Governance solution straight after.
How to install
First of all, make sure that both ConceptDraw STORE and ConceptDraw DIAGRAM applications are downloaded and installed on your computer. Next, install the Environmental, Social, and Corporate Governance solution from the ConceptDraw STORE to use it in the ConceptDraw DIAGRAM application.
Start using
Using the Environmental Social and Corporate Governance solution, by adding design elements taken from template libraries, and editing pre-made examples, you will get a description of the policies of companies that adhere to ESG standards to help investors assess risks and make profitable investments.