 Public Utilities
|
|
Success in development innovative strategies and technologies in public utility field, enhance their efficiency and availability. Design efficiently any technical drawing, infographics and diagrams about public utilities; create plumbing plan, heating plan, electrical diagram easily with public utility icons from the vector icons libraries. |
|
 Critical Infrastructure Sectors
|
|
Succeed in designing infographics and diagrams related to new technologies and newest equipment for critical infrastructure protection, energy sector, increasing equipment resilience, prevention physical, environmental, and cyber threats, communications, development of information technology and detection equipment, financial services, emergency services, homeland security, cybersecurity. |
|
 Piano Sheet Music
|
|
Use this solution for music notation software to express yourself through music, to create own unique musical pieces, make piano sheet music, or display the sheet music with compositions of famous composers at the blank sheet music using pre-made musical symbols and notes vector images relevant to internationally accepted music notation. |
|
 MindMap Diagrams
|
|
This solution offers a set of samples and templates, which you can use to create a Mind Map document with Funnel Diagram, PESTLE Analysis Diagram, Stakeholder Onion Diagram, Venn Diagram, or Matrix Diagram. |
|
 Internet of Things
|
|
Implement efficiently the automation in homes, enterprises and industries with Internet of Things (IoT) and Web of Things (WoT) diagrams and infographics. Clipart, pictograms and symbols of IoT sensors, IoT devices, smart appliances, retail, industrial, agricultural and other IoT devices are beneficial for the development process. |
|
 Medical Mycology
|
|
This solution contains tools effective for compiling an overview of fungal diseases, fungal pathogens, mold, fungal mycotoxins, their diagnosing, dangerous effects of fungi on humans and animals, ways to avoid infection including personal hygiene, antifungal therapy and immunotherapy, the latest advances in medical mycology, treating mycosis, fungal meningitis. |
|
 Environmental, Social, and Corporate Governance
|
|
Illustrate easily the key points of ESG, diversity of ESG criteria, risks, factors, principles of sustainability, waste management, supply chain management, and standards to protect the environment, avoid climate change and biodiversity loss. Outline policies of the companies that adhere to ESG standards to help investors assess risks and make profitable investments. |
|
 Sustainable Development
|
|
Design and implement effectively the principles of sustainable development and social sustainability, construction a smart city and introduction sustainable agriculture, depict the UN sustainable development goals, illustrate the sources of green energy and sustainable energy. |
|
 One-line Diagrams
|
|
This solution is a powerful help for power engineering and helps in one-line drawing. Use the included electrical symbol elements to create One-line Diagram, Single-line Diagram, Electrical diagram, or electrical engineering diagram with no sweat. |
|
 Analog Electronics
|
|
Design effectively analog electronic circuits, electrical engineering diagrams, electronic engineering designs, and analog circuits schematics using solution’s pre-made special objects and analog electronics symbols.
|
|
 Electronic Block Diagrams
|
|
Simple electrical engineering, electronic equipment design, description structure, information flow, energy, pulse train are now a reality thanks to the electronic and electrical symbols of electronic blocks, amplifiers, repeaters, converters, pulses, and much more offered by solution libraries. |
|
 Telecom and AV Circuits
|
|
Design and visualize telecom networks and audio-video equipment efficiently and maximize performance, develop equipment for electrical engineering, telecom and AV construct schematics and diagrams including 3 way switch diagram with pre-made symbols of audio, video, TV and telegraph equipment, antennas, antenna TV, etc. |
|
 Power Сircuits
|
|
This solution includes powerful drawing tools, circuit symbols and electrical symbols of transformers, electric generators, electrical motors, transmission lines, and more equipment. They simplify Power Circuit Diagram design, displaying the functional parts and connections in electrical circuit, principles of operation of electrical and power mechanisms, one-phase and three-phase power generation. |
|
 Basic Circuit Diagrams
|
|
The solution’s internationally standardized electrical symbols including resistor symbol, diode symbol, inductor, amplifier, and more are effective for electrical engineering, designing electrical circuit diagram, electrical schematic, wiring diagram, electronic schematics, and more. |
|
 Green Energy
|
|
Apply solution tools to design colorful green energy infographics and illustrations about solar power, wind power, hydropower, tidal power, and more types of renewable energy and cleaner energy. Illustrate the principle of work of energy generation equipment including how do solar panels work. |
|
 Energy Industry Infographics
|
|
Easily create energy-related business infographics, diagrams, and illustrations using predesigned energy icons and industry symbols. Create professionally-designed electrical power industry diagrams, energy distribution schematics, electrical substation diagram, energy intelligence dashboards, electricity grid schematics for documents and presentations. Large collection of included industry icons is indispensable for all professionals working in energy industry. |
|
 Oil and Gas
|
|
Use this solution to design oil and gas industry infographics, illustrations, presentations, diagrams, reports. Construct oil and gas graphics, illustrate the growth strategies and trends in the oil industry, results of energy forums. Make analysis and generate forecasts in the energy industry using the pre-made oil and gas symbols. |
|
 Immunology
|
|
This solution is useful for designing illustrations, diagrams, infographics, presentation on the subject of immunology, immunochemistry, immunodiagnosis, immunotherapy, immunoassay, immunoreceptors, antibodies, antigens and pathogens, antibody microarray, immune booster, immunization and vaccination, diagnostics, treatment and prevention of diseases of the immune system, development pharmaceutical immunopreparations, vaccines, diagnosticums, antiserums, immunoglobulins, monoclonal antibodies, immunomodulators, immunosuppressors, immunostimulators. |
|
 Mass Media Infographics
|
|
Design easily the impressive mass media and social media content, share it on your websites and social media sites, succeed in social media marketing, social media management, digital media marketing, interact effectively with your target audience through social platforms Facebook, Instagram, Twitter, Pinterest, get likes and get into the top in media charts. |
|
 Medical Virology
|
|
Design high-quality illustrations and diagrams on the medical virology and immunology topics, infographics and charts according infection and treatment the viral infection, vaccination against infectious diseases, immunization and obtaining herd immunity, presentation slides on microbiology researches, actual virology problems, and the development of effective vaccines. |
|
 Politics Infographics
|
|
Focus on the visuality in political science, make attractive, creative and effective politics infographics, diagrams, presentations, illustrations, outline the main points of programs of political parties, country's foreign policy, identity politics, illustrate and present political polls results, or depict political news easily with solution’s tools. |
|
 Summer Sports
|
|
Succeed in illustration and design on summer sports thematic with ConceptDraw’s Summer Sports solution. Design anything from the infographics about your favorite sport to the presentations slides and advertising materials fast and easy. |
|
 Project Diagrams
|
|
Succeed in implementation your projects and designing the Project Diagrams of different kinds, Hierarchical Charts, Influence Diagrams, Work Breakdown Structure, Organization Breakdown Structure, Resource Breakdown Structure, PERT Chart, PERT Diagram, Project Management Chart, Project Network Diagram, Network Diagram Project Management, Project Timeline, Precedence Diagram, Gantt Diagram, Gantt Chart with ConceptDraw’s Project Diagrams solution. |
|
 Travel Infographics
|
|
Create in minutes exceptional travel infographics, business travel infographics, travel illustrations, diagrams, schematics, plans, presentations, maps, posters, billboards, advertising, marketing, and other materials related with travel and tourism, outdoor activities and extreme sports using the best Travel Infographics solution. |
|
 DOM Tree
|
|
Use it to design in a moment the Document Object Model (DOM model), DOM tree diagram, DOM hierarchy in ConceptDraw DIAGRAM, or make the DOM Tree Mind Map in ConceptDraw MINDMAP and instantly autogenerate the ConceptDraw DIAGRAM file. |
|
 Class Hierarchy Tree
|
|
Succeed in object oriented programming, building the Java class hierarchy, Python class hierarchy, in organizing the code, demonstrating the work of classes, constructing the Class Hierarchy Trees and Class Hierarchy Mind Maps with their further autogeneration from ConceptDraw MINDMAP to ConceptDraw DIAGRAM file. |
|
 Family Tree
|
|
Explore your family roots and design colorful, informative and accurate family tree, genealogy tree or ancestry tree with help of ConceptDraw DIAGRAM family tree maker including Family Tree solution. |
|
 Kanban Board
|
|
Apply the Kanban Board solution to experience all advantages of the Kanban approach and Kanban board agile project management. Start with Kanban Board example, depict the Kanban flow on your own Kanban Task Board and improve your workflow efficiency and personal effectiveness. |
|
 Genogram
|
|
Use the ConceptDraw’s Genogram solution to construct the informative Genograms, family tree, genealogy schematics of any generations’ depth, which are going to become a perfect base for medical and psychology analytics and therapy. |
|
 Cisco Networking
|
|
Use Cisco Networking solution to succeed in designing network configurations using the Cisco network equipment and devices, in modeling networks, in installing Cisco equipment, managing networks and ensuring their security. |
|
 Health Package
|
|
12 solutions, 105 libraries, 2 843 vector objects and pictograms, 134 examples and templates.
Graphics Package includes solutions:
Allergology, Immunology, Medical Virology, Human Anatomy, Pharmacy Illustrations, Health Sciences, Medical Illustrations, Biomedicine, Medical Mycology, Healthcare Management Workflow Diagrams, Health Food, Genogram.
$444 value for only $180 |
|
 Business Diagrams
|
|
Build and develop your business easily and with pleasure, describe the business processes, visualize the results of company’s work, compare and analyze the business characteristics and economic indicators, and track your business development in dynamics with the help of Business Diagrams Solution and Bubble Diagrams, Circle-Spoke Diagrams, Circular Arrows Diagrams, and Venn Diagrams that are designed with its help in just minutes. |
|
 Business Management Package
|
|
26 solutions, 182 libraries, 4 781 vector objects and pictograms, 353 examples and templates.
Graphics Package includes solutions:
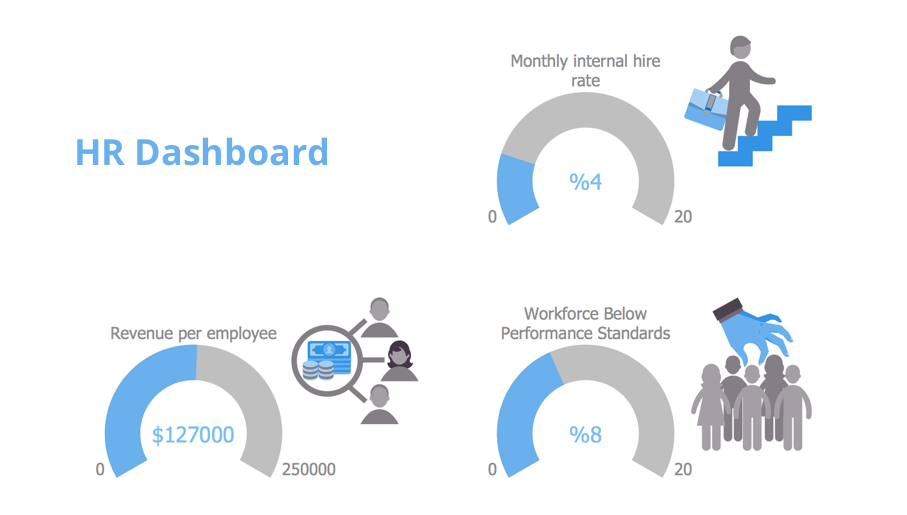
Business Intelligence Dashboard, Management Infographics, Logistic Dashboard, Education Infographics, Landscape and Garden, Financial Infographics, Business Process Workflow Diagrams, Cooking Recipes, Health Food, Marketing Infographics, 25 Typical Orgcharts, HR Flowcharts, Stakeholder Onion Diagrams, CRM Center Dashboard, Funnel Diagrams, Scrum Workflow, Seven Basic Tools of Quality, HR Dashboard, Area Charts, Bar Graphs, Pie Charts, Line Graphs, Divided Bar Diagrams, Histograms, Picture Graphs, Scatter Diagrams.
$917 value for only $367 |
|
 Business Diagrams Package
|
|
20 solutions, 128 libraries, 3 590 vector objects and pictograms, 278 examples and templates.
Graphics Package includes solutions:
Management Infographics, Education Infographics, Financial Infographics, Business Process Workflow Diagrams, Marketing Infographics, 25 Typical Orgcharts, HR Flowcharts, Stakeholder Onion Diagrams, Funnel Diagrams, Seven Basic Tools of Quality, Cooking Recipes, Health Food, Area Charts, Bar Graphs, Pie Charts, Line Graphs, Divided Bar Diagrams, Histograms, Picture Graphs, Scatter Diagrams.
$573 value for only $230 |
|
 Decision Making
|
|
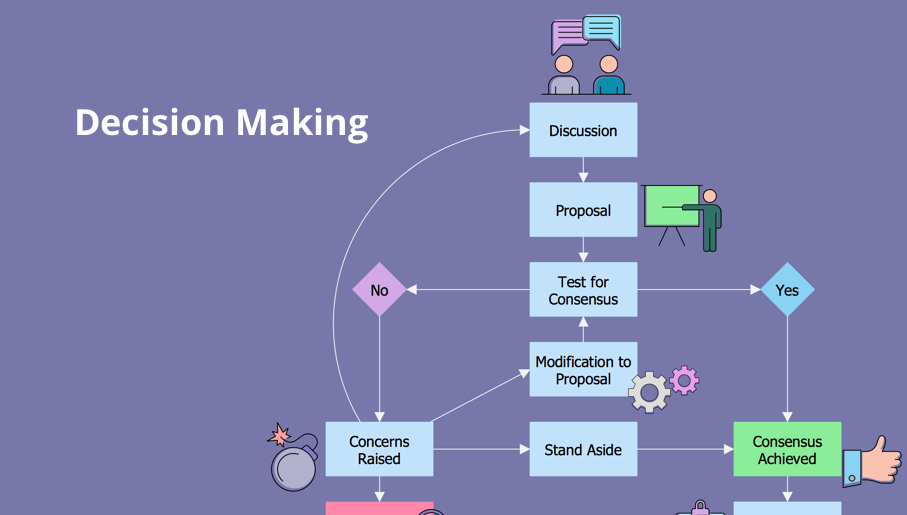
The best for decision-makers, the Decision Making solution perfectly suits for decision-making, decision tree analysis, analytic hierarchy process (AHP), designing Decision diagrams, Business decision maps, Decision flowcharts, Decision trees, Decision matrix, T Chart, and Influence diagrams without any efforts and even drawing skills. |
|
 PM Mind Maps and Tables
|
|
To excel in project management process, project scope management and project planning with solution tools for ConceptDraw DIAGRAM and ConceptDraw MINDMAP. Project manager can easily realize his/her project manager duties and design any project chart, matrix, table, Mind Map, and project presentation based on a predesigned template or sample in a few minutes. |
|
 Education Package
|
|
11 solutions, 29 libraries, 599 vector object and icons, 151 examples and templates.
Graphics Package includes solutions:
Education Infographics, Business Intelligence Dashboard, Business Diagrams, Area Charts, Bar Graphs, Divided Bar Diagrams, Histograms, Line Graphs, Picture Graphs, Pie Charts, Scatter Diagrams.
$398 value for only $160 |
|
 Building Design Package
|
|
7 solutions, 71 libraries, 2 635 vector object and icons, 96 examples and templates.
Graphics Package includes solutions:
Cafe and Restaurant Floor Plans, Gym and Spa Area Plans, HVAC Plans, Landscape & Garden, Office Layout Plans, Plumbing and Piping Plans, Reflected Ceiling Plans.
$295 value for only $118 |
|
 Scrum Workflow
|
|
Succeed in applying Agile methodology and Scrum methodology for software development, and effectively design pictorial and attractive Scrum Charts, Scrum Workflow Diagrams, Scrum Infographics, Scrum Mind Maps, Scrum board with Scrum Workflow solution. |
|
 Azure Architecture
|
|
ConceptDraw teams up with Microsoft to bring the Azure Diagrams solution, a selection of Azure themed graphics and templates, allowing you to create effective Azure architecture diagrams. |
|
 Landscape & Garden
|
|
A solution for all budding horticulturalists. Before you start tearing up your lawn, use the Landscape & Garden solution to visualize a potential garden design or theme. |
|
 25 Typical Orgcharts
|
|
Whatever the size, scope or structure of your business, the 25 Typical Orgcharts solution gives you the tools to professionally chart an organization's hierarchy. 25 distinct templates means you won't be lacking for inspiration. |
|
 Customer Journey Mapping
|
|
Use the customer journey mapping methodology and succeed in understanding users’ needs and in improving your products with Customer Journey Mapping Solution for ConceptDraw DIAGRAM. |
|
 Reflected Ceiling Plans
|
|
Mind your head! Or not, if using this solution. Use it to map out light fixtures, ceiling structures and ventilation shafts. |
|
 Cafe and Restaurant Floor Plans
|
|
Before you commit to a restaurant design, use ConceptDraw to visualize your dining area and kitchen. The best culinary experience comes from detailed planning. |
|
 Floor Plans
|
|
This solution allows you to visualize any domestic floor space, and to fill your design with a large variety of household elements. Create plans for a home, apartment, or hotel. |
|
 AWS Architecture Diagrams
|
|
The solution includes the icons Amazon notation suggests to be used when creating architecture diagrams describing your use of Amazon Web Services or Amazon Cloud Services. |
|
 PM Personal Time Management
|
|
Be effective in project management and personal time management, generate easily your personal To-Do lists, personal calendars, personal assignment lists, project checklists, and communicate with your colleagues using e-mail and sending project Microreports via e-mail with one click. |
|