- Electric and Telecom Plans Free
- Fire and Emergency Plans Free
- Floor Plans Free
- Plant Layout Plans Free
- School and Training Plans Free
- Seating Plans Free
- Security and Access Plans Free
- Site Plans Free
- Sport Field Plans Free
- Business Process Diagrams Free
- Business Process Mapping Free
- Classic Business Process Modeling Free
- Cross-Functional Flowcharts Free
- Event-driven Process Chain Diagrams Free
- IDEF Business Process Diagrams Free
- Logistics Flow Charts Free
- Workflow Diagrams Free
- ConceptDraw Dashboard for Facebook Free
- Mind Map Exchange Free
- MindTweet Free
- Note Exchange Free
- Project Exchange Free
- Social Media Response Free
- Active Directory Diagrams Free
- AWS Architecture Diagrams Free
- Azure Architecture Free
- Cisco Network Diagrams Free
- Cisco Networking Free
- Cloud Computing Diagrams Free
- Computer Network Diagrams Free
- Google Cloud Platform Free
- Interactive Voice Response Diagrams Free
- Network Layout Floor Plans Free
- Network Security Diagrams Free
- Rack Diagrams Free
- Telecommunication Network Diagrams Free
- Vehicular Networking Free
- Wireless Networks Free
- Comparison Dashboard Free
- Composition Dashboard Free
- Correlation Dashboard Free
- Frequency Distribution Dashboard Free
- Meter Dashboard Free
- Spatial Dashboard Free
- Status Dashboard Free
- Time Series Dashboard Free
- Basic Circle-Spoke Diagrams Free
- Basic Circular Arrows Diagrams Free
- Basic Venn Diagrams Free
- Block Diagrams Free
- Concept Maps Free
- Family Tree Free
- Flowcharts Free
- Basic Area Charts Free
- Basic Bar Graphs Free
- Basic Divided Bar Diagrams Free
- Basic Histograms Free
- Basic Line Graphs Free
- Basic Picture Graphs Free
- Basic Pie Charts Free
- Basic Scatter Diagrams Free
- Aerospace and Transport Free
- Artwork Free
- Audio, Video, Media Free
- Business and Finance Free
- Computers and Communications Free
- Holiday Free
- Manufacturing and Maintenance Free
- Nature Free
- People Free
- Presentation Clipart Free
- Safety and Security Free
- Analog Electronics Free
- Audio and Video Connectors Free
- Basic Circuit Diagrams Free
- Chemical and Process Engineering Free
- Digital Electronics Free
- Electrical Engineering Free
- Electron Tube Circuits Free
- Electronic Block Diagrams Free
- Fault Tree Analysis Diagrams Free
- GHS Hazard Pictograms Free
- Home Automation and Wiring Free
- Mechanical Engineering Free
- One-line Diagrams Free
- Power Сircuits Free
- Specification and Description Language (SDL) Free
- Telecom and AV Circuits Free
- Transport Hazard Pictograms Free
- Data-driven Infographics Free
- Pictorial Infographics Free
- Spatial Infographics Free
- Typography Infographics Free
- Calendars Free
- Decision Making Free
- Enterprise Architecture Diagrams Free
- Fishbone Diagrams Free
- Organizational Charts Free
- Plan-Do-Check-Act (PDCA) Free
- Seven Management and Planning Tools Free
- SWOT and TOWS Matrix Diagrams Free
- Timeline Diagrams Free
- HR Dashboard $49
- Australia Map Free
- Continent Maps Free
- Directional Maps Free
- Germany Map Free
- Metro Map Free
- UK Map Free
- USA Maps Free
- Customer Journey Mapping Free
- Marketing Diagrams Free
- Matrices Free
- Pyramid Diagrams Free
- Sales Dashboard Free
- Sales Flowcharts Free
- Target and Circular Diagrams Free
- Cash Flow Reports Free
- Current Activities Reports Free
- Custom Excel Report Free
- Knowledge Reports Free
- MINDMAP Reports Free
- Overview Reports Free
- PM Agile Free
- PM Dashboards Free
- PM Docs Free
- PM Easy Free
- PM Meetings Free
- PM Planning Free
- PM Presentations Free
- PM Response Free
- Resource Usage Reports Free
- Visual Reports Free
- House of Quality Free
- Quality Mind Map Free
- Total Quality Management TQM Diagrams Free
- Value Stream Mapping Free
- Astronomy Free
- Biology Free
- Chemistry Free
- Language Learning Free
- Mathematics Free
- Physics Free
- Piano Sheet Music Free
- Android User Interface Free
- Class Hierarchy Tree Free
- Data Flow Diagrams (DFD) Free
- DOM Tree Free
- Entity-Relationship Diagram (ERD) Free
- EXPRESS-G data Modeling Diagram Free
- IDEF0 Diagrams Free
- iPhone User Interface Free
- Jackson Structured Programming (JSP) Diagrams Free
- macOS User Interface Free
- Object-Role Modeling (ORM) Diagrams Free
- Rapid UML Free
- SYSML Free
- Website Wireframe Free
- Windows 10 User Interface Free
HR Dashboard
The data visualization is incredibly important and useful in any field of activity, it assists in better understanding, representing and perception the information, as well as contributes for easy data analysis. The dashboards are effective tool, which allow to transform a huge amount of information and data on a single page with brief results, and to make the key decisions based on the analysis of this information. The collection of information, its structuring, processing and analysis are important for effective work of the company, for maintaining the high performance, and the HR Dashboards are incredibly effective assistant in these questions. The clear visualization of data and activity results is especially important in a field of HR (human resources), for HR managers, directors of departments, high management and other interested employees. HR dashboards systematize and clearly reflect the financial performance, the key performance indicators (KPIs) of the company, the reports in a form of charts, graphs, indicators, metrics, maps, etc. They are indispensable for analysis of labor productivity and identifying the areas that need to be improved in the company. The representation of data in a graphical form allows to track immediately all information and to evaluate the company's progress towards its objectives.
The HR Dashboard solution extends ConceptDraw DIAGRAM functionality with powerful drawing tools and great collection of comprehensive vector design elements, icons, pictograms and objects, navigation elements, live objects of HR charts, HR indicators, and thematic maps. The range of HR Dashboards applications is extensive, among them the human resource management, recruitment, hiring process, human resource development. ConceptDraw DIAGRAM software is perfect for creation HR Dashboard with any goal you need. It gives you all opportunities for designing not only informative, but also professional looking and attractive HR Dashboards that are perfect for using in presentations, reports and other thematic documents. Besides, you are free to choose the style and degree of detalization of your HR Dashboard diagrams.
-
Buy this solution $49 -
Solution Requirements - This solution requires the following products to be installed:
ConceptDraw DIAGRAM v18 - This solution requires the following products to be installed:
-
Compatibility - Sonoma (14), Sonoma (15)
MS Windows 10, 11 - Sonoma (14), Sonoma (15)
-
Support for this Solution -
Helpdesk
The HR Dashboard solution contains 10 examples and 5 libraries containing 103 vector objects and pictograms.
Design Elements — HR Icons
Design Elements — HR Charts

Design Elements — HR Indicators

Design Elements — HR Navigation

Design Elements — HR Maps

Related News:
HR Dashboard Examples
The samples you see on this page were created in ConceptDraw DIAGRAM using the HR Dashboard Solution; they demonstrate a portion of the solution's capabilities and the professional results you can achieve.
There are a few samples that you see on this page which were created in the ConceptDraw DIAGRAM application by using the HR Dashboard solution. Some of the solution's capabilities as well as the professional results which you can achieve are all demonstrated here on this page.
All source documents are vector graphic documents which are always available for modifying, reviewing and/or converting to many different formats, such as MS PowerPoint, PDF file, MS Visio, and many other graphic ones from the ConceptDraw Solution Park or ConceptDraw STORE. The HR Dashboard solution is available to all ConceptDraw DIAGRAM users to get installed and used while working in the ConceptDraw DIAGRAM diagramming and drawing software.
Example 1: HR Dashboard
This diagram was created in ConceptDraw DIAGRAM using the combination of libraries from the HR Dashboard Solution. An experienced user spent 15 minutes creating this sample.
The range of dashboards applications is extremely wide, among them the human resource management and human resource development, recruitment, hiring, and others. This HR dashboard sample illustrates the business metrics and KPIs for human resources management: the headcount, male and female ratio, employee distribution by salary, and the headcount by departments. The HR Dashboard solution from the Management area of ConceptDraw Solution Park is a real helper in questions of designing the diagrams and dashboards reflecting the real situation in a company or organization, in representing the main KPIs and depicting the HR indicators and metrics, also in analyzing their values. All objects included to solution’s libraries are fully ready for use and only require the entering of corresponding values. The different types of graphics and dashboards allow to represent diverse information and data from different sides and to depict varied indicators. The correctly chosen predesigned clipart images add for HR dashboards much more clarity.

Example 2: HR Metrics Dashboard
This diagram was created in ConceptDraw DIAGRAM using the combination of libraries from the HR Dashboard Solution. An experienced user spent 10 minutes creating this sample.
The measurements are applied in many fields, including the manufacturing field, financial and business spheres, where the measurement and monitoring of many indicators and metrics are realized constantly. The Human Resource (HR) metrics are the measurements applied in HR to determine, to monitor and to compare varied HR parameters, their values, as well as the effectiveness of HR initiatives. This HR performance dashboard sample depicts the HR metrics by departments at a company or organization: the number of co-workers, their salaries, bonuses, overtime and slick days. There are three tabs on this sample: Administration and Finance, Marketing and Sales, and Production, which represent different organization departments and the corresponding values of metrics can be set and changed on them. Styled in green and blue colors, this diagram looks like calmly, and at the same time attractively and trendy, so it will be actual in any presentation, report, or other document.

Example 3: HR Performance Dashboard
This diagram was created in ConceptDraw DIAGRAM using the combination of libraries from the HR Dashboard Solution. An experienced user spent 10 minutes creating this sample.
The dashboards are the popular and widely used tools that are often used to represent the key performance indicators (KPIs) in a form easy for observing at a glance. The key performance indicators are incredibly relevant and capacious for wide variety of business processes, business objectives, and many other objectives and spheres of activity, among them the human resources, sales, marketing, production, etc. The human resources (HR) dashboards typically show the numbers associated with the staff recruitment, its composition and retention, thus they can reflect for example the number of free positions, the average cost or quantity of days per recruitment. This HR dashboard sample designed with powerful ConceptDraw DIAGRAM software and its drawing tools is dedicated to performance in HR and depicts the values of four main KPIs, such as the job candidates who meet job criteria, monthly internal hire rate, revenue per employee, and workforce below performance standards.

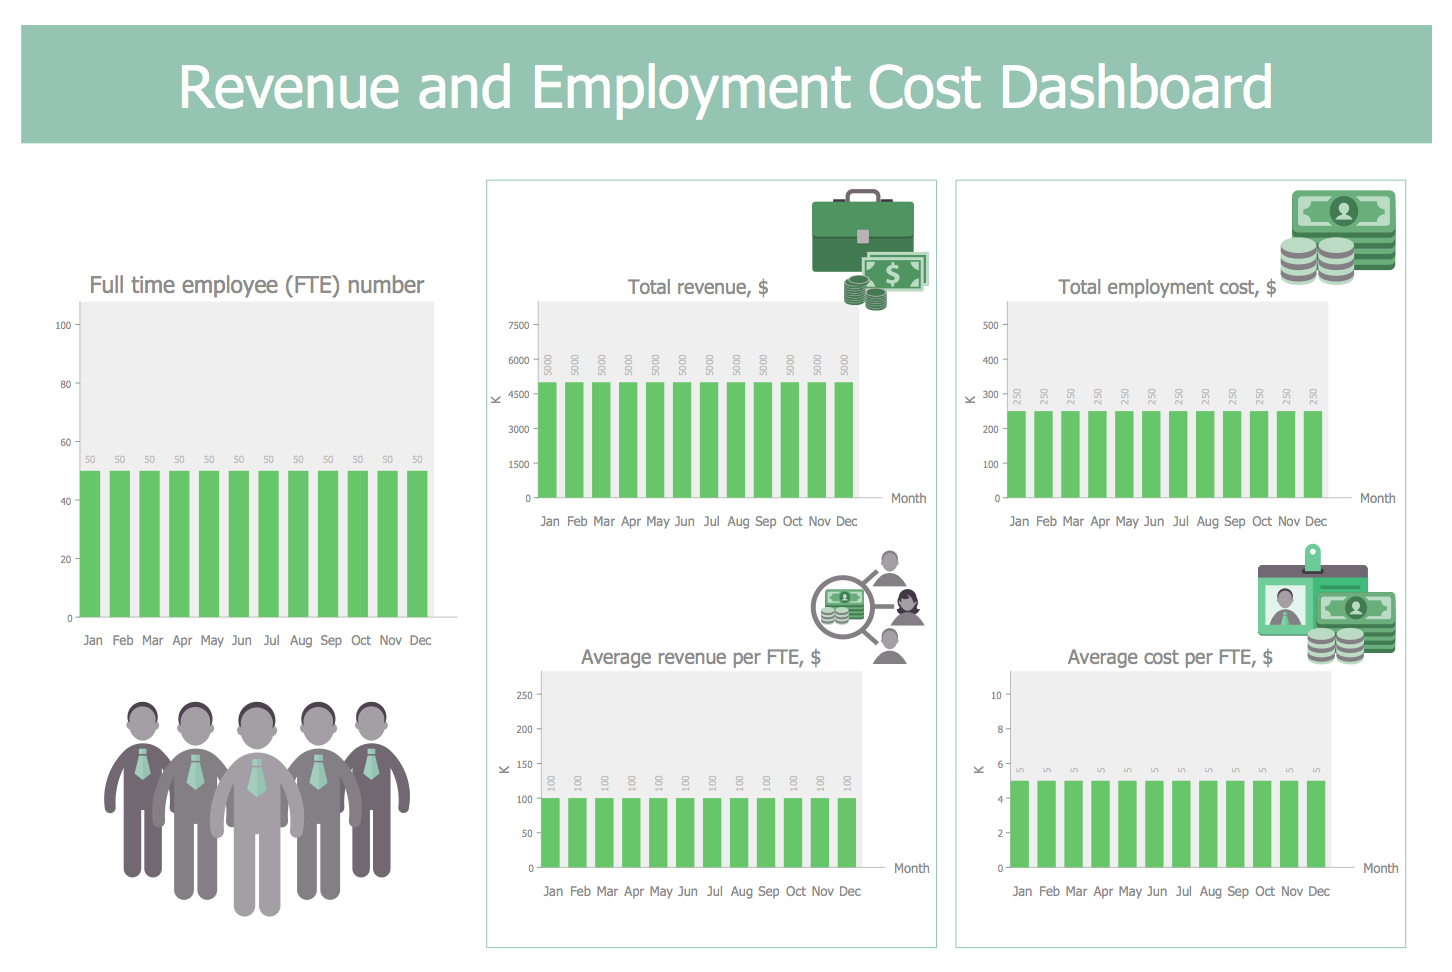
Example 4: Revenue and Employment Cost Dashboard
This diagram was created in ConceptDraw DIAGRAM using the combination of libraries from the HR Dashboard Solution. An experienced user spent 15 minutes creating this sample.
The employment is a relationship between two parties, typically the company and employee, which are based on a contract. The main goal of these bilateral relationships is a performing of work by employee for employer, for which the first receives the payment. The payment depending on the type of work and agreements, as well as other factors in accordance with specific situation can be realized in hourly format, monthly or annual, or in some situations can be chosen the piecework format of wage. This HR dashboard sample dedicated to revenue and employment cost represents in a visual manner the following KPIs: full time employee (FTE) number, total revenue, average revenue per FTE, total employment cost, and average cost per FTE, the last four in money units $. This sample is easily for observing, the graphics on this dashboard are visual and clear, that’s make the information easy for comprehension and perception.

Example 5: Training and Development Dashboard
This diagram was created in ConceptDraw DIAGRAM using the combination of libraries from the HR Dashboard Solution. An experienced user spent 10 minutes creating this sample.
This HR training and development dashboard example designed with ConceptDraw DIAGRAM drawing tools shows two thematic maps with KPIs by European countries: the training time per employee and the productivity rate growth after training. It is easy to switch between two listed pages of this HR diagram. On the first page, you can see the values of training time per employee in hours per year for nine European countries: Sweden, Germany, Netherlands, France, Spain, Switzerland, Italy, Austria, and also United Kingdom. In a second case are represented the values of productivity growth in percents for the same countries. Designed with significant help of ready vector objects of map, human capital and others, it is a good example of simple designing the different HR Dashboards with ConceptDraw DIAGRAM dashboards maker. Save your time with HR Dashboard solution, make the high quality HR Dashboards and use them to design in minutes professional-looking presentations.

Template 1: HR Dashboard
This template was created in ConceptDraw DIAGRAM using the combination of libraries from the HR Dashboard Solution. An experienced user spent 10 minutes creating this sample.
This HR dashboard template designed with ConceptDraw DIAGRAM software drawing tools and included to HR Dashboard solution, contains the Donut Chart, Histogram, and other useful graphical indicators with multi digital values. All they are the predesigned vector objects from solution's libraries, which were taken, dragged on the diagram and arranged in a chosen way. All these objects are live, take values from the attached source files and change their appearances in accordance with contents of corresponding files. To set the data source files for charts and graphic indicators use the commands from the objects' Action menus. This template is a perfect base for your own informative HR dashboards. In any moment, it can be opened from ConceptDraw Solution Store, reused, redesigned, and renewed with your own source files. In the case of updating the data at the source files, the corresponding objects on the HR Dashboard will be updated automatically.

Template 2: HR Metrics Dashboard
This template was created in ConceptDraw DIAGRAM using the combination of libraries from the HR Dashboard Solution. An experienced user spent 10 minutes creating this sample.
This professional-looking HR Metrics dashboard template for ConceptDraw DIAGRAM diagramming software consists from the single digital value indicator, the multi digital values indicators, the tab set and attractive icons. You can observe that this template includes three tabs, but if necessary, you can change this amount in a minute, like adding an additional tab or removing one of existing tabs in accordance with your needs. The addition of colorful cliparts allows to improve significantly the look of your HR dashboards and to represent them in the best view. It is valuable because the interesting and attractive diagrams, which are used in presentations and reports, are one of the components of their success. Use varied drawing tools and numerous advanced features of ConceptDraw DIAGRAM HR dashboard maker, libraries of vector objects, this template and other templates included to HR Dashboard solution to design the HR dashboards reflecting effectively and visually the situation in your company.

Template 3: HR Performance Dashboard
This template was created in ConceptDraw DIAGRAM using the combination of libraries from the HR Dashboard Solution. An experienced user spent 10 minutes creating this sample.
The Key Performance Indicators (KPIs) are quantitative indicators, well known and actively used on the enterprises of any sphere of activity. They clearly and quantitatively reflect the performance of each employee. This HR performance dashboard template for the ConceptDraw DIAGRAM software includes four arc indicators and multifarious clipart. Each arc indicator displays the name and value of a business metric as the length or angle clockwise of colored section on the arc scale and numbers. All ConceptDraw's arc indicators are specially developed live objects and change their appearance according to the attached Excel file. To set the data source files for the ConceptDraw's graphic indicators, including the arc indicators, use the object's Action menu. If the selected Excel file has more than one page, after the file selection will be opened the dialog allowing to choose the page at the Excel file. So, all that you need to design a similar HR dashboard, is to open this template and to attach the source files.

Template 4: Revenueand Employment Cost Dashboard
This template was created in ConceptDraw DIAGRAM using the combination of libraries from the HR Dashboard Solution. An experienced user spent 10 minutes creating this sample.
This Revenue and Employment Cost Dashboard template is a kind of HR Dashboards. It is a template designed for ConceptDraw Solution Park and HR Dashboard solution. There are five Column charts represented on it, which display different values and revenue quantities by months: Full time employee (FTE) number, Total revenue, Average revenue per FTE, Total employment cost, Average cost per FTE. At your desire, you can open this template at ConceptDraw DIAGRAM software and set your own values. The Column Charts are ideal way to illustrate the values of different parameters, to compare them in a visual form using the vertical bars of charts, to determine and to depict the changes of data for a particular period of time. Do not forget that visual clipart assist in making the diagrams more informative and illustrative, the libraries of HR Dashboard solution offer great number of ready-to-use clipart to help you design the best looking diagrams.
Template 5: Training and Development Dashboard
This template was created in ConceptDraw DIAGRAM using the combination of libraries from the HR Dashboard Solution. An experienced user spent 10 minutes creating this sample.
This HR dashboard template for ConceptDraw DIAGRAM software represents the Europe thematic map, the radio buttons and icons. The ConceptDraw’s Europe map object is a live object like as other thematic maps of world, all continents and Oceania included to HR Dashboard solution from the Management area of ConceptDraw Solution Park. All these live objects visualize the geospatial distribution of the levels of business metrics by continents or countries using the data from the attached Excel data source files. This and other templates included to HR Dashboard solution are the perfect base for designing own HR Dashboards, you can take any of them and create new HR diagram. Select the data source files, add extra details or information to make the most accurate and detailed diagram. All countries are marked on template, callouts depict their names and values of business metrics, with help of circles are depicted the countries’ capitals.

Inside

What I Need to Get Started
After ConceptDraw DIAGRAM is installed, the HR Dashboard solution can be purchased either from the Management area of ConceptDraw STORE itself or from our online store. Thus, you will be able to use the HR Dashboard solution straight after.

How to install
First of all, make sure that both ConceptDraw STORE and ConceptDraw DIAGRAM applications are downloaded and installed on your computer. Next, install the HR Dashboard solution from the ConceptDraw STORE to use it in the ConceptDraw DIAGRAM application.

Start using
Start using the HR Dashboard solution to make the professionally looking business planning diagrams by adding the design elements taken from the stencil libraries and editing the pre-made examples that can be found there.
