- Electric and Telecom Plans Free
- Fire and Emergency Plans Free
- Floor Plans Free
- Plant Layout Plans Free
- School and Training Plans Free
- Seating Plans Free
- Security and Access Plans Free
- Site Plans Free
- Sport Field Plans Free
- Business Process Diagrams Free
- Business Process Mapping Free
- Classic Business Process Modeling Free
- Cross-Functional Flowcharts Free
- Event-driven Process Chain Diagrams Free
- IDEF Business Process Diagrams Free
- Logistics Flow Charts Free
- Workflow Diagrams Free
- ConceptDraw Dashboard for Facebook Free
- Mind Map Exchange Free
- MindTweet Free
- Note Exchange Free
- Project Exchange Free
- Social Media Response Free
- Active Directory Diagrams Free
- AWS Architecture Diagrams Free
- Azure Architecture Free
- Cisco Network Diagrams Free
- Cisco Networking Free
- Cloud Computing Diagrams Free
- Computer Network Diagrams Free
- Google Cloud Platform Free
- Interactive Voice Response Diagrams Free
- Network Layout Floor Plans Free
- Network Security Diagrams Free
- Rack Diagrams Free
- Telecommunication Network Diagrams Free
- Vehicular Networking Free
- Wireless Networks Free
- Comparison Dashboard Free
- Composition Dashboard Free
- Correlation Dashboard Free
- Frequency Distribution Dashboard Free
- Meter Dashboard Free
- Spatial Dashboard Free
- Status Dashboard Free
- Time Series Dashboard Free
- Basic Circle-Spoke Diagrams Free
- Basic Circular Arrows Diagrams Free
- Basic Venn Diagrams Free
- Block Diagrams Free
- Concept Maps Free
- Family Tree Free
- Flowcharts Free
- Basic Area Charts Free
- Basic Bar Graphs Free
- Basic Divided Bar Diagrams Free
- Basic Histograms Free
- Basic Line Graphs Free
- Basic Picture Graphs Free
- Basic Pie Charts Free
- Basic Scatter Diagrams Free
- Aerospace and Transport Free
- Artwork Free
- Audio, Video, Media Free
- Business and Finance Free
- Computers and Communications Free
- Holiday Free
- Manufacturing and Maintenance Free
- Nature Free
- People Free
- Presentation Clipart Free
- Safety and Security Free
- Analog Electronics Free
- Audio and Video Connectors Free
- Basic Circuit Diagrams Free
- Chemical and Process Engineering Free
- Digital Electronics Free
- Electrical Engineering Free
- Electron Tube Circuits Free
- Electronic Block Diagrams Free
- Fault Tree Analysis Diagrams Free
- GHS Hazard Pictograms Free
- Home Automation and Wiring Free
- Mechanical Engineering Free
- One-line Diagrams Free
- Power Сircuits Free
- Specification and Description Language (SDL) Free
- Telecom and AV Circuits Free
- Transport Hazard Pictograms Free
- Data-driven Infographics Free
- Pictorial Infographics Free
- Spatial Infographics Free
- Typography Infographics Free
- Calendars Free
- Decision Making Free
- Enterprise Architecture Diagrams Free
- Fishbone Diagrams Free
- Organizational Charts Free
- Plan-Do-Check-Act (PDCA) Free
- Seven Management and Planning Tools Free
- SWOT and TOWS Matrix Diagrams Free
- Timeline Diagrams Free
- Australia Map Free
- Continent Maps Free
- Directional Maps Free
- Germany Map Free
- Metro Map Free
- UK Map Free
- USA Maps Free
- Customer Journey Mapping Free
- Marketing Diagrams Free
- Matrices Free
- Pyramid Diagrams Free
- Sales Dashboard Free
- Sales Flowcharts Free
- Target and Circular Diagrams Free
- Cash Flow Reports Free
- Current Activities Reports Free
- Custom Excel Report Free
- Knowledge Reports Free
- MINDMAP Reports Free
- Overview Reports Free
- PM Agile Free
- PM Dashboards Free
- PM Docs Free
- PM Easy Free
- PM Meetings Free
- PM Planning Free
- PM Presentations Free
- PM Response Free
- Resource Usage Reports Free
- Visual Reports Free
- House of Quality Free
- Quality Mind Map Free
- Total Quality Management TQM Diagrams Free
- Value Stream Mapping Free
- Astronomy Free
- Biology Free
- Chemistry Free
- Language Learning Free
- Mathematics Free
- Physics Free
- Piano Sheet Music Free
- Android User Interface Free
- Class Hierarchy Tree Free
- Data Flow Diagrams (DFD) Free
- DOM Tree Free
- Entity-Relationship Diagram (ERD) Free
- EXPRESS-G data Modeling Diagram Free
- IDEF0 Diagrams Free
- iPhone User Interface Free
- Jackson Structured Programming (JSP) Diagrams Free
- macOS User Interface Free
- Object-Role Modeling (ORM) Diagrams Free
- Rapid UML Free
- SYSML Free
- Website Wireframe Free
- Windows 10 User Interface Free
Bubble Diagrams
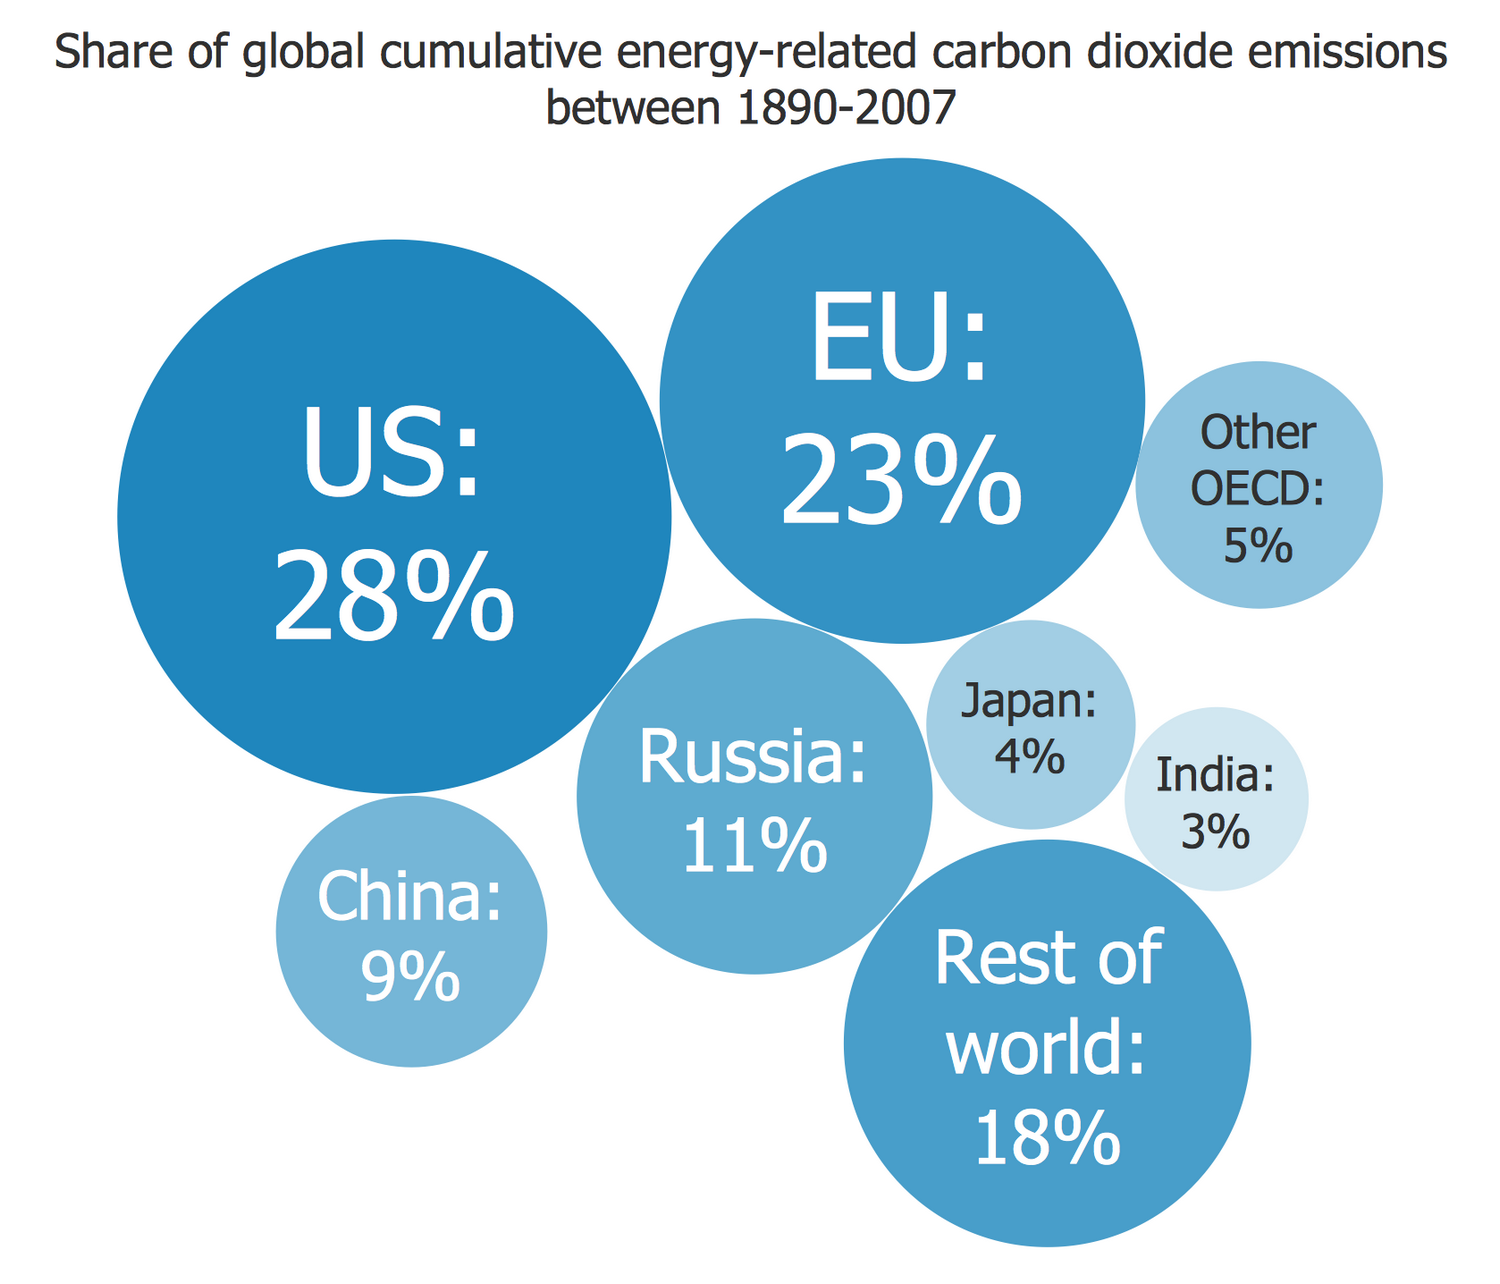
Bubble Diagrams (Bubble Charts, Spray Diagrams) are an variation of Scatter Plots and are used to visualize the data set, ideas and concepts presenting them as bubbles and organizing in a hierarchy below the central idea (often with one level below it). Each bubble on the Bubble Map is characterized by coordinates, color, and size. To show the standing of ideas bubbles of different sizes, colors, and even different color intensity are used to visually set them apart. One can vary the color palette and/or size for whole levels or for a few specific bubbles.
To compare two or more ideas and to show the common and different sub-ideas, one can construct two or more separate bubble diagrams with separated central ideas, and then link their properties and objects to see what they have in common or what makes them unique.
Bubble diagrams have enjoyed great success in software engineering, architecture, economics, medicine, landscape design, scientific and educational process, for ideas organization during brainstorming, for making business illustrations, presentations, planning, design, and strategy development. They are popular because of their simplicity and their powerful visual communication attributes.
The Bubble Diagrams Solution makes ConceptDraw DIAGRAM software a powerful bubble map maker (bubble chart maker) and contains a set of ready templates and illustrative samples, and a library with many predesigned bubble chart design elements for designing Bubble Diagrams and Spray Diagrams.
-
Buy this solution $25 -
Solution Requirements - This solution requires the following products to be installed:
ConceptDraw DIAGRAM v18 - This solution requires the following products to be installed:
-
Compatibility - Sonoma (14), Sonoma (15)
MS Windows 10, 11 - Sonoma (14), Sonoma (15)
-
Support for this Solution -
Helpdesk
There is 1 library containing 27 vector shapes in the Bubble Diagrams solution.
Design Elements — Bubble Diagrams

Examples
There are a few samples that you see on this page which were created in the ConceptDraw DIAGRAM application by using the Bubble Diagrams solution. Some of the solution's capabilities as well as the professional results which you can achieve are all demonstrated here on this page.
All source documents are vector graphic documents which are always available for modifying, reviewing and/or converting to many different formats, such as MS PowerPoint, PDF file, MS Visio, and many other graphic ones from the ConceptDraw Solution Park or ConceptDraw STORE. The Bubble Diagrams solution is available to all ConceptDraw DIAGRAM users to get installed and used while working in the ConceptDraw DIAGRAM diagramming and drawing software.
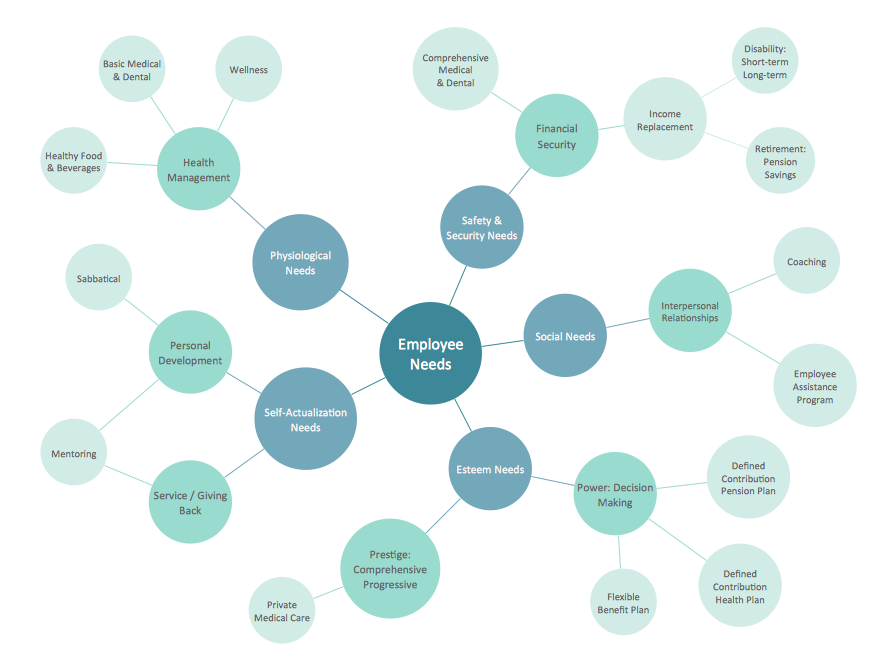
Example 1: Bubble Diagram — Employee Needs
This diagram was created in ConceptDraw DIAGRAM using the Bubble Diagrams library from the Bubble Diagram solution. An experienced user spent 15 minutes creating this sample.
This sample diagram demonstrates a potential structure of employee needs, and shows the importance of those needs by using variable bubble sizing and color. As the distance to the main idea increases, color intensity and size of the bubble are reduced.

Example 2: Bubble Diagram — Employer Objectives
This diagram was created in ConceptDraw DIAGRAM using the Bubble Diagrams library from the Bubble Diagrams solution. An experienced user spent 20 minutes creating this sample.
ConceptDraw connectors help you quickly create bubble charts, like this one showing a structured view of employer objectives. It’s useful and informative to visualize the levels using different colors, presenting data in a way that's easily understood.

Example 3: Bubble Diagram — Employment Policy Direction
This diagram was created in ConceptDraw DIAGRAM using the Bubble Diagrams library from the Bubble Diagrams solution. An experienced user spent 10 minutes creating this sample.
This diagram shows the main components of an enterprise’s employment policy. These components are organized in a wheel around the central idea. The value of each component is represented by the size of the bubble.

Example 4: Bubble Diagram — McKinsey 7S Framework
This diagram was created in ConceptDraw DIAGRAM using the Bubble Diagrams library from the Bubble Diagrams solution. An experienced user spent 5 minutes creating this sample.
A bubble diagram that visualizes the popular management model McKinsey 7S framework. This sample can be used and changed to reflect business strategy based on the 7S elements.

Example 5: Bubble Diagram — Page Rank
This diagram was created in ConceptDraw DIAGRAM using the Bubble Diagrams library from the Bubble Diagrams solution. An experienced user spent 5 minutes creating this sample.
This sample shows the Page Rank algorithm that characterizes the importance of websites. The bubble chart is a convenient tool to use in conjunction with Page Rank. One can visually compare anything based on various criteria by ordering bubbles by color, size, and proximity to the main idea.

Inside


What I Need to Get Started
After ConceptDraw DIAGRAM is installed, the Bubble Diagrams solution can be purchased either from the Diagrams area of ConceptDraw STORE itself or from our online store. Thus, you will be able to use the Bubble Diagrams solution straight after.

How to install
First of all, make sure that both ConceptDraw STORE and ConceptDraw DIAGRAM applications are downloaded and installed on your computer. Next, install the Bubble Diagrams solution from the ConceptDraw STORE to use it in the ConceptDraw DIAGRAM application.

Start using
Start using the Bubble Diagrams solution to make the professionally looking diagrams by adding the design elements taken from the stencil libraries and editing the pre-made examples that can be found there.

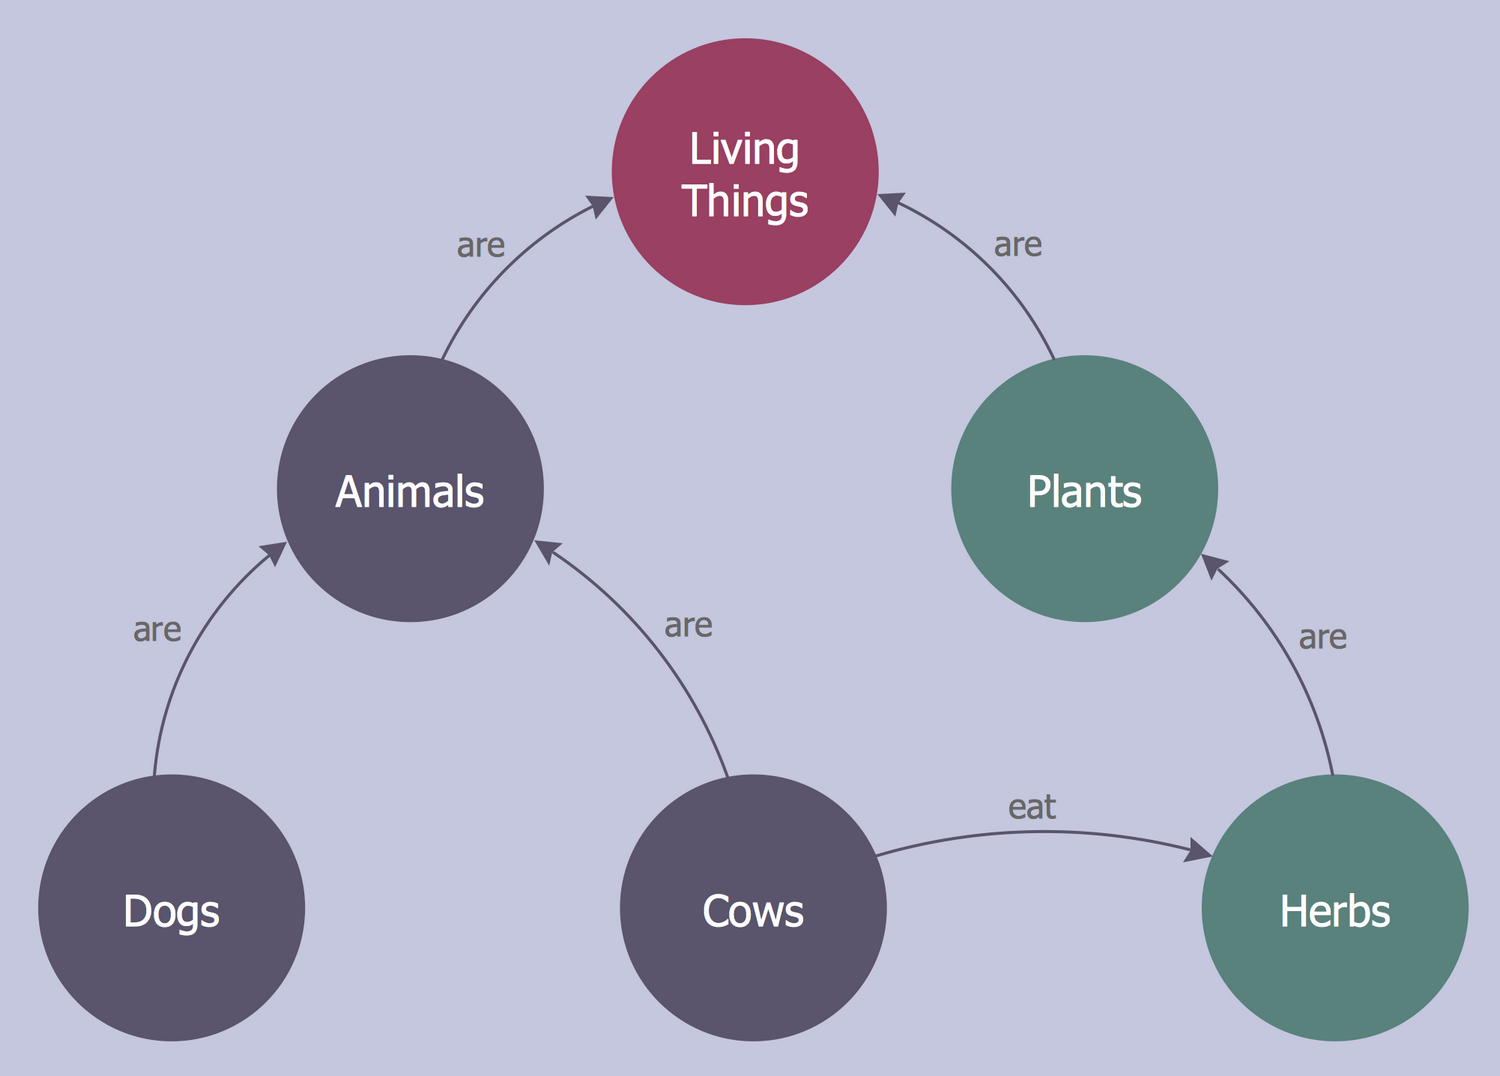
Bubble and Circle-Spoke Diagrams
Throughout all stages of product or process design, in all forms of industry, a variety of diagrams are employed in order to model processes, explore improvements and solutions, and test design limits and parameters. From these, there are a particular set of diagrams used most commonly in the early, conceptual stages of design, that all follow a similar visual arrangement — that is, a central topic radiating lines that connect to several relevant sub-topics. Each topic is represented by a shape, and the connecting lines show the relationships between them.
Some of these types of diagram, such as brainstorm diagrams, concept maps, or mind maps, can be used a collaborative tool, where people share information and ideas and commit them to page as soon as they come to mind. The upshot of this method of diagramming is that you are left with a free-form map, full of relevant data but with little in the way of structure. Bubble and circle-spoke diagrams share the brainstorm aesthetic and are similar in creation, but differ in that they offer the designer a chance to show a certain level of hierarchy within a process.
Bubble diagrams
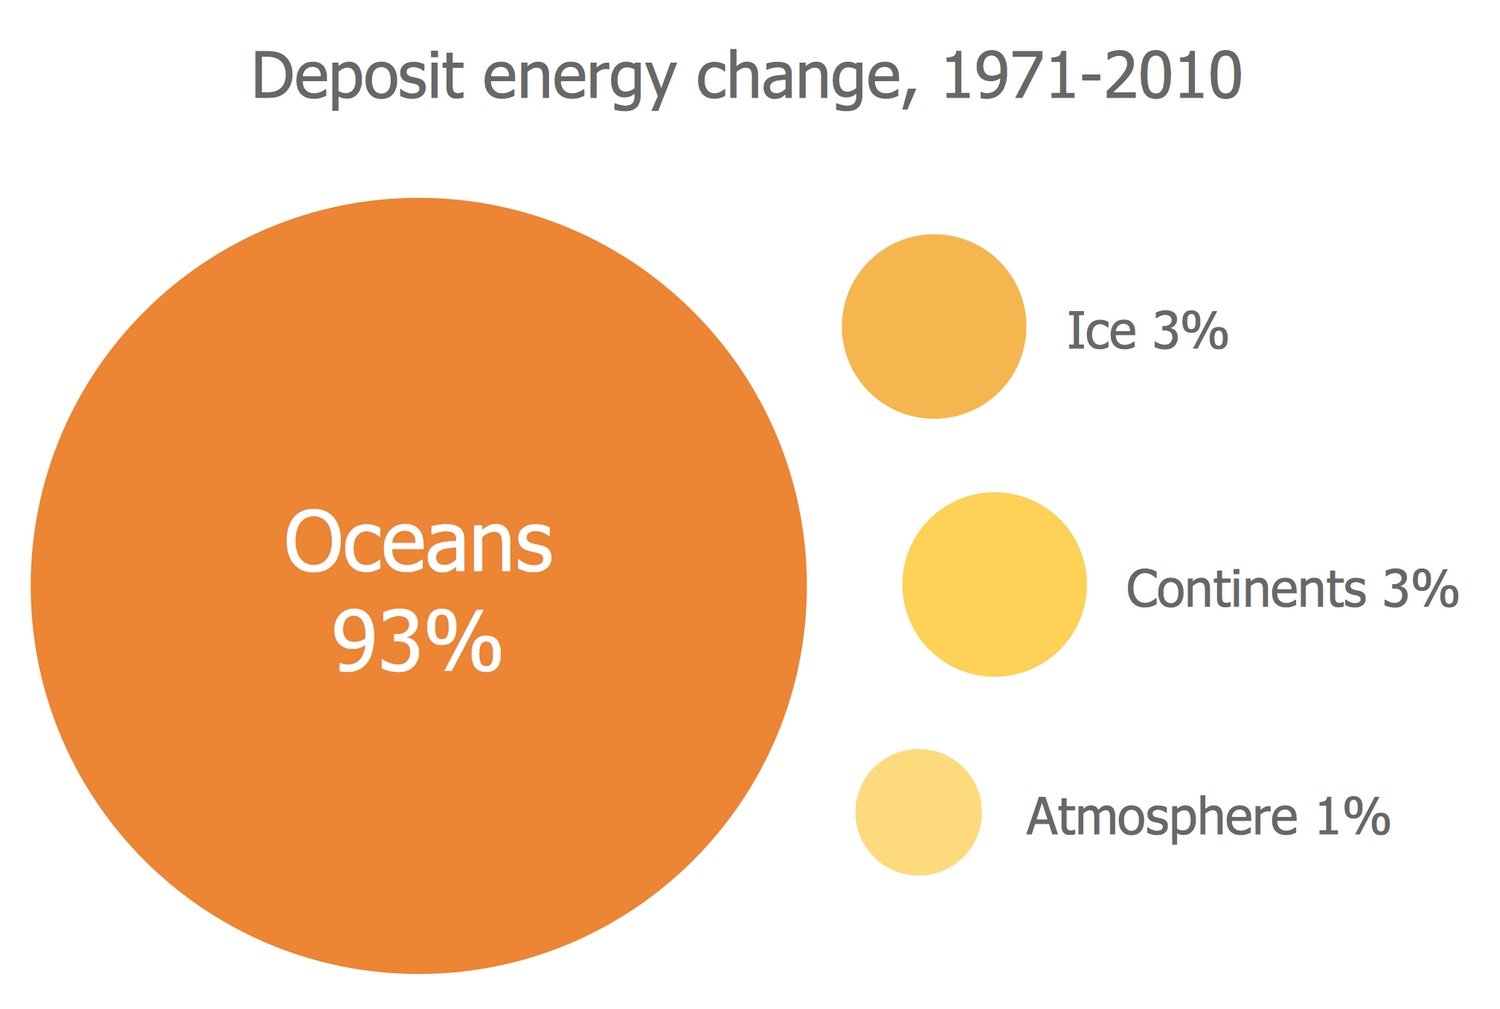
Bubble diagrams have a number of design features that set them apart slightly from diagrams mentioned previously. As the name suggests, each topic is framed on the page by a 'bubble' shape — the size of which is determined by the importance of the subject. Unlike a concept map, a bubble diagram can contain two or more central topics; position of the topic on the page initially isn't as relevant as the size of the bubble, and what other bubbles it links to.
A bubble diagram designed using ConceptDraw DIAGRAM, that can be used for HR
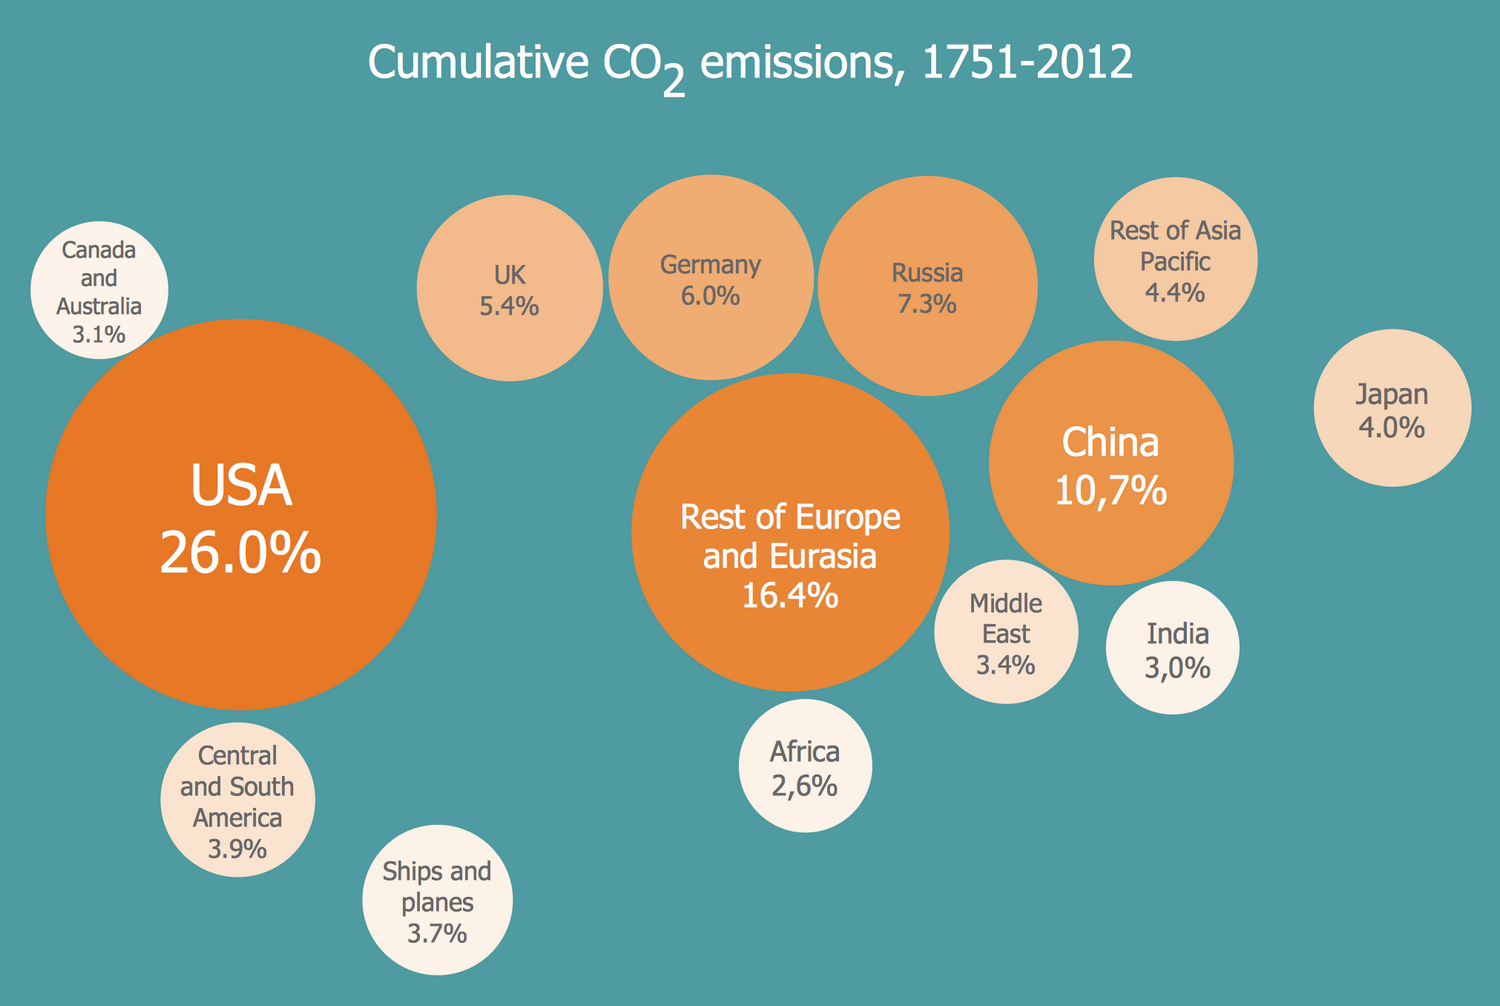
Both physical structure and abstract theory can be modeled using a bubble diagram. They are widely used throughout landscaping and architecture to give a basic visual representation of space required for functions throughout a building or developed area. For instance, an architect tasked with constructing a museum would show 'Exhibits' as their biggest bubble. A smaller bubble would be 'Toilets', which would need to be connected strategically to the exhibits and the gift shop.
Conceptually, bubble diagrams offer the chance to place greater importance on certain topics or processes, using multiple central topics to represent sales, marketing, and production divisions within one company for example.
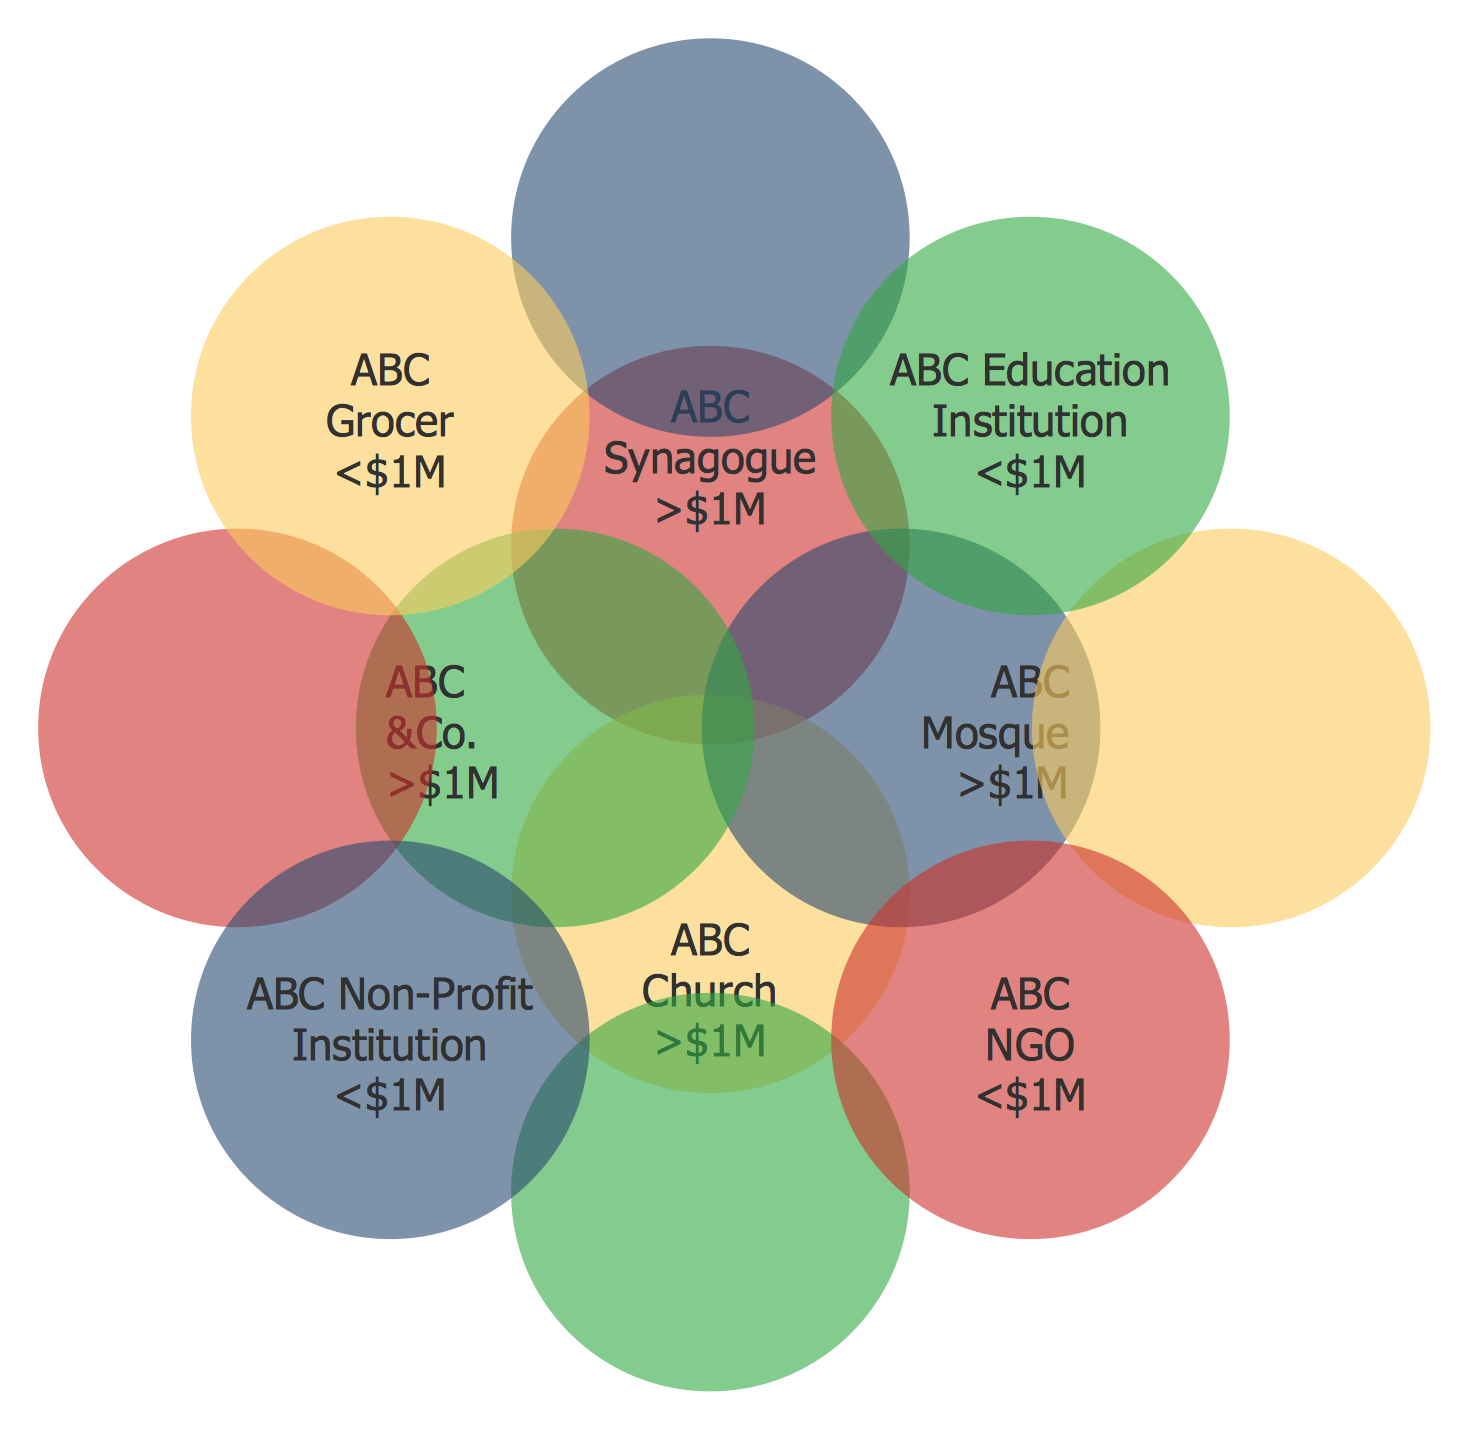
In both instance, bubble diagrams offer a 'quick-sketch' way of structuring concepts, whereby a designer can work fluidly, moving and reshaping topics as their relevance and relationship with other ideas becomes apparent. For the architect mentioned above, their diagram will eventually take the shape of a floor plan, showing the flow between bubbles/rooms. In other types of business, bubble diagrams can show where separate team strategies have a shared influence, using a more free-flowing logic to describe relationships.
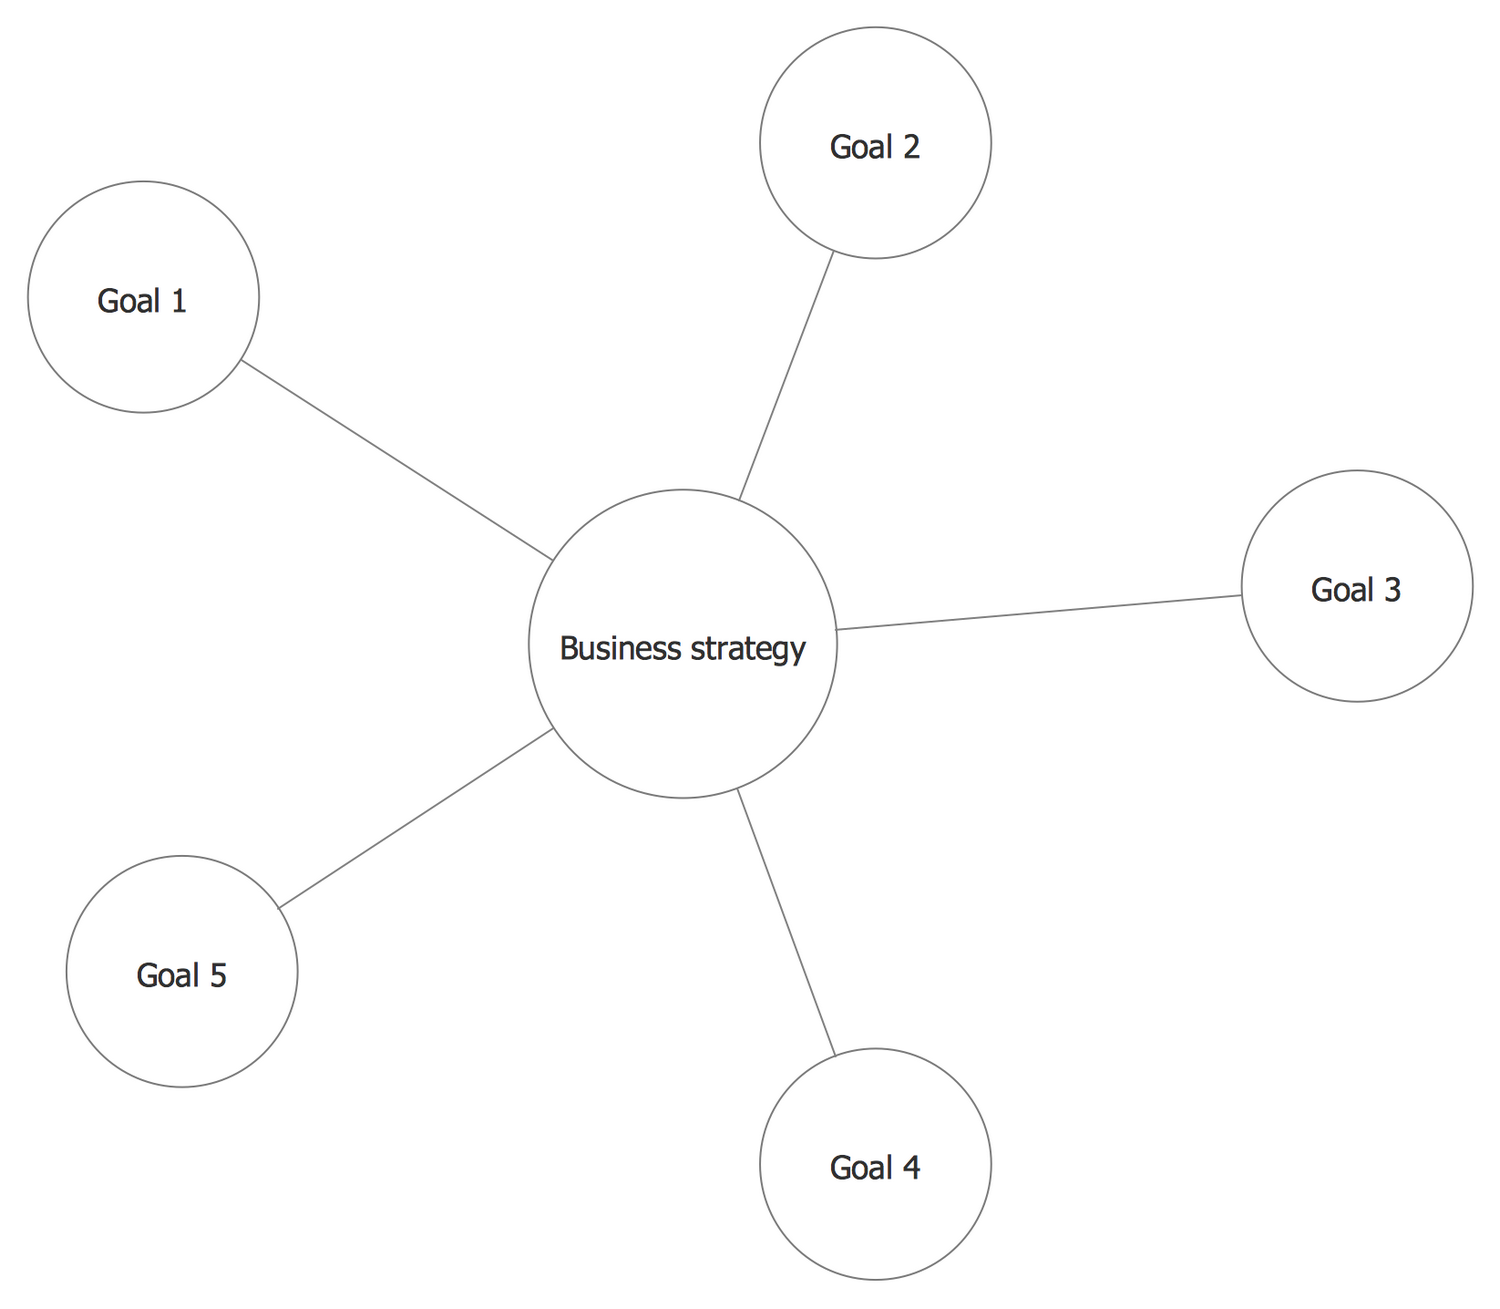
Circle-spoke diagrams
A circle-spoke diagram can be looked at as a simpler, less detailed variant of the bubble diagram. It again deals with a central topic or concept, however only factors directly associated with it are listed — the topics place in a wider process is ignored at this point. Relevant factors are arranged around the centre in a wheel pattern, joined to the main topic by 'spokes'. The circles that contain each topic are of equal size, to denote their equal standing in regards to their influence.

Exploring all possibilities of healthy living, using a circle-spoke diagram created with ConceptDraw DIAGRAM
Sometimes called circular hub diagrams, they are used in business to determine a finite number of possible factors that affect a central theme — a marketing team might use one to list areas of product promotion; TV, social media, magazines and so on. A key design feature is that no judgement is made as to the strength of a particular factor, that the spokes are set out at equal distance. A good example for clarity would be a diagram with a schoolteacher as the central circle subject, and each of their pupils is represented by a spoke.
From concept to ConceptDraw
Since creating their powerful diagramming software, ConceptDraw DIAGRAM, CS Odessa have remained committed to extending its usability and functionality with a series of solutions designed for workers and students from many diverse fields of industry. The tools provided in Solution Park help everyone from software engineers to sales analysts; school teachers to scientists. ConceptDraw DIAGRAM can be used across a business, to detail software systems, describe telecommunications, create business results dashboards, or depict management and sales processes.
With the Bubble Diagrams and Circle-Spoke Diagrams solutions for ConceptDraw DIAGRAM, you are given all the design elements needed to create bright, engaging diagrams that can be used effectively as learning materials, as part of a presentation, or simply as a method of visual thinking. Each solution comes complete with a library containing all the design elements needed to create a diagram of each type, and each solution page offers a series of samples to show the capabilities of the software. As always with ConceptDraw solutions, there is a wealth of learning material (FAQs and videos) to help any novice designer.
Used in conjunction with other solutions from CS Odessa, you can start to add bubble or circle-spoke diagrams to infographics, PowerPoint presentations, or as part of an educational resource. This unique cross functionality, both in terms of solutions and file export options, is what makes ConceptDraw DIAGRAM such a versatile diagramming tool — workers from all vocations can find a solution that will make their life easier.