- Electric and Telecom Plans Free
- Fire and Emergency Plans Free
- Floor Plans Free
- Plant Layout Plans Free
- School and Training Plans Free
- Seating Plans Free
- Security and Access Plans Free
- Site Plans Free
- Sport Field Plans Free
- Business Process Diagrams Free
- Business Process Mapping Free
- Classic Business Process Modeling Free
- Cross-Functional Flowcharts Free
- Event-driven Process Chain Diagrams Free
- IDEF Business Process Diagrams Free
- Logistics Flow Charts Free
- Workflow Diagrams Free
- ConceptDraw Dashboard for Facebook Free
- Mind Map Exchange Free
- MindTweet Free
- Note Exchange Free
- Project Exchange Free
- Social Media Response Free
- Active Directory Diagrams Free
- AWS Architecture Diagrams Free
- Azure Architecture Free
- Cisco Network Diagrams Free
- Cisco Networking Free
- Cloud Computing Diagrams Free
- Computer Network Diagrams Free
- Google Cloud Platform Free
- Interactive Voice Response Diagrams Free
- Network Layout Floor Plans Free
- Network Security Diagrams Free
- Rack Diagrams Free
- Telecommunication Network Diagrams Free
- Vehicular Networking Free
- Wireless Networks Free
- Comparison Dashboard Free
- Composition Dashboard Free
- Correlation Dashboard Free
- Frequency Distribution Dashboard Free
- Meter Dashboard Free
- Spatial Dashboard Free
- Status Dashboard Free
- Time Series Dashboard Free
- Basic Circle-Spoke Diagrams Free
- Basic Circular Arrows Diagrams Free
- Basic Venn Diagrams Free
- Block Diagrams Free
- Concept Maps Free
- Family Tree Free
- Flowcharts Free
- Basic Area Charts Free
- Basic Bar Graphs Free
- Basic Divided Bar Diagrams Free
- Basic Histograms Free
- Basic Line Graphs Free
- Basic Picture Graphs Free
- Basic Pie Charts Free
- Basic Scatter Diagrams Free
- Aerospace and Transport Free
- Artwork Free
- Audio, Video, Media Free
- Business and Finance Free
- Computers and Communications Free
- Holiday Free
- Manufacturing and Maintenance Free
- Nature Free
- People Free
- Presentation Clipart Free
- Safety and Security Free
- Analog Electronics Free
- Audio and Video Connectors Free
- Basic Circuit Diagrams Free
- Chemical and Process Engineering Free
- Digital Electronics Free
- Electrical Engineering Free
- Electron Tube Circuits Free
- Electronic Block Diagrams Free
- Fault Tree Analysis Diagrams Free
- GHS Hazard Pictograms Free
- Home Automation and Wiring Free
- Mechanical Engineering Free
- One-line Diagrams Free
- Power Сircuits Free
- Specification and Description Language (SDL) Free
- Telecom and AV Circuits Free
- Transport Hazard Pictograms Free
- Data-driven Infographics Free
- Pictorial Infographics Free
- Spatial Infographics Free
- Typography Infographics Free
- Calendars Free
- Decision Making Free
- Enterprise Architecture Diagrams Free
- Fishbone Diagrams Free
- Organizational Charts Free
- Plan-Do-Check-Act (PDCA) Free
- Seven Management and Planning Tools Free
- SWOT and TOWS Matrix Diagrams Free
- Timeline Diagrams Free
- Australia Map Free
- Continent Maps Free
- Directional Maps Free
- Germany Map Free
- Metro Map Free
- UK Map Free
- USA Maps Free
- Customer Journey Mapping Free
- Marketing Diagrams Free
- Matrices Free
- Pyramid Diagrams Free
- Sales Dashboard Free
- Sales Flowcharts Free
- Target and Circular Diagrams Free
- Cash Flow Reports Free
- Current Activities Reports Free
- Custom Excel Report Free
- Knowledge Reports Free
- MINDMAP Reports Free
- Overview Reports Free
- PM Agile Free
- PM Dashboards Free
- PM Docs Free
- PM Easy Free
- PM Meetings Free
- PM Planning Free
- PM Presentations Free
- PM Response Free
- Resource Usage Reports Free
- Visual Reports Free
- House of Quality Free
- Quality Mind Map Free
- Total Quality Management TQM Diagrams Free
- Value Stream Mapping Free
- Astronomy Free
- Biology Free
- Chemistry Free
- Language Learning Free
- Mathematics Free
- Physics Free
- Piano Sheet Music Free
- Android User Interface Free
- Class Hierarchy Tree Free
- Data Flow Diagrams (DFD) Free
- DOM Tree Free
- Entity-Relationship Diagram (ERD) Free
- EXPRESS-G data Modeling Diagram Free
- IDEF0 Diagrams Free
- iPhone User Interface Free
- Jackson Structured Programming (JSP) Diagrams Free
- macOS User Interface Free
- Object-Role Modeling (ORM) Diagrams Free
- Rapid UML Free
- SYSML Free
- Website Wireframe Free
- Windows 10 User Interface Free
Data Flow Diagrams (DFD)
DFD is known to be an abbreviation for a “Data Flow Diagram”. Being a graphical representation of the data flow through an information system, any DFD can be used to model the process aspects of such a system. Being often used as a preliminary step for creating an overview of the system without going into too many details, Data Flow Diagrams may be also used for visualizing some kind of data processing within the study of structured design.
A Data Flow Diagram can also be used to display what information can be entered and output from the system. It may represent the way some data can advance through the system, including the description of the place where such data can be stored. Without showing any information about process timing, Data Flow Diagrams are also known to be called the “Bubble charts”.
DFD is a design tool that used in a top-down approach to System Design, which is known to be next "exploded" to create DFD level 1 showing some details of the system that is modeled. By identifying the internal data stores that must be present for the system to do its job properly, and also showing the data flow between different parts of the system, Data Flow Diagrams are one of the well-known significant prospects for structured-systems analysis and design methods called “SSADM”.
Having a Data Flow Diagram, users are able to visualize how a system can work, what it can do, and how it can be implemented. Data Flow Diagrams can also be used to provide end users with some physical idea of whether their data affects the structure of the system as a whole. Thus, in order to describe the way some system is being developed, anyone can do it through a data flow diagram model that can be created in the ConceptDraw DIAGRAM diagramming and drawing software.
The use of Data Flow Diagrams (DFD) solution as an extension to the ConceptDraw DIAGRAM tool can simplify its users' work by creating any necessary Data Flow Diagram, which can help simulate multiple data flows as well as illustrate the functional requirements of the system or business process. Using the pre-made templates and samples of the DFDs, and the stencil libraries full of DFD-related design elements, any ConceptDraw DIAGRAM user might find the Data Flow Diagrams (DFD) solution a useful tool for making the needed DFD drawings.
-
Install this solution Free -
What I need to get started -
Solution Requirements - This solution requires the following products to be installed:
ConceptDraw DIAGRAM v18 - This solution requires the following products to be installed:
-
Compatibility - Sonoma (14), Sonoma (15)
MS Windows 10, 11 - Sonoma (14), Sonoma (15)
-
Support for this Solution -
Helpdesk
This solution contains 7 samples and 3 libraries containing 49 vector graphics and icons, to allow you to create professional looking documents.
Design Elements — Data Flow Diagrams

Design Elements — Yourdon and Coad Notation

Design Elements — Gane-Sarson Notation

Examples
There are a few samples that you see on this page which were created in the ConceptDraw DIAGRAM application by using the Data Flow Diagrams (DFD) solution. Some of the solution's capabilities as well as the professional results which you can achieve are all demonstrated here on this page.
All source documents are vector graphic documents which are always available for modifying, reviewing and/or converting to many different formats, such as MS PowerPoint, PDF file, MS Visio, and many other graphic ones from the ConceptDraw Solution Park or ConceptDraw STORE. The Data Flow Diagrams (DFD) solution is available to all ConceptDraw DIAGRAM users to get installed and used while working in the ConceptDraw DIAGRAM diagramming and drawing software.
Example 1: DFD — Model of Small Traditional Production Enterprise
This diagram was created in ConceptDraw DIAGRAM using the Data Flow Diagrams library from the Data Flow Diagrams solution. An experienced user spent 10 minutes creating this sample.
This Data Flow Diagram example shows a production process in a traditional small enterprise. DFD diagrams are useful for visualizing a system and decomposing it into smaller parts. They allow one to depict what the system is going to perform, to represent the data flow through the system, as well as the interactions between external objects and the system. In this diagram, you can observe two external interactors: Consumer and Provider, which are represented in rectangles according to the Yourdon and Coad notation and are the sources and receivers of system data. The processes are presented as ovals in DFD diagrams, they display a set of logically related operations performed in the system, and their main purpose is to convert input streams to output in accordance with the indicated actions. Data flows are indicated by arrows with the indicated headers. You can also find data storage in this diagram from which data is taken and where it is entered.

Example 2: DFD — Process of Account Receivable
This diagram was created in ConceptDraw DIAGRAM using the Yourdon and Coad Notation library from the Data Flow Diagrams Solution. An experienced user spent 10 minutes creating this sample.
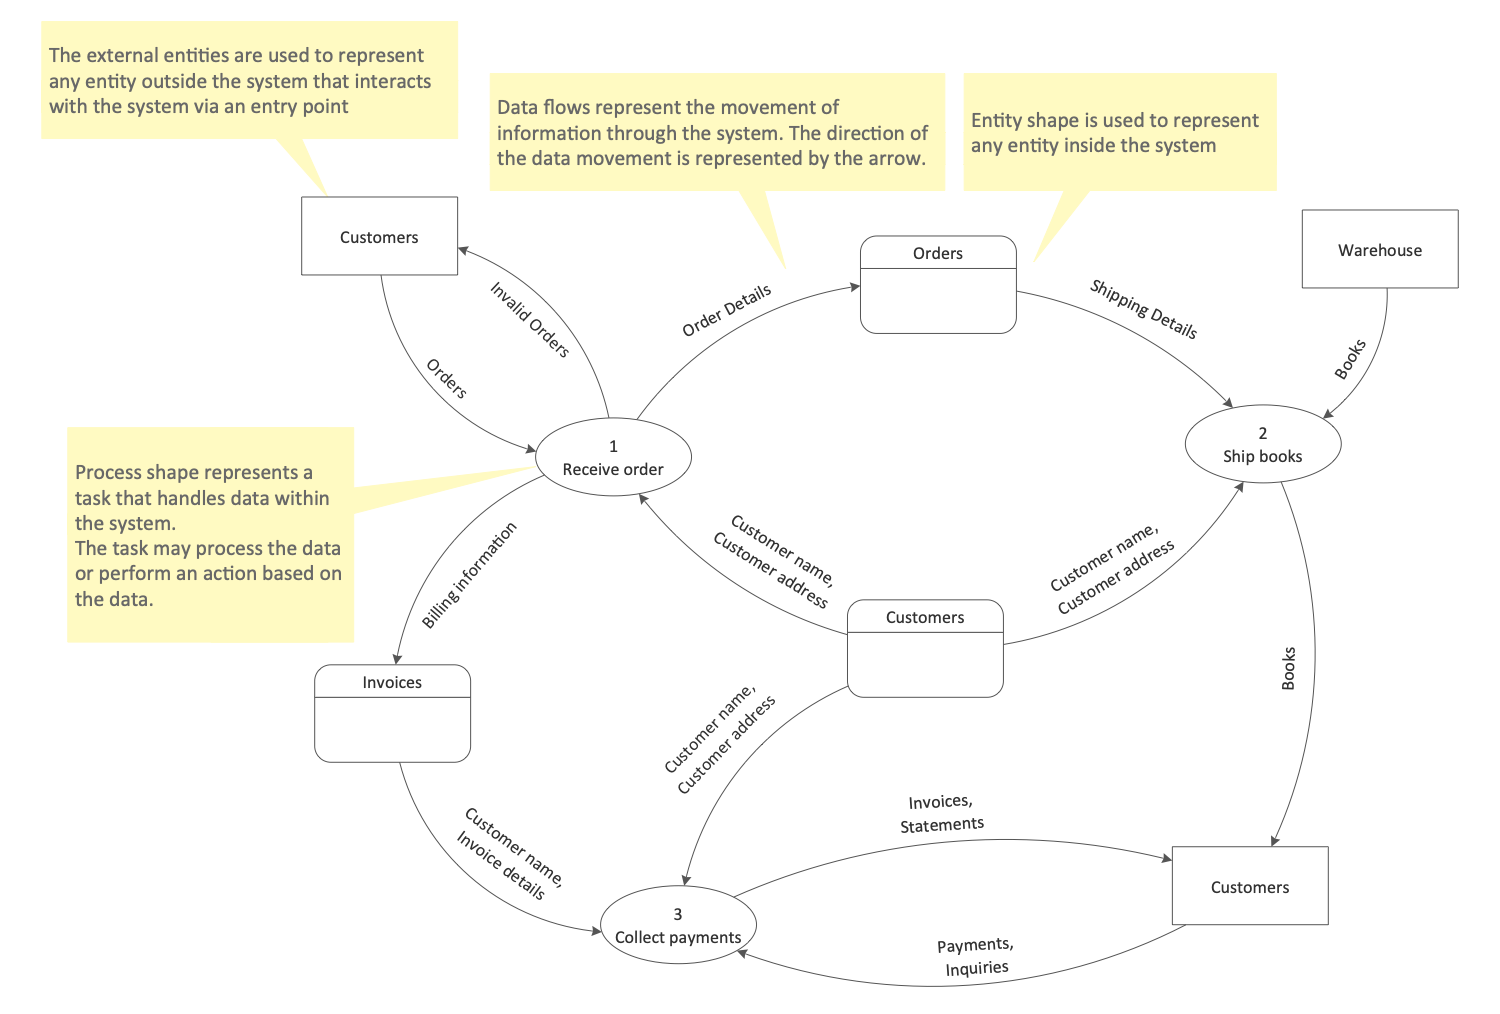
This example shows a Data Flow Diagram that describes the process in the account receivable department. This diagram is executed with Yourdon and Coad notation and lets one observe how the ordering process is realized step-by-step. One can note that the process includes a lot of steps, among which there are making the order by the customer, an invoice creation, its verification and payment, assembling requisition to a warehouse, shipment the order to the customer, and some intermediate steps. The DFDs are useful as on the stage of system's design as its analysis, so it is the best tool for the designers and analysts. These diagrams provide a unique ability to visualize in a simple way how the system is going to work, what it is going to perform, and how it will be implemented. And the standardized Yourdon and Coad notation icons let you quickly draw professional-looking Data Flow Diagrams for your business documents, presentations, and websites.

Example 3: Data Flow Diagram (DFD)
This diagram was created in ConceptDraw DIAGRAM using the Gane-Sarson Notation library from the Data Flow Diagrams solution. An experienced user spent 10 minutes creating this sample.
This DFD sample demonstrates an electronic system behind a customer’s purchase and is one from the solution’s collection of data flow diagram examples. The data flow during the process of payment for goods in the shop is represented. The purchase is realized with the use of MaxiCode scanner that reads and interprets the UPS barcodes. DFDs let one simplify and accelerate understanding, analysis, and representation of processes. This diagram was constructed using the Gane and Sarson notation. You may notice that the items that the buyer wishes to purchase first pass through the scanner, the UPS barcode is read, and the descriptions and prices of the items come from the UPS price file. The next step is to calculate the total cost or, in other words, the amount payable. In this case, goods, prices and subtotals are stored in a Temporary TransFile. When paying for items, money is withdrawn from the client in cash, by check or by debit card, and the cash register issues a receipt.
")
Example 4: DFD — CERES
This diagram was created in ConceptDraw DIAGRAM using the Data Flow Diagrams library from the Data Flow Diagrams solution. An experienced user spent 20 minutes creating this sample.
This sample shows a Clouds and the Earth's Radiant Energy System (CERES) Data Flow Diagram and was based on the illustration on the NASA website. The scientific satellites CERES are NASA climatological experiments from Earth orbit and the part of the Earth Observing System (EOS). They were designed to measure the solar-reflected and Earth-emitted radiation from the atmosphere to the Earth's surface. The results from the CERES and other NASA instruments give the ability to study the energy exchange between the Sun, the Earth's surface, atmosphere, clouds, and outer space, to analyze the climate changes and the role of clouds in a global climate change, and to improve the climate prediction models. The first CERES instrument was launched in November 1997 from Japan, the next six CERES instruments were launched in 1999. The design presented is large and complex, but it took just a few minutes to create it in ConceptDraw DIAGRAM using pre-designed objects. Use the legend to make additional comments and clarify the diagram.

Example 5: DFD — Coad/Yourdon Object Oriented Analysis model
This diagram was created in ConceptDraw DIAGRAM using the Yourdon and Coad Notation library from the Data Flow Diagrams solution. An experienced user spent 20 minutes creating this sample.
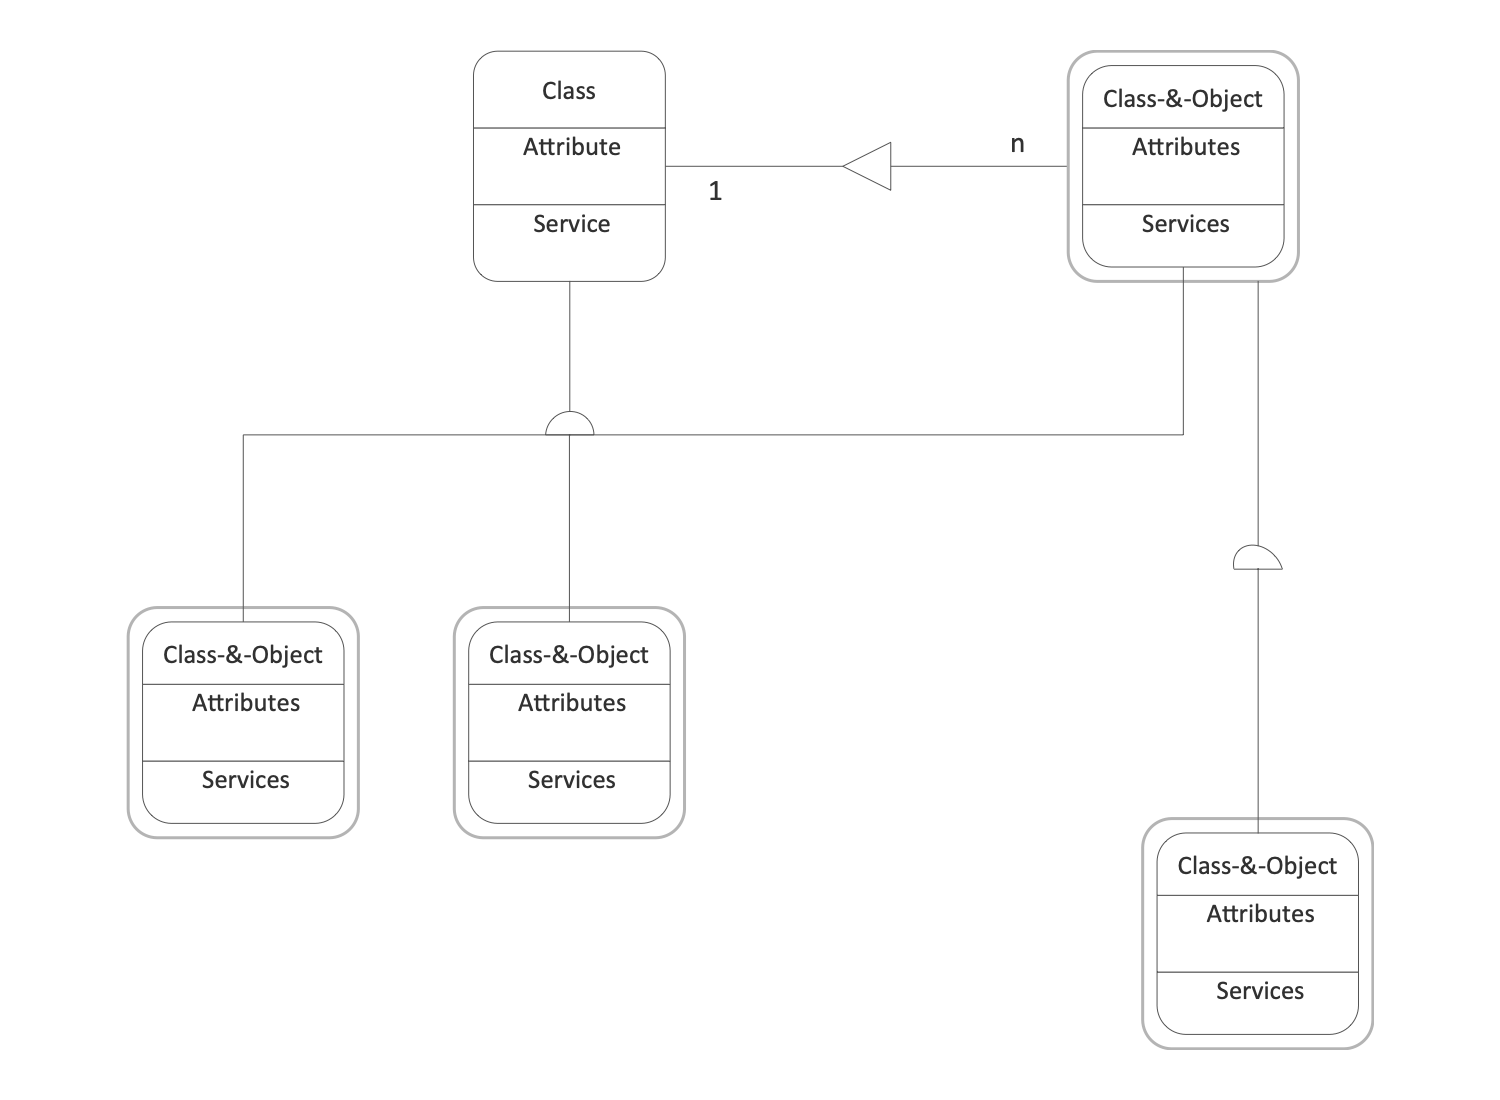
This example visualizes the Yourdon and Coad methodology that is popular and widely used in object-oriented analysis (OOA). The construction of the object-oriented analysis model begins with the creation of a diagram demonstrating the system as a whole and its relations with external entities through data streams. This sample is dedicated to the organization of a heating system and was designed on the basis of the illustration for the article "A Survey of Object-Oriented Methods" by Peter Biggs from the University of Durham. The generalization of classes is typically observed and classes are connected by the relations of certain kinds. One can denote two kinds of relationships in this diagram: inheritance and composition, marked by special symbols and titles 'as is' and 'has'. Draw your own Yourdon and Coad Data Flow Diagrams of any complexity quickly and easily in ConceptDraw DIAGRAM data flow diagram software using the vector objects developed according to the common DFD notations.

Example 6: DFD — Last Resort Hotel Book Room Process
This diagram was created in ConceptDraw DIAGRAM using the combination of libraries from the Data Flow Diagrams solution. An experienced user spent 10 minutes creating this sample.
This Data Flow Diagram example represents a process of booking a room in a hotel. It was constructed based on the Wikipedia file “LastResortHotel BookRoom Process.png”. To book a room the guest makes a booking request and receives a booking confirmation, the external reservation system is involved in this process. The schedule is used and the current time is considered. There is also a link to the bank, the payment validation request is directed to the bank where it is processed and the payment validation is issued by the bank. The information on the rooms is stored at the Rooms data store, the data according to the bookings and guests is entered correspondingly to the Bookings and Guests data stores. The concept of event partitioning is often applied to the modeled complex systems to divide them into the set of smaller sub-systems and make their analysis and organization of requirements easier.

Example 7: DFD — Interaction between IDMA and Preprocessor
This diagram was created in ConceptDraw DIAGRAM using the combination of libraries from the Data Flow Diagrams solution. An experienced user spent 10 minutes creating this sample.
This DFD example depicts the interactions between IDMA and Pre-processor. It was constructed on the basis of the illustration from the website of the Office of Hydrologic Development of the NWS (National Weather Service) of the NOAA (National Oceanic and Atmospheric Administration), under the title "Interactive Double Mass Analysis. User's Guide". The Double mass analysis is a technique applied to analyze and determine corrections to hydrological and meteorological data collected in a number of locations taking into consideration the local conditions. The diagram shows that the preprocessor software generates the data file containing the accumulated point time series. Along with the pre-processor input card file, this data is used by the IDMA tool, which also performs the consistency checks and calculates the correction factors that are returned to the preprocessor with a goal of re-estimation of missing data, performing corrections and the mean areal computations that are then entered to the mean areal time series data file.

More Examples and Templates
Inside
-solution-macOS.png "Data Flow Diagrams (DFD) Solution for macOS")
-solution-Windows.png "Data Flow Diagrams (DFD) Solution for Microsoft Windows")
What I Need to Get Started
Both ConceptDraw DIAGRAM diagramming and drawing software and the Data Flow Diagrams (DFD) solution can help creating the software engineering diagrams you need. The Data Flow Diagrams (DFD) solution can be found in the Software Development area of ConceptDraw STORE application that can be downloaded from this site. Make sure that both ConceptDraw DIAGRAM and ConceptDraw STORE applications are installed on your computer before you get started.
How to install
After ConceptDraw STORE and ConceptDraw DIAGRAM are downloaded and installed, you can install the Data Flow Diagrams (DFD) solution from the ConceptDraw STORE.
-solution-Install.png "Data Flow Diagrams (DFD) Solution - Install")
Start Using
To make sure that you are doing it all right, use the pre-designed symbols from the stencil libraries from the solution to make your drawings look smart and professional. Also, the pre-made examples from this solution can be used as drafts so your own drawings can be based on them. Using the samples, you can always change their structures, colors and data.
-solution-Start-Using.png "Data Flow Diagrams (DFD) Solution - Start Using")
Data Flow Diagrams
When studying a business process or system that involves the transfer of data, it is common to use a data flow diagram (DFD) to visualize how that data is processed. While initially used exclusively in regards to the flow of data through a computer system, DFDs are now employed as a business modelling tool, describing business events and interactions, or physical systems involving data storage and transfer.
A DFD is a 2D diagram that appears something like a free-form flowchart. They can be divided into two broad categories — physical or logical data flow diagrams. They are not exclusive of each other; an interpretation of each can be placed over the same process, revealing different aspects of the data flow. The differences are, that a physical DFD shows how a system will be implemented, or how it currently operates — it includes the people involved, files, hardware, storage centres and other real-world elements. On the other hand, a logical DFD describes the necessity of certain operations and activities in order for data to be transferred from point A to point B.
A physical data flow diagram, using the Yourdon/Coad notation, made with ConceptDraw DIAGRAM
DFDs are used by system analysts to create an overview of a business, to study and evaluate all its inputs and outputs, and to place each element within context along the data flow chain. Once an overall picture is achieved, each step can then be 'exploded' into a more detailed diagram of individual processes. The ideal scenario is first to create a visual representation of the current logical data flow — from here unnecessary processes can be dropped, and new features, inputs, outputs, activities and stored data can be added. This creates a new proposed logical data flow. With this new system, a new physical DFD can be devised, that takes into account all the proposed changes.
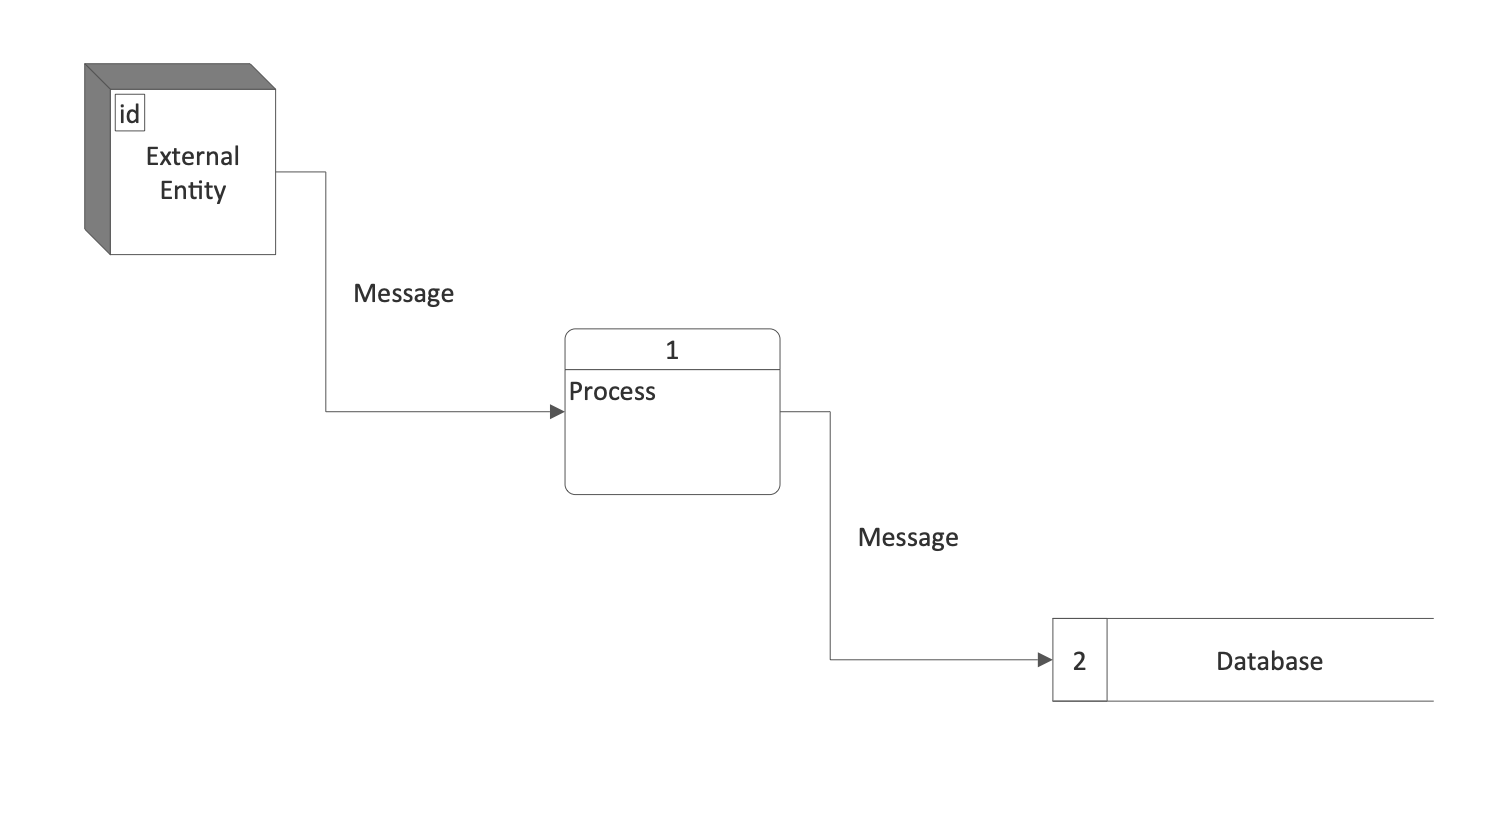
To ensure a measure of understanding when sharing diagrams with others, DFDs use a standardized notation system — it has been somewhat adapted for different needs over the years, but generally a DFD will use one of the two most prominent versions. Perhaps simplest of all is the Gane/Sarson notation, that uses three symbols and arrowed connectors to describe external entities, process and data stores, and the flow of data between them.
A logical DFD, with Gane/Sarson notation, made using ConceptDRaw PRO
More in depth is the Yourdon/Coad notation (slightly adapted from DeMarco's version), with extra icons to describe multiple processes, process loops, conditions, and perhaps most importantly, different data states and object classes.
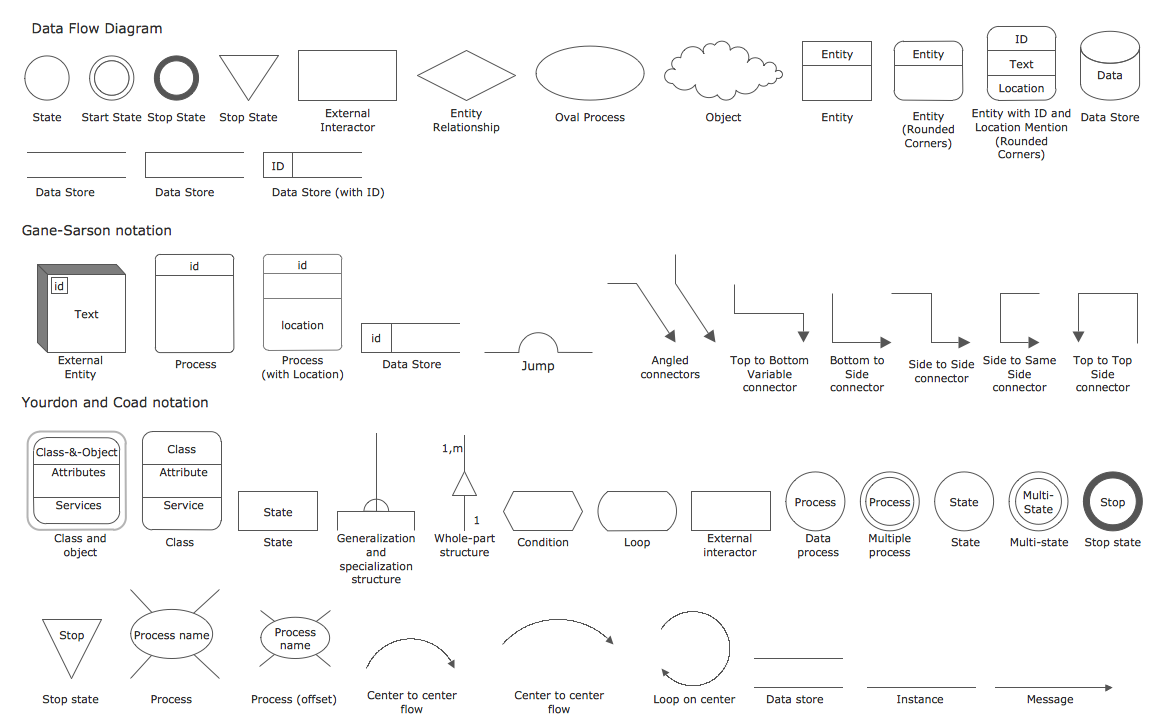
Standardized icon notation found in the Data Flow Diagram solution
To produce professional and standardized data flow diagrams, most analysts will turn to a specialist drawing software, that can automate certain processes and cater for presentation and file sharing needs. ConceptDraw DIAGRAM, extended with the Data Flow Diagram solution, is ideal for this scenario. Within the solution is a comprehensive vector stencil library, offering the full range of icons from both notation sets mentioned above. Features inherent to ConceptDraw DIAGRAM make the diagramming process simple and efficient — one click commands allow users to select and place icons, intuitively place connector arrows, and share their document in a range of presentation modes or file types.
An added bonus is the wealth of learning material available, particularly in relation to data flow and process diagrams, and a number of other solutions that support similar topics. FAQs, how-to guides, and video tutorials can all be found on the ConceptDraw website.
Adding the Data Flow Diagram solution to ConceptDraw DIAGRAM gives you a powerful tool to help analyze and devise data flows for any business process or system.