What is DFD Diagram?DFD Diagram Creator
The most important business task is to track business efficiency and progress and improve productivity. This includes the identification of inefficiencies and detecting processes and areas that should be improved. The task becomes more complex for enterprises with multiple parts or departments. Data Flow Diagram (DFD) is one of the most efficient and simple tools to cope with this task. It looks like a simple overview of a complex system, which clarifies its structure and functionality.
DFD is a great part of process modeling. It helps businesses, enterprises, and other organizations to understand systems, organize, analyze, optimize, and improve processes. DFD illustrates the flow of information, how the business system operates and how data is stored, processed, and transformed by a system. It helps to show processes and subprocesses, actions, inputs, and outputs of each entity and simplifies communication between technical and non-technical staff involved in a project.
What is a DFD Diagram?
A Data Flow Diagram (DFD) is a visual graphical representation of data flow through a process or a system at various levels. DFD illustrates incoming data flow, outgoing data flow, and stored data, emphasizes processes, shows how inputs are processed in a system and transformed into outputs, and helps to analyze information.
DFDs are used to model the flow of information, describe and analyze an existing system, or plan and implement a new system. Visualization helps to identify potential bottlenecks, points of exposure, misconfigurations, potential vulnerabilities, and inefficiencies in data processing at early stages, and make changes as needed to improve processes and the entire system.
Data Flow Diagrams are used in different areas, they are useful at the stage of design and analysis of an information system. Data Flow Diagram for software engineering helps to develop and document software systems including banking software systems. They are applied to communicate the design of the system with different stakeholders and streamline workflows in complex systems.
Nowadays DFDs are usually created using the specialized diagram software and are used to depict the business requirements of applications and bring success when applied to manage data movement across cloud service providers, track data flow between cloud platforms, and control security across disparate cloud infrastructures. They help to implement security measures, secure data handling, identify and analyze data pathways, and optimize processes.
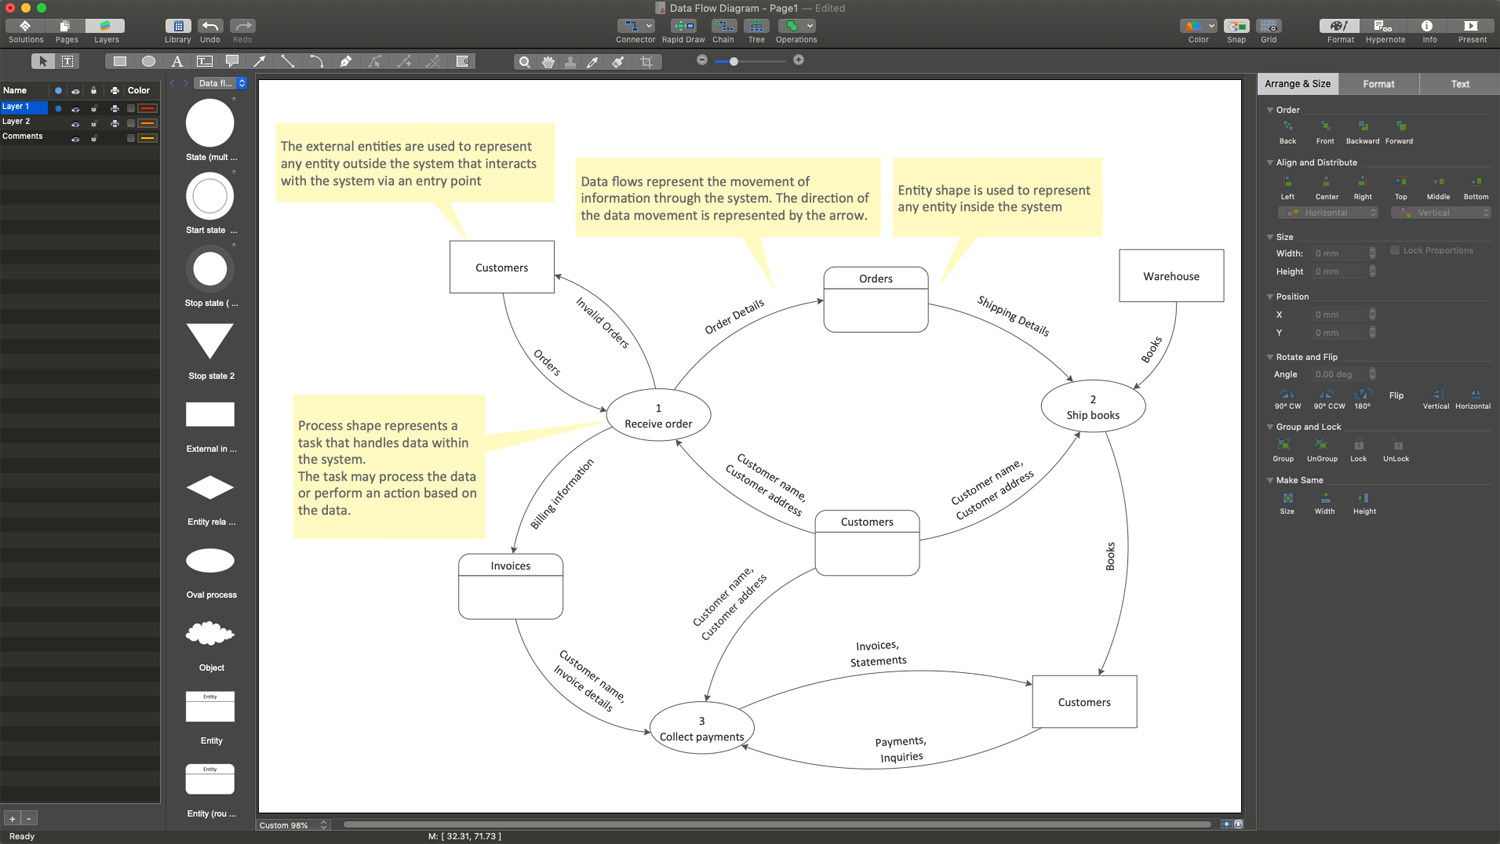
Example 1. DFD Diagram Creator
Types of DFDs
One distinguishes between logical and physical Data Flow Diagrams, which are two different perspectives on the same data flow. Being used together, they are a way to visualize completely the current state of the system and help to model the new state to be considered and implemented to improve the system.
- Logical DFD focuses on the business and business activities, system process, transmitted information, and ensuring smooth running of the system. It gives an overview of the business activities, illustrates entities receiving the information, shows how data is moved from one entity to another. A logical Data Flow Diagram includes databases and physical entities, describes the business events and the data required for them, and is a basis for the physical DFD.
- Physical DFD shows how a system is implemented and provides technical aspects of how the data flows and is stored. It specifies the files, hardware, software, and people involved in an information flow, and describes the work of the data system.
DFD Notations
Two main DFD diagram notations with a fundamental difference in the visual representation of process nodes are used for Data Flow Diagrams:
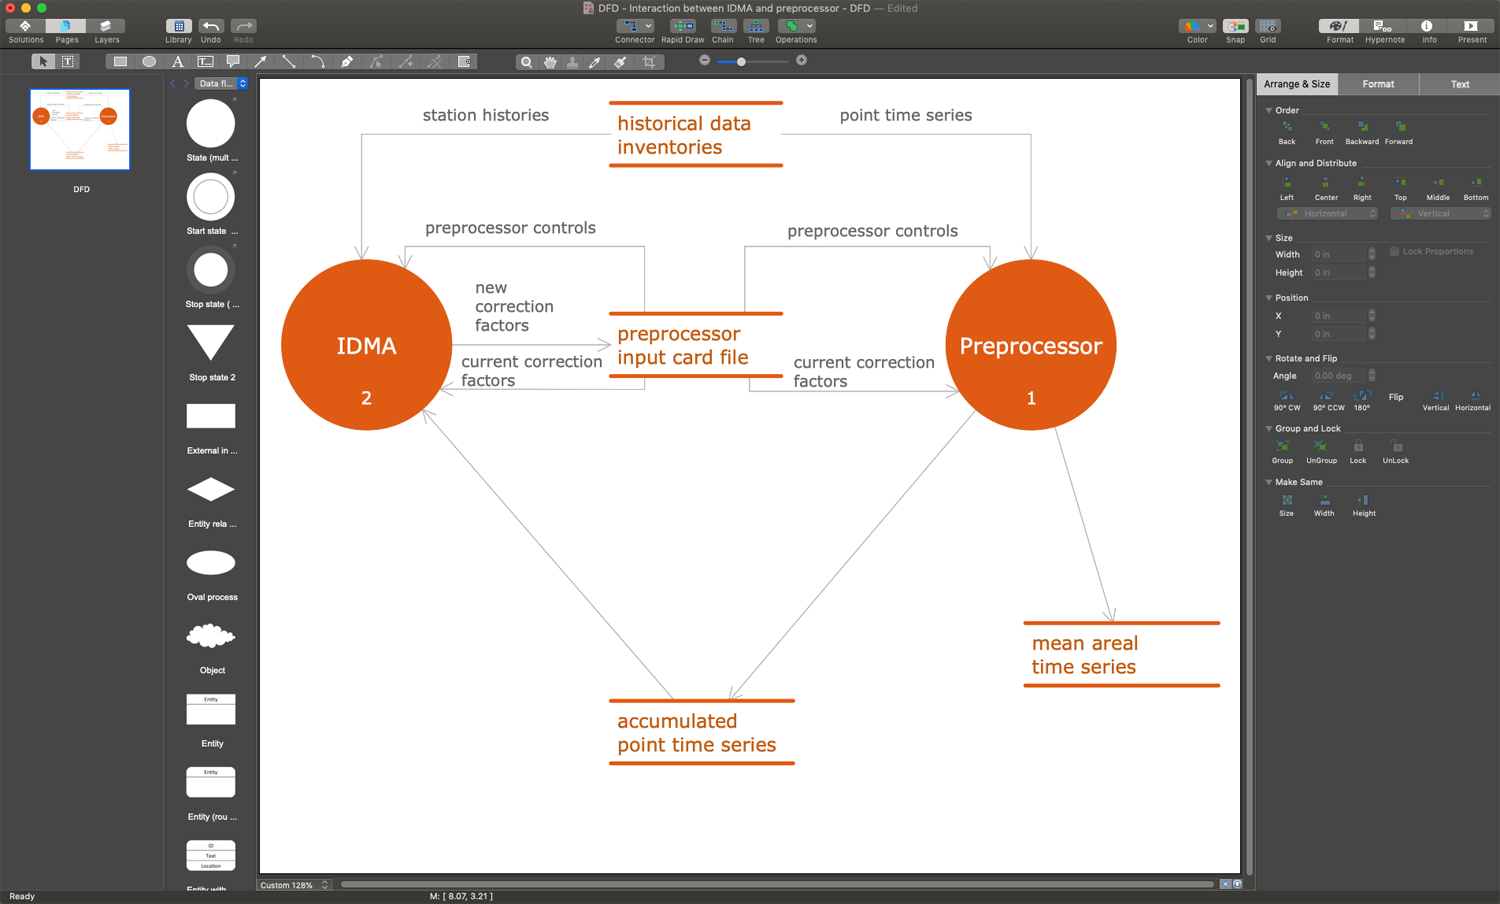
- Yourdon & Coad DFD notation is typically used in real-time system analysis and design and uses circles with names to show process nodes.
- Gane & Sarson DFD notation is usually used for information systems and uses rounded rectangles with names for process nodes.
Components and Symbols of DFDs
Data Flow Diagrams are created using standardized symbols and components corresponding to chosen notation to describe entities and their relationships. The main DFD diagram components are:
External entities are sources, actors, terminators, sinks, or destinations. These include objects outside the system, with which it communicates: other systems, users, or organizations. They input data or information to the system or output it, and are usually represented in DFD by rectangles with the corresponding names.
Data flow specifies the movement of data or information from one part of the system to another, from source to destination, between external entities, processes, and data stores using lines with text labels and arrows showing the direction of flow.
Processes depict data transformations from one form to another implemented through actions, activities, or functions for some specific business reason and represented as circles in the DFD.
Data stores are repositories of data in the system, they specify a location of a system database, where data is stored and managed, and are represented by two horizontal parallel lines in the DFD.

Example 2. Data Flow Diagram — Process of Account Receivable
Benefits of Data Flow Diagrams
Developing and using Data Flow Diagrams at different stages of system design has many benefits:
Simple in construction.
Suit to document processes in almost all areas and types of systems.
Simple and easy-to-recognize DFD diagram notations provide a precise and clear representation of the data flow within a system or process.
Provide a detailed representation of the system showing all levels and structures, components and boundaries, external entities, processes, and data stores within the system.
Easy-to-read overview of the process simplifies communication with all stakeholders.
Provide an understanding of the logic and concept behind the system.
Quick and easy identification of functionality for both technical and non-technical audiences.
Represent information essential to the specific system architecture.
Simplify the identification of potential bottlenecks, problems in the flow of data, weak points, and redundant steps to reduce the number of systematic errors.
Assist in the improvement of system architecture and optimization of processes.
How to Create a DFD Diagram?
To create a Data Flow Diagram, follow the simple steps:
| # | Steps |
|---|---|
| 1. | Identify the process or system being represented |
| 2. | Select the level of representing the process — physical or logical | 3. | Identify key entities and processes connecting them |
| 4. | Show the external entities — inputs and outputs, sources and destinations of data in the system or process |
| 5. | Determine locations of data stores to the DFD, data transformations, and processes for them |
| 6. | Show the data flow between the entities connecting the symbols with arrows |
| 7. | Use colors to differentiate various types of data and processes |
Also note that:
each process and each data store should have at least one input and one output;
each data store must go through at least one process;
each process in a data flow diagram should link to another process or data store.
ConceptDraw DFD Diagram Creator Overview
It is incredibly useful to draw DFD diagram with specialized drawing software — DFD Diagram Creator ConceptDraw DIAGRAM. Professional tools and user-friendly interface of ConceptDraw DIAGRAM software and Data Flow Diagrams (DFD) solution help to save your time and effort. The included libraries with ready vector stencils and templates give you entire assistance in quick design.
Simply drag the corresponding symbols for entities, processes, data flows, and other DFD diagram components from the libraries of diagram builder ConceptDraw DIAGRAM to your document, arrange and connect them to show the direction of the data flow, add text, colors, and other details. You can also start with one of the ready templates. It's so easy that you don't need any prior special experience to create professionally looking Data Flow Diagram with explanation or without it.
Once your diagram is ready, export or exchange it with colleagues and other stakeholders. It is also recommended to keep your DFDs simple and easy to understand.

Example 3. Data Flow Diagram Template
DFD Diagram Examples
Data Flow Diagrams (DFD) solution for flowchart software ConceptDraw DIAGRAM provides a wide collection of professionally looking samples and examples of DFD Diagrams. They are useful for exploring all the benefits and advantages of using Data Flow Diagrams in different areas and are a perfect base to develop your own DFD diagrams, illustrate, and improve business and security processes.
Conclusion
The Data Flow Diagram tool is incredibly useful for understanding data flow within a system, identifying potential bottlenecks and inefficiencies, communicating with stakeholders, and improving processes. It uses specialized notations and components to show graphically the flow of data and its processing within the system.
Despite varying in complexity, Data Flow Diagrams are easily designed in ConceptDraw DIAGRAM DFD diagram creator. Develop quick and easily data flow diagram level 0 and level 1, as well as level 2. Show and study the architecture of any system, balance the level of detail with the overall purpose of your DFD diagram, and succeed in process analysis.