Made with
ConceptDraw
DIAGRAM 18

DFD Flowchart Symbols

A Data Flow Diagram (DFD) is a graphical technique which allows effectively model and analyze the information processes and systems. DFD visualizes the flow of data and neatly represents the information processing in a process depending on the inputs and outputs, lets illustrate and analyze the work of a whole system and also its individual parts. DFDs display where the data are stored, from where they are come and where they go to. Often the DFD is created as a detailed plan for the further creation of a system.

DFDs are ideal tool for modeling processes, describing business events, interactions and functional requirements, for demonstration and explaining the course and passage of information in a process, and also for structured design and displaying physical systems involving data storage and transfer.

There are two types of Data Flow Diagrams:

  • physical DFDs - which describe how a system works or will be work when implemented, and include involved people, files, hardware, storage centers and other elements;
  • logical DFDs - which display the necessity of certain operations and activities for transferring the data from point A to point B.

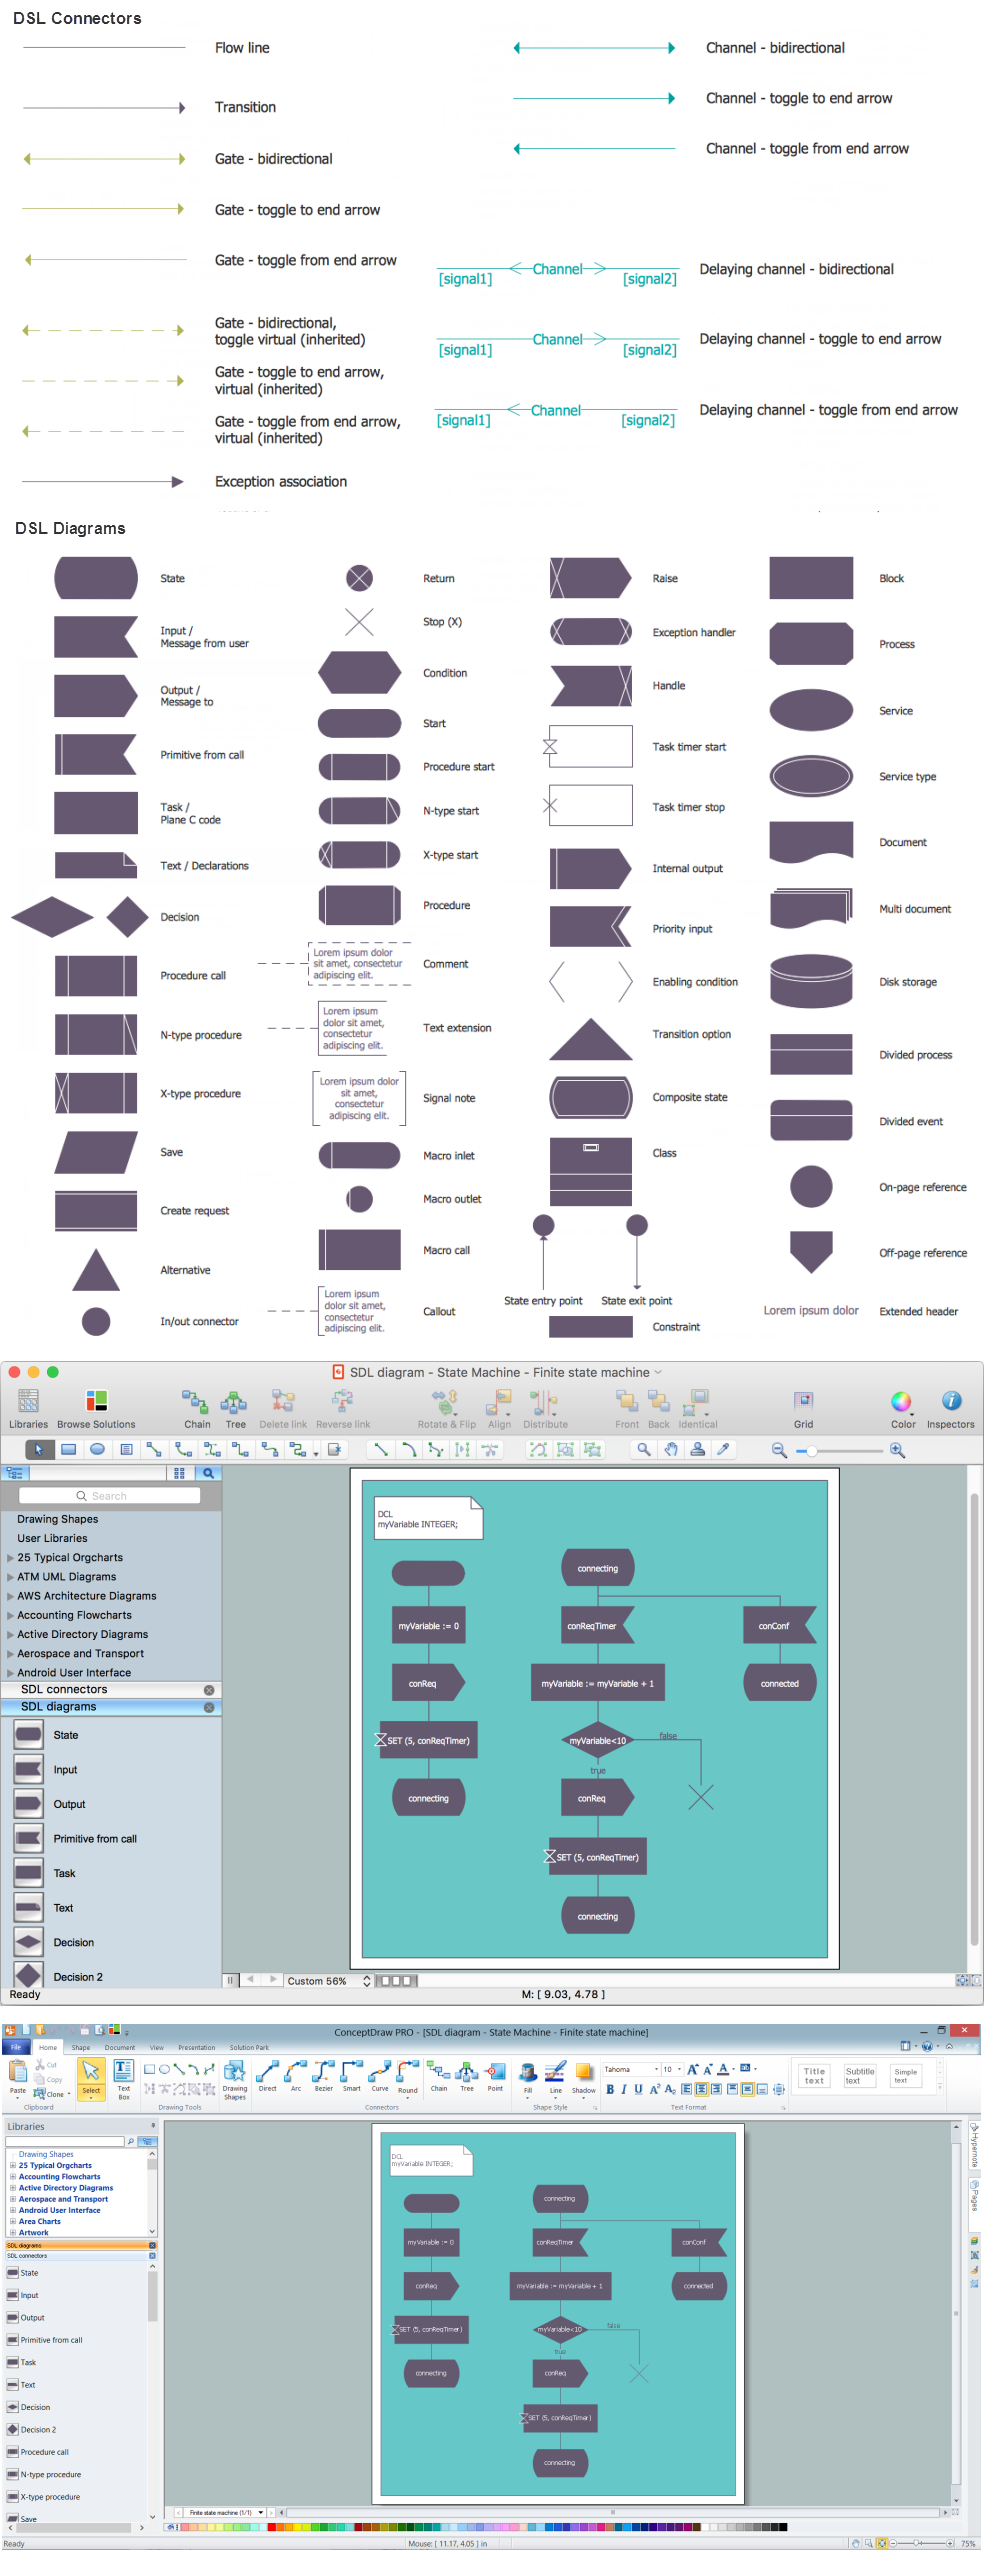
The ability to fast and easy create the DFDs is made possible with Data Flow Diagrams solution from the Software Development area of ConceptDraw Solution Park. For designing the Data Flow Diagrams are used simple DFD flowchart symbols which are connected each other by arrows depicting the data flow from one step to another.

The set of all commonly used symbols for DFDs is comprehensible for all analysts and users thanks to the standardized notation systems: Gane/Sarson and Yourdon/Coad notations.

When designing the DFDs, use the following major objects:

  • Process object - represents a task which processes the data within application or performs actions on their base.
  • Multiple Process object - represents the set of sub-processes.
  • Data Flow object - represents the data movement within the application, the arrows depict direction of this movement.
  • Data Store object - represents where the data are stored.
  • External Entity object - represents the entity outside the application which interacts with this application via entry point.
DFD Flowchart Symbols *

Example 1. DFD Flowchart Symbols

All these and many other DFD flowchart symbols are offered by 3 libraries of the Data Flow Diagrams solution and allow easy analyze and devise the data flows for any business process or a system:

  • Data Flow Diagrams library contains 15 symbols for DFDs;
  • Gane-Sarson Notation library contains 12 symbols of Gane-Sarson DFD notation;
  • Yourdon and Coad Notation library 22 symbols of Yourdon-Code DFD notation.

Data Flow Diagram Library Design Elements

Example 2. Data Flow Diagram Library Design Elements

The ConceptDraw DIAGRAM makes the DFDs diagramming process easy and efficient. To design any Data Flow Diagram in a few clicks, follow the next simple steps:

  • drag-and-drop desired icons from the libraries to your document and type the text;

    Adding objects to DFD and typing text

    Example 3. Adding objects to DFD and typing text

  • connect the objects with ConceptDraw connector tools from the Home toolbar or place connector arrows from the libraries to display the data flow;

    Adding connectors to DFD

    Example 4. Adding connectors to DFD

  • resize and format the objects, add background color according to your taste.

    Data-Flow-Diagram

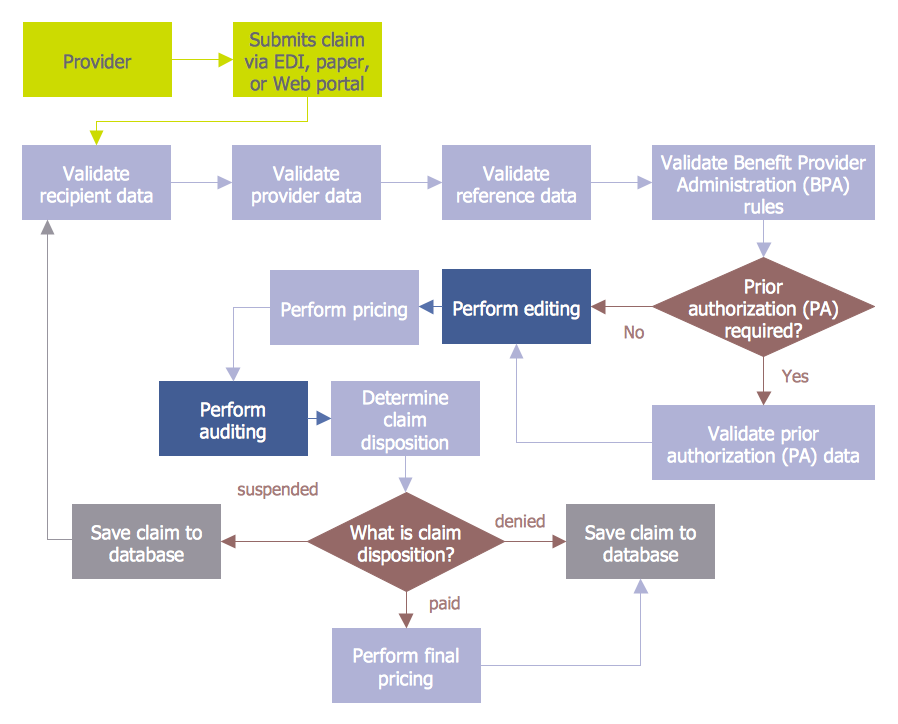
    Example 5. Data Flow Diagram

The Data Flow Diagrams solution includes also the set of predesigned templates which make easier drawing process of Data Flow Diagrams.

Data Flow Diagram Template

Example 6. Data Flow Diagram Template

All templates and also collection of DFD samples are available from ConceptDraw STORE and can be used and changed according to your needs.

Data Flow Diagrams Solution

Example 7. Data Flow Diagrams Solution

The Data Flow Diagrams is a powerful professional tool for effective modeling the data flows, designing the data-oriented and process-oriented models, creating a lot of various types of diagrams of any complexity - Data Flow diagrams, Data Process diagrams, Data Flowcharts, Structured Analysis diagrams, Information Flow diagrams, and others.

Any Data Flow Diagram designed in ConceptDraw DIAGRAM can be then easy printed to share with colleagues, exported to various formats, including PPT, PDF, MS Visio, HTML, and many other graphic formats.


TEN RELATED HOW TO's:
Process mapping helps with sharing business results and reorganizing workflow. In almost every case, after creating a sales process flowchart the steps that are redundant become obvious for a manager. It's easy to find a flowchart examples that will help in developing one for your business. This sales process flowchart consists of a sequence of steps that represent a simple sale process. Each step is shown graphically by a rectangle representing processing steps or an activity, or a diamond representing a decision. These rectangles are linked by arrows, that indicate the direction of the sales workflow. ConceptDraw Sales Flowcharts solution delivers a the full set of classical flowchart notation symbols, along with sales-related icons and pictograms.Sales Process Flowchart
Picture:
Sales Process Flowchart
Flowchart Examples
Related Solutions:
New Smart connectors in ConceptDraw DIAGRAM now have an auto-routing feature. This means that connectors always find the optimal route between objects and automatically recalculate that path when moving these objects. You don't have to think about your connectors, they think for you.ConceptDraw Arrows10 Technology *
Picture: ConceptDraw Arrows10 Technology
Video tutorials on ConceptDraw products. Try it today!Presenting Documents with Remote Presentation for Skype Solution *
Picture: Presenting Documents with Remote Presentation for Skype Solution
Related Solutions:
ConceptDraw DIAGRAM is a chemistry drawing software that is ideal for designing of various: chemistry drawings, scientific and educational chemistry illustrations, schemes and diagrams of chemical and biological lab set-ups, images with chemical formulasChemistry Drawings
Picture: Chemistry Drawings
Related Solution:
Data modeling is actively applied in analysis and uses wide set of methods for description the data requirements in a system. One of the most popular and well-known is the ERD method of database modeling. The best ERD tool for the Mac and Windows is ConceptDraw DIAGRAM software extended with the Entity-Relationship Diagram (ERD) solution from the Software Development Area for ConceptDraw Solution Park, which is sharpened for professional ERD drawing and data modeling with Entity Relationship Diagram.Data Modeling with Entity Relationship Diagram *
Picture: Data Modeling with Entity Relationship Diagram
Related Solution:
You need design the Functional Block Diagram and dream to find the useful tools to draw it easier, quickly and effectively? ConceptDraw DIAGRAM offers the Block Diagrams Solution from the Diagrams Area which will help you!Functional Block Diagram *
Picture: Functional Block Diagram
Related Solution:
As restaurant industry is growing rapidly nowadays, researches show that almost half of the adults have worked in a restaurant or a cafe. Moreover, many of them dream to start their own someday. Unfortunately, it takes a lot of time to write a business plan and to find a great location, although some know how to create a restaurant floor plan in minutes or how to plan budget effortlessly. Hiring employees can also cause a lot of headache, but this is crucial for further success, because every guest comes to restaurant for a good service and delicious food. It is also worth noting that restaurant concept is also important, because it defines target audience and influences the menu. This diagram represents the floor plan of an ongoing sports-theme establishment - restaurant, cafe, or other food service. A number of widescreen monitors installed along the perimeter provide visitors the opportunity to follow the course of a match from anywhere in the dining room of restaurant or cafe. The most of sports fans believe that food and alcohol is a big part of any sports show. That is why the dining room takes the most space - almost 60% of the total establishment space. Nearly all sports fans consume beverages while watching sports - beer, soda or water at least. Thus, the restaurant floor plan designers added a large lavatory there. Moreover, project developers considered unnecessary the gender division of such delicate place - perhaps they guess that only men are watching football, or believe that alcohol will eliminate the most of gender differences.Restaurant Floor Plan
Picture: How To Create Restaurant Floor Plan in Minutes
Related Solution:
This sample shows the Data Flow Diagram of the Taxi Service and interactions between the Clients, Operators and Divers, as well as Orders and Reports databases.Taxi Service Data Flow Diagram<br>DFD Example *
Picture: Taxi Service Data Flow DiagramDFD Example
Related Solution:
ConceptDraw DIAGRAM extended with IDEF Business Process Diagrams solution from the Business Processes area of ConceptDraw Solution Park is an ideal software for effective database design and drawing IDEF diagrams visually representing all steps of database design process.Database Design *
Picture: Database Design
Related Solution:
Drawing workflow diagrams combines both creative and analytic practice. To be the most effective in this process you should find a software that suites this kind of practice. Using ConceptDraw DIAGRAM software for drawing workflow diagrams you get support of features, libraries, templates and samples boosts you creativity and keep you focus on analytic practice, not drawing specifics.Drawing Workflow Diagrams *
Picture: Drawing Workflow Diagrams
Related Solution:
ConceptDraw
DIAGRAM 18