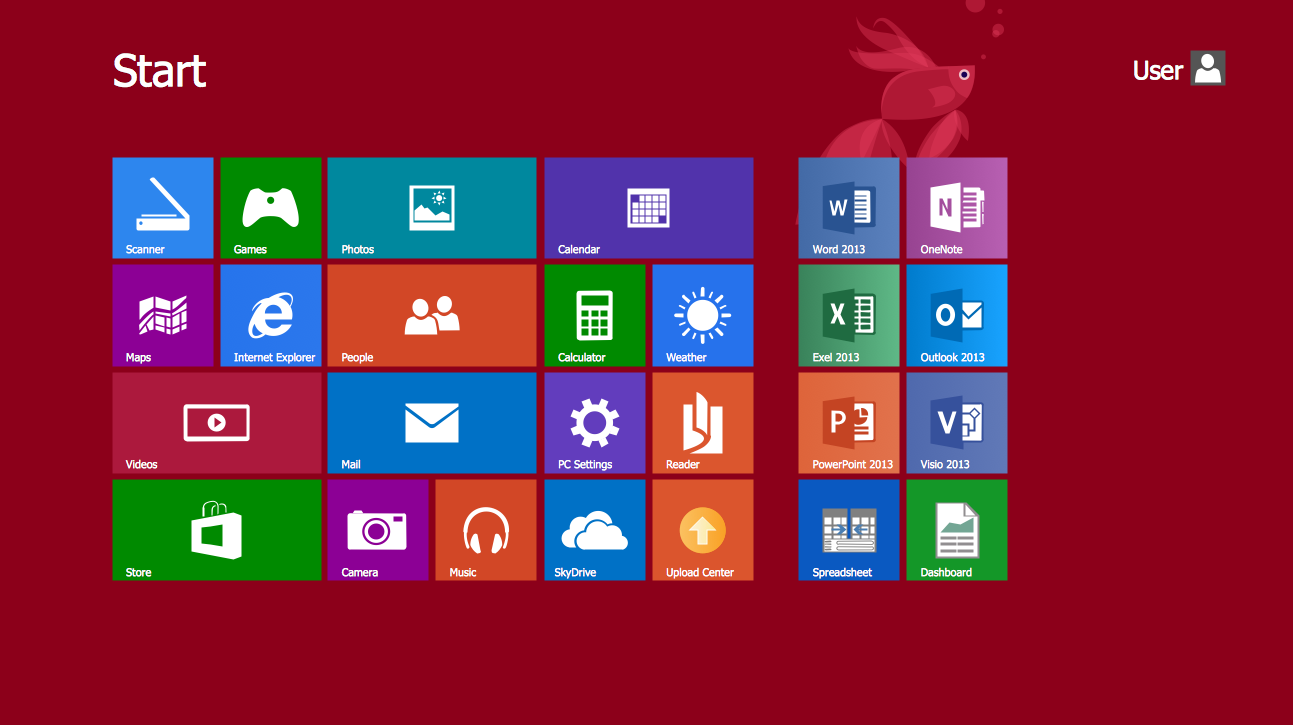
Example 1. Graphical User Interface Examples — Windows 8 Start Screen
14 libraries of Windows 8 User Interface Solution offers you all needed vector objects of Windows 8 interface's elements:
- Window Elements
- Windows 8 Backgrounds
- Windows 8 Apps
- Windows 8 Icons
- Windows 8 Round Icons
- Windows 8 Controls
- Windows 8 Progressive Disclosure Controls
- Windows 8 Interactions
- Windows 8 Menus
- Windows 8 Messages
- Windows 8 Toolbars
- Windows 8 Ribbons
- Windows 8 Text
- Windows 8 UI

Example 2. Graphical User Interface Examples — Windows 8 PC Settings
Nothing could be easier than drag just ready predesigned vector objects from the Windows 8 User Interface solution libraries and quickly arrange them as you need. You can also change the colors, text, and use the objects from numerous libraries of other solutions of ConceptDraw Solution Park.

Example 3. Graphical User Interface Examples — File Menu
The graphical user interface examples you see on this page were created in ConceptDraw DIAGRAM using the vector objects from the libraries of Windows 8 User Interface Solution for ConceptDraw DIAGRAM All these examples are available for viewing and editing from ConceptDraw STORE.
All source documents are vector graphic documents. They are available for reviewing, modifying, or converting to a variety of formats (PDF file, MS PowerPoint, MS Visio, and many other graphic formats) from the ConceptDraw STORE. The Windows 8 User Interface Solution is available for all ConceptDraw DIAGRAM or later users.
NINE RELATED HOW TO's:
When studying computer science, it is important to have good training manuals. To understand how the networks and data links work, you will probably need a set of network diagram examples depicting all the possible interconnections between network devices. You can find them on Internet or try to create your own.
This example of a network topology diagram was made using ConceptDraw Computer and Network Diagrams solution. It represents a bus topology network diagram. A bus topology means that computers and peripherals in the network are connected to a mutual cable (backbone). This topology is often used for small networks. This diagram was designed using vector libraries of network equipment symbols. They also can be applied while creating various LAN and WAN diagrams.
Picture: Network Diagram Examples
In general, you can use any icons to represent network equipment on a diagram. However, there are some icons, for instance, Cisco icons, shapes, stencils and symbols, that are recognizable worldwide. Using those icons you can create Cisco network topology diagrams in minutes and share them anywhere.
The icons depicting Cisco network equipment are recognized and generally applied as standard images for designing network diagrams. They are free to used , but can not be reworked. Cisco network diagrams are created to depict how signals processed on the network equipment and end-user computers and how data transfer through LAN or WLAN between nodes. The vector graphic library of ConceptDraw CISCO Network Diagrams solution includes about 90 icons of Cisco network equipment for designing computer network diagrams with ConceptDraw DIAGRAM.
Picture: Cisco Network Topology. Cisco icons, shapes, stencils and symbols
Related Solution:
ConceptDraw Wireless Network solution includes several wireless network diagram examples that users can modify and make your own diagram.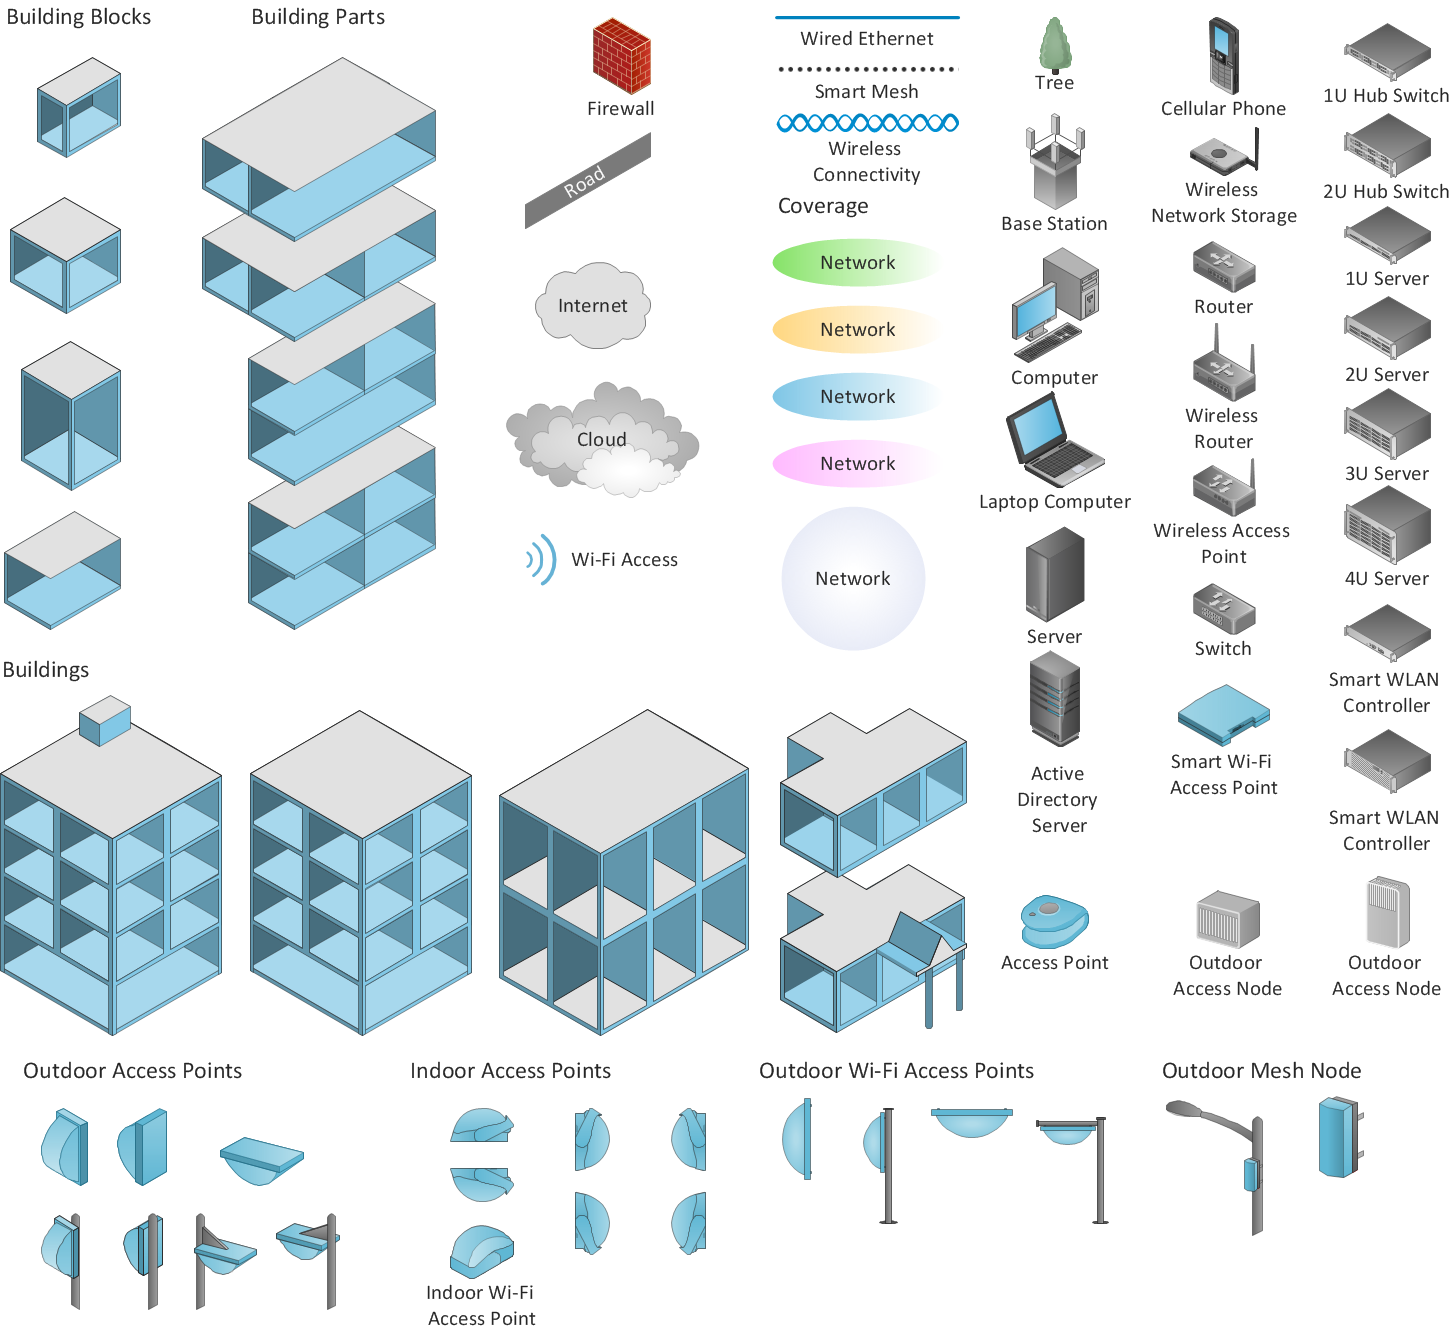
Picture: Wireless Network Diagram Examples
Related Solution:
Cisco Network Diagrams solution from the Computer and Networks area of ConceptDraw Solution Park provides 14 libraries with 450 ready-to-use predesigned vector objects that can be used for quickly and easily drawing the professional Cisco Network Diagrams.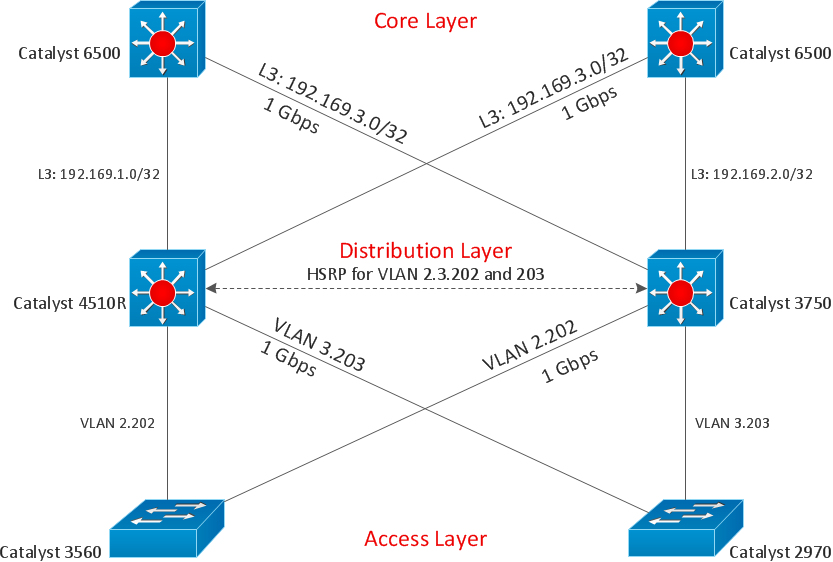
Picture: Cisco Design
Related Solution:
Developing a software project supposes architecture first. To make it proper, you can use data flow diagram model in your current project.
The data flow diagram represents the Model of small traditional production enterprise that is made using Yourdon and Coad notation. It shows how the data is transfered through a process. According to the notation of Yourdon and Coad a process is represented by circles and data stores are drawn using parallel lines. This DFD was created using the ConceptDraw Data Flow Diagrams solution. Using this solution one can visualize data flow accordingly to the rules of two basic notations used for data flow modeling.
Picture: Data Flow Diagram Model
Related Solution:
A causal model is an abstract concept, that describes the causal mechanisms of a system, by noting certain variables and their influence on each other, in an effort to discover the cause of a certain problem or flaw. This model is presented in diagram form by using a fishbone diagram.
ConceptDraw DIAGRAM diagramming and vector drawing software enhanced with Fishbone Diagrams solution helps you create business productivity diagrams from Fishbone diagram templates and examples, that provide to start using of the graphic method for the analysis of problem causes. Each predesigned Fishbone Diagram template is ready to use and useful for instantly drawing your own Fishbone Diagram.
Picture: Fishbone Diagram Template
Related Solution:
The most convenient, useful and right way for software engineers, UI designers, UI developers is to use UI patterns in the process of developing any application for computer devices. The User Interface (UI) patterns are standardized solutions for common design problems.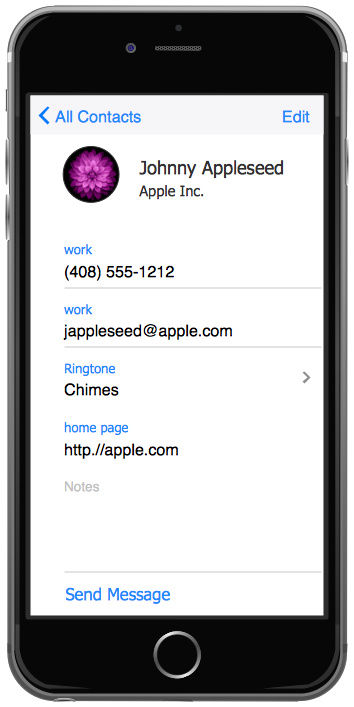
Picture: UI Patterns
Related Solution:
Sentence a grammatical unit of several words, and provides a narrative, question, comment, etc. It begins with a capital letter and ends with proper punctuation. Sentence diagramming allows you to visually present the sentence part function, which helps you build right sentences. Language Learning solution offers the Sentence Diagrams Library with set of vector stencils for drawing various Sentence Diagrams, for visualizing grammatical structures that will assist you in language learning and construction of grammatically correct sentences. ConceptDraw DIAGRAM diagramming software extended with Language Learning solution from the Science and Education area provides the powerful sentence diagraming tools.
Picture: Sentence Diagrammer
Related Solution:
You can use text with any conceptDraw connectors to describe relationships between objects.
Add text to connectors the same way you add text to any object - doubleclick a connector and type.
Picture: ConceptDraw Arrows10 Technology

