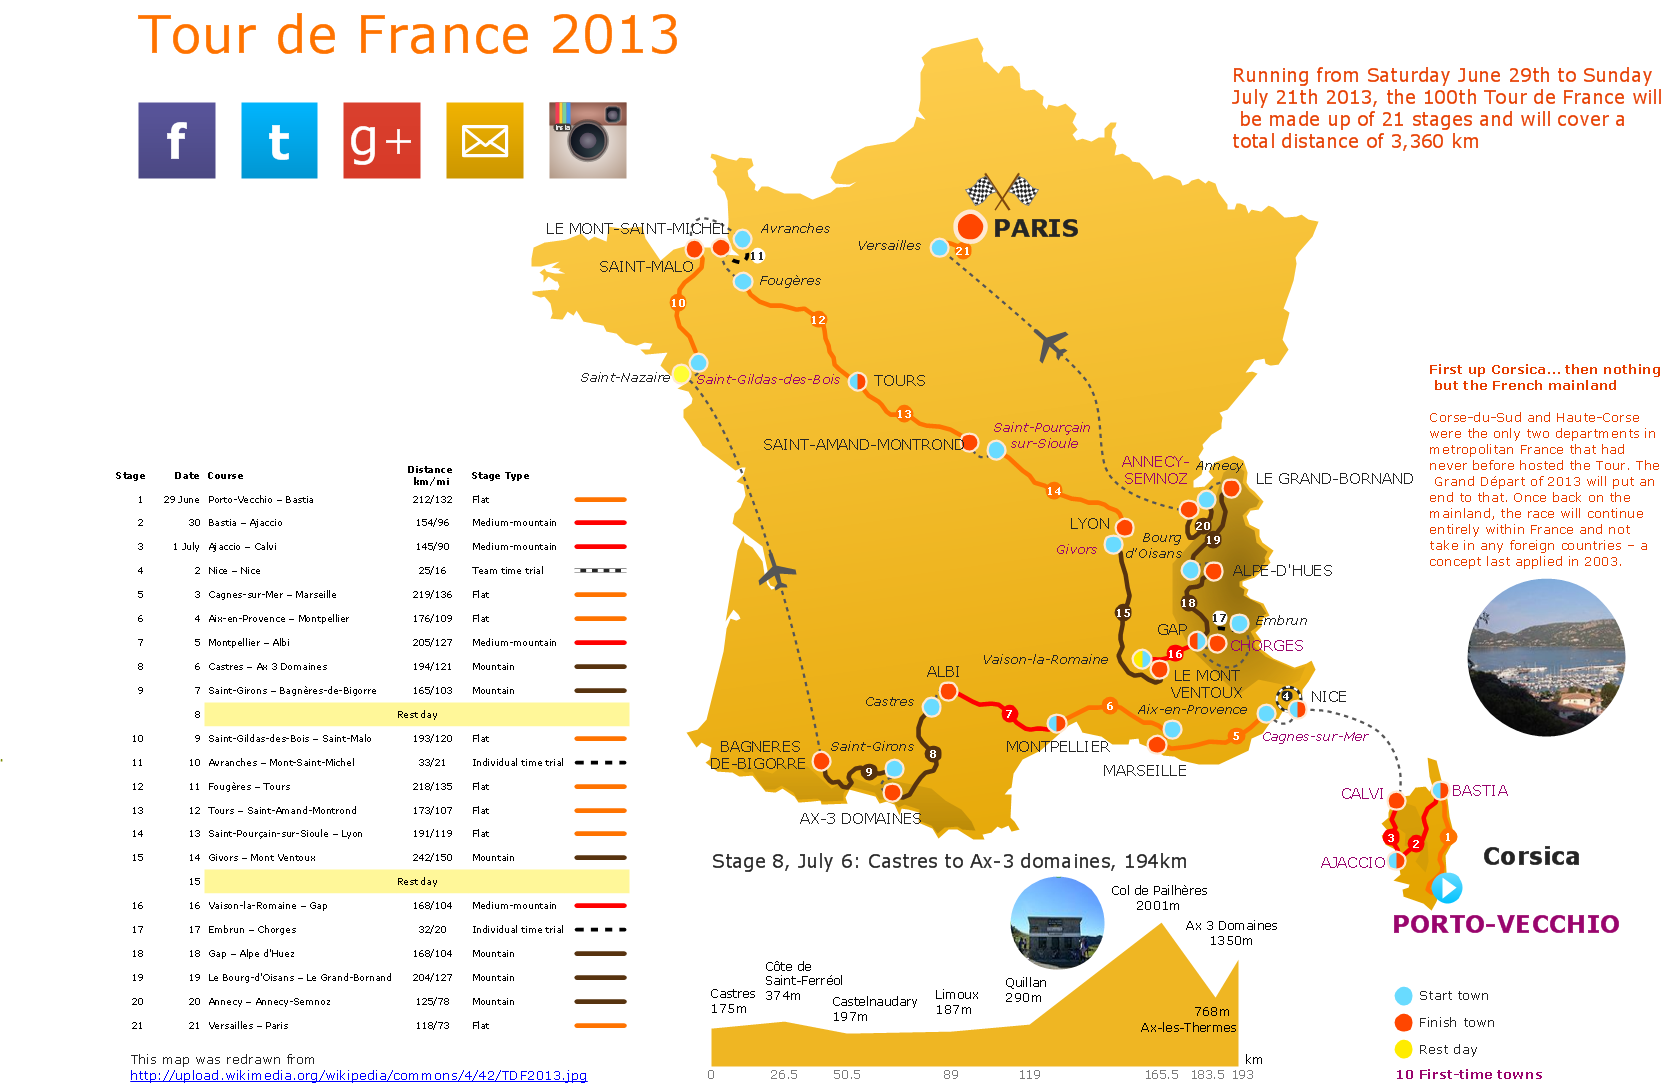
Sample 1. The 100th Tour de France 2013 - Spatial infographics.
Solution Spatial Infographics from ConceptDraw Solution Park extends ConceptDraw DIAGRAM ector diagramming and business graphics software with easy-to-use spatial infographics drawing tools.
This solution contains spatial infographics samples, map templates to be filled in, and libraries of vector stencils for main design elements of spatial infographics.
Use this solution to draw your own geospatial infographics documents with thematic maps, road maps, directional maps and transport maps.
TEN RELATED HOW TO's:
Create maps, flags, and more with ConceptDraw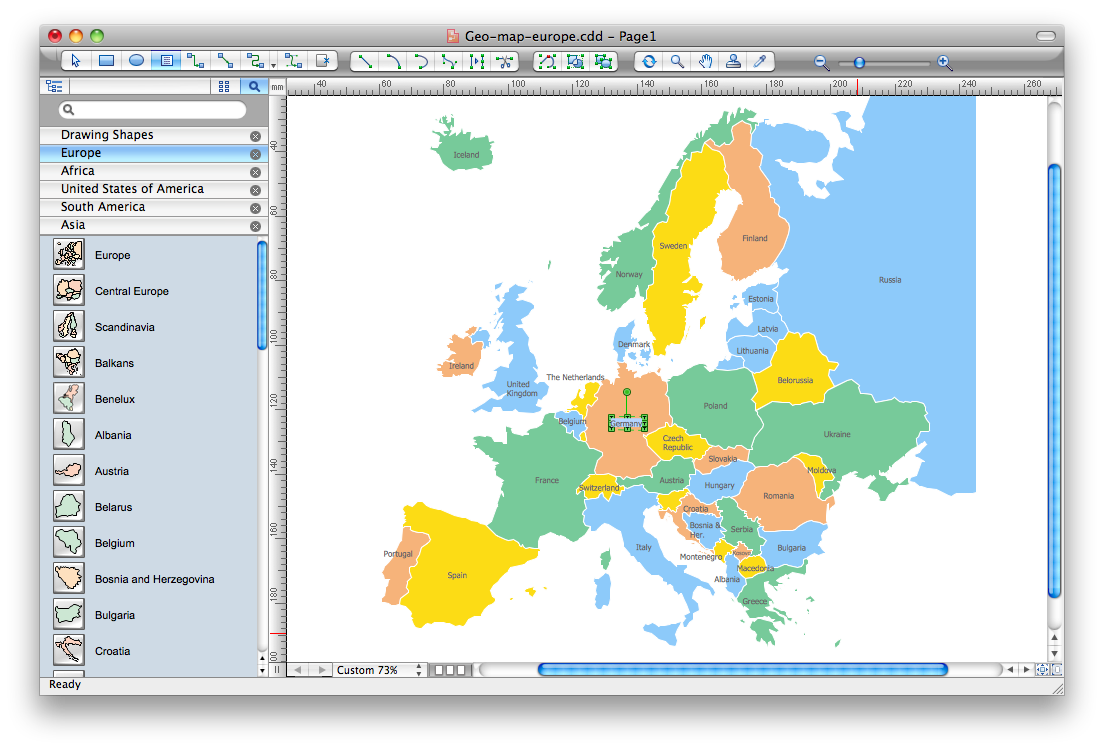
Picture: Map Software
Related Solution:
Any business process consists from a number of tasks carrying out the certain business goal. It is useful to diagram business processes to ensure that they are as foolproof, logical and sequential as possible. This business process diagram describes a typical booking process flow by the example of a cab booking process. It can be used as a roadmap for any booking system implementation. Diagramming a business process allows you to look at the entire project and take into account all types of possible scenarios. Business process diagram helps you investigate and clarify the process thoroughly so that you can find out how it can be improved. Business process diagram supports team communications by ensuring that each process element is clear and everyone in the team is on the same page.
Sometimes your company brings you less profit than you expect it to be, and it’s difficult to reveal the causes. Maybe it’s time to learn new technologies, because business diagram are easily developed by means of special software, so you won’t make any extra effort. In return, you will increase your productivity and get more done in a less time.
Picture: Business Diagram Software
Related Solutions:
You want design Pictorial Chart or Infographic? And you need powerful infographic software? Then ConceptDraw DIAGRAM diagramming and vector drawing software extended with Pictorial Infographics Solution from the “Infographics” Area is exactly what you need.
Picture: Pictorial Chart
Related Solution:
ConceptDraw defines some map types, divided into three categories. Every map type has specific shapes and examples.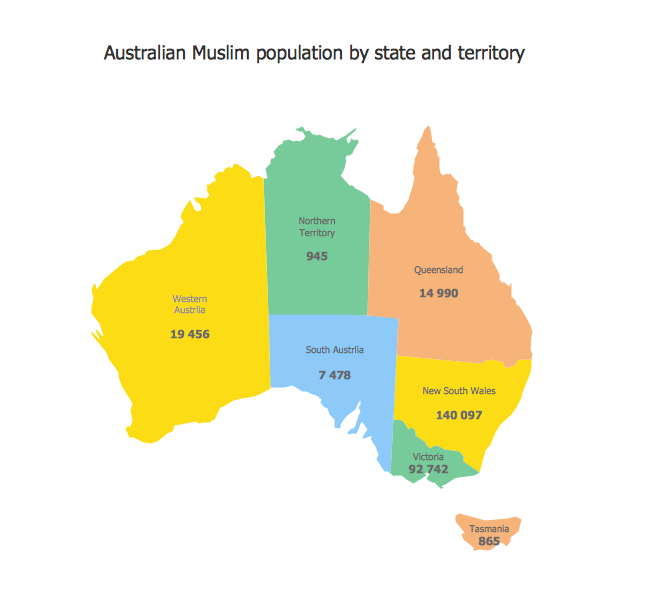
Picture: Types of Map - Overview
Related Solution:
Burma, officially the Republic of the Union of Myanmar, commonly shortened to Myanmar, is a sovereign state in Southeast Asia bordered by Bangladesh, India, China, Laos and Thailand.
The vector stencils library Myanmar contains contours for ConceptDraw DIAGRAM diagramming and vector drawing software. This library is contained in the Continent Maps solution from Maps area of ConceptDraw Solution Park.
Picture: Geo Map - Asia - Myanmar
Related Solution:
ConceptDraw DIAGRAM diagramming and vector drawing software enhanced with unique Cooking Recipes solution from the Food and Beverage area of ConceptDraw Solution Park ideally suits for easy drawing attractive illustrations with dinner recipes.
Picture: Dinner Recipes
Related Solution:
There are a lot of tutorials that get you familiar with emergency situations. If you want to know how to create emergency plans and fire evacuation schemes then you must be concerned about safety. There is a list of rules that you should follow to set the fire safety equipment properly.
Discover this precise and accurate fire emergency evacuation plan. This sample drawing demonstrate facilities of ConceptDraw DIAGRAM together with its Fire and Emergency Plans solution. The evacuation plan is designed to provide employees and visitors with a map depicting the ways they may use to escape the building in emergency situations. The telephone sets, first aid boxes and extinguisher are also marked on this plan. The evacuation plan should contain a legend for readers. The similar plans are commonly hang on the wall on the building's floors.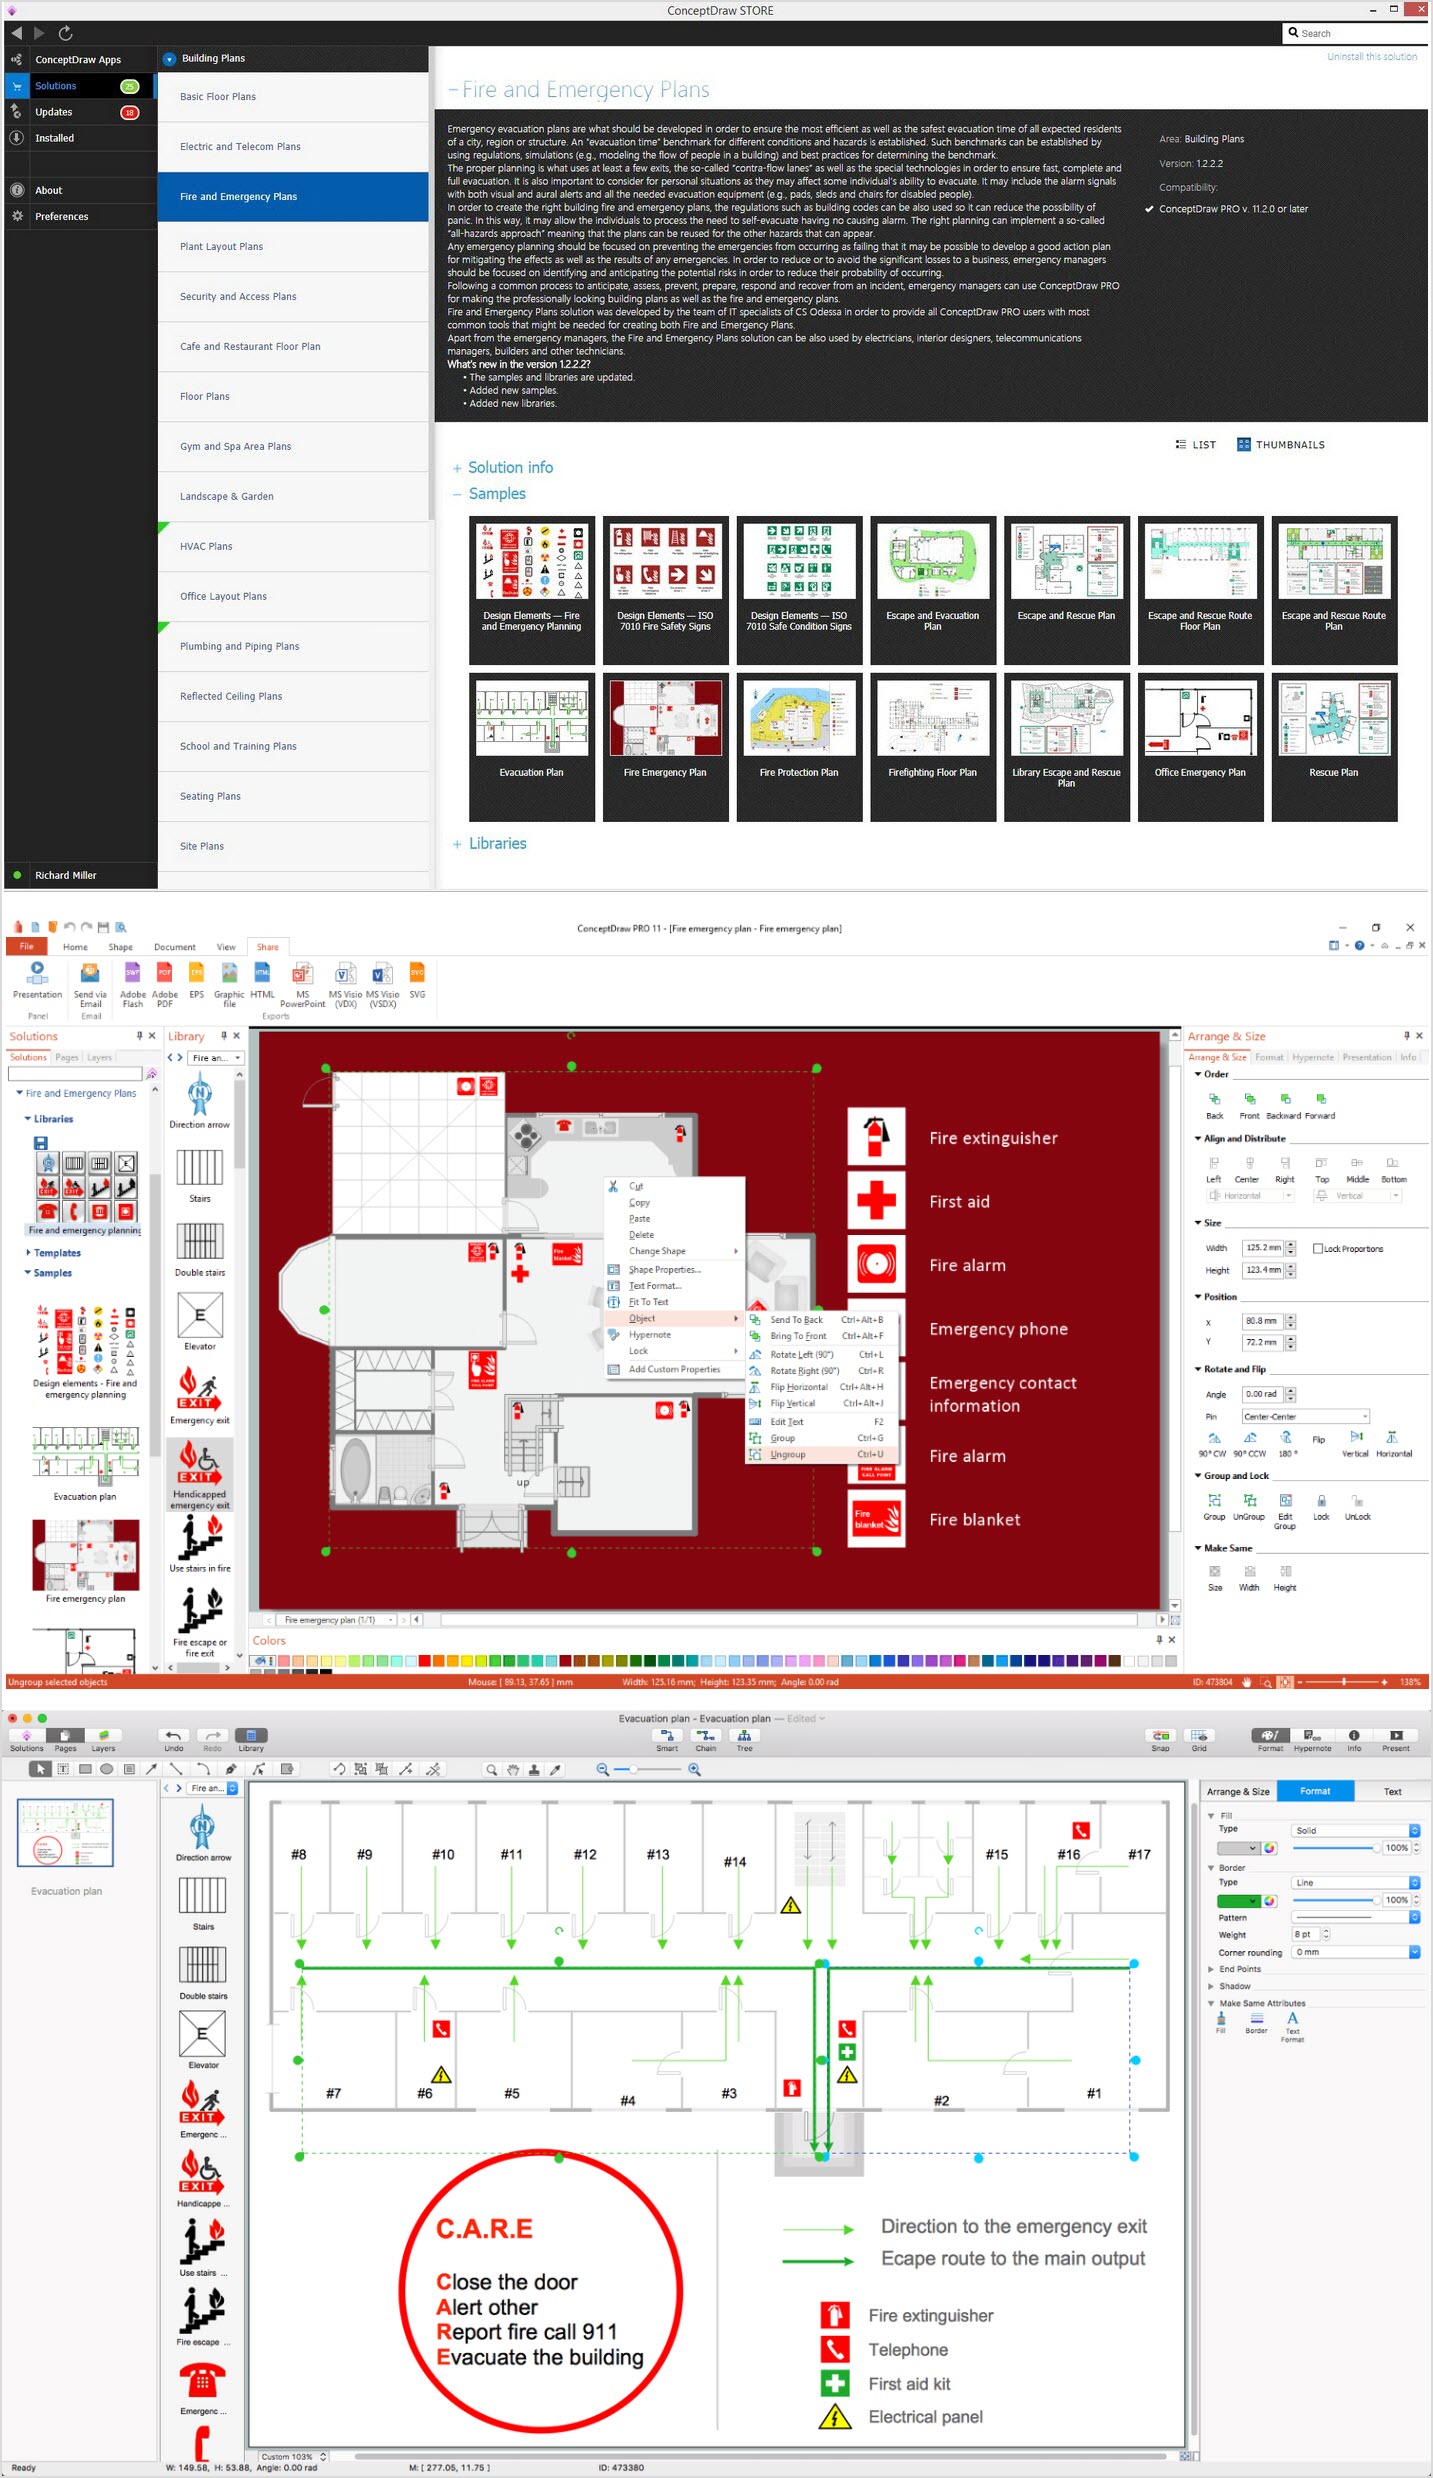
Picture: How To Create Emergency Plans and Fire Evacuation
Related Solution:
This sample shows the Flowchart of the ACC general account creation. This Flowchart describes the Start point, the process of the handling the user requests and the End point – creating of the account. The shapes represent the subprocesses and the arrows between the shapes shows the sequence of the actions.
This sample was created in ConceptDraw DIAGRAM diagramming and vector drawing software using the Flowcharts solution from the Diagrams area of ConceptDraw Solution Park.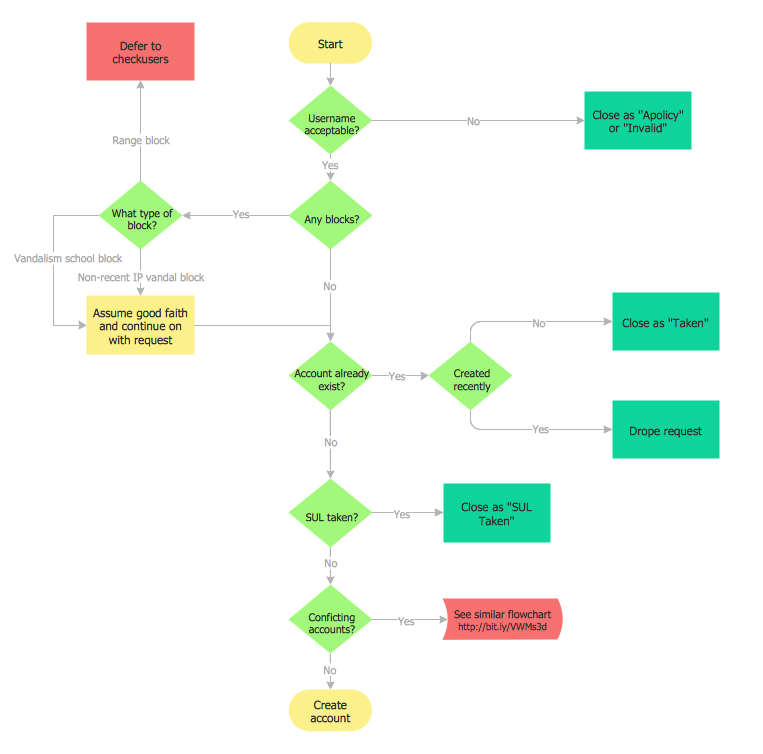
Picture: Examples of Flowchart
Related Solution:
In software engineering, a UML Class Diagrams is a type of static structure diagram that is used both for general conceptual modeling of the systematics of the application, and for detailed modeling translating the models into programming code.
Use ConceptDraw DIAGRAM with UML class diagram templates, samples and stencil library from Rapid UML solution to show the classes of system, their attributes, operations or methods, and the relationships among the classes.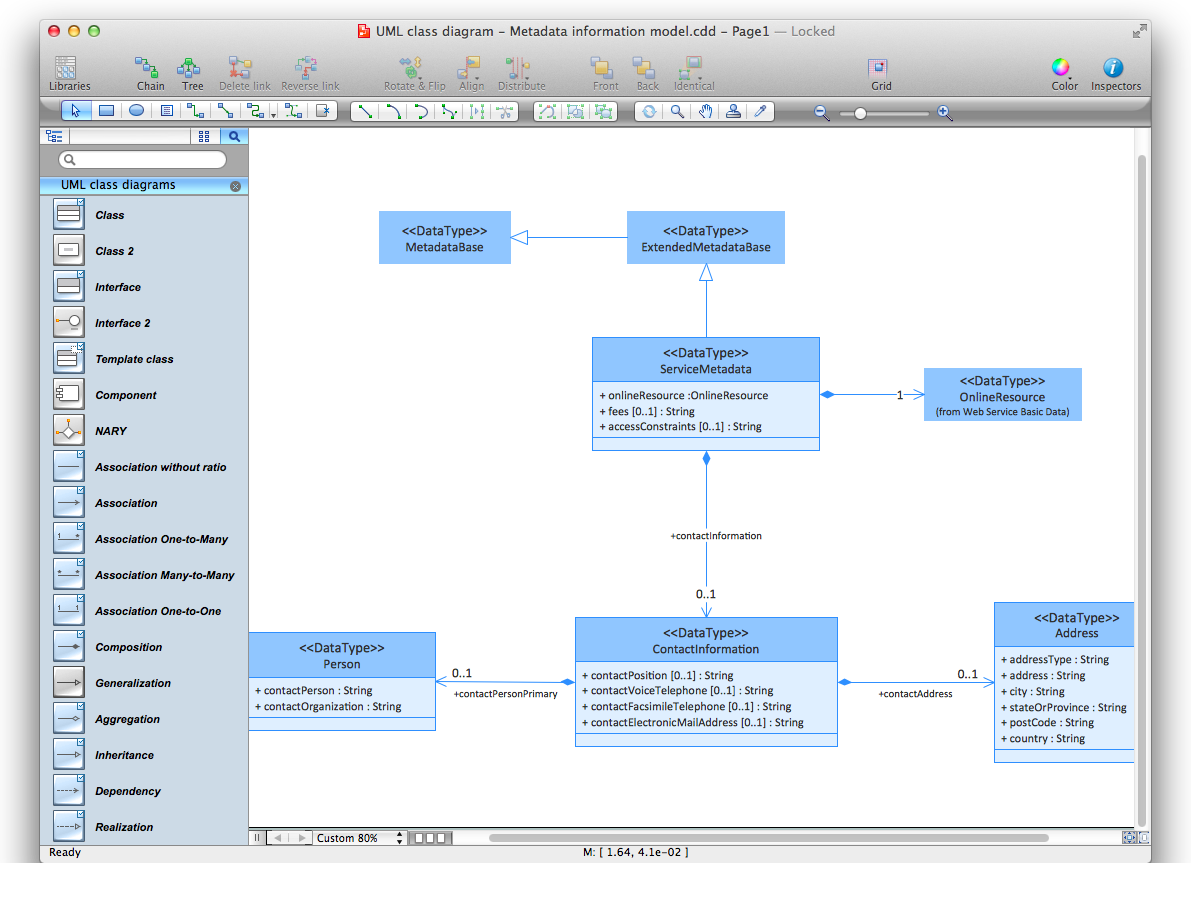
Picture: UML Class Diagrams. ConceptDraw DIAGRAM - Diagramming Software for Design UML Diagrams
Related Solution:
When you need a drawing software to create a professional looking cross-functional charts, ConceptDraw with its Arrows10 Technology - is more than enough versatility to draw any type of diagram with any degree of complexity.
Use templates with process maps, diagrams, charts to get the drawing in minutes.
Picture: Cross-Functional Process Map Template