|
Use ConceptDraw MINDMAP for creative thinking, planning, organization, problem solving, presentations, decision making, note taking, team brainstorming and other tasks.
|
BUSINESS |
 |
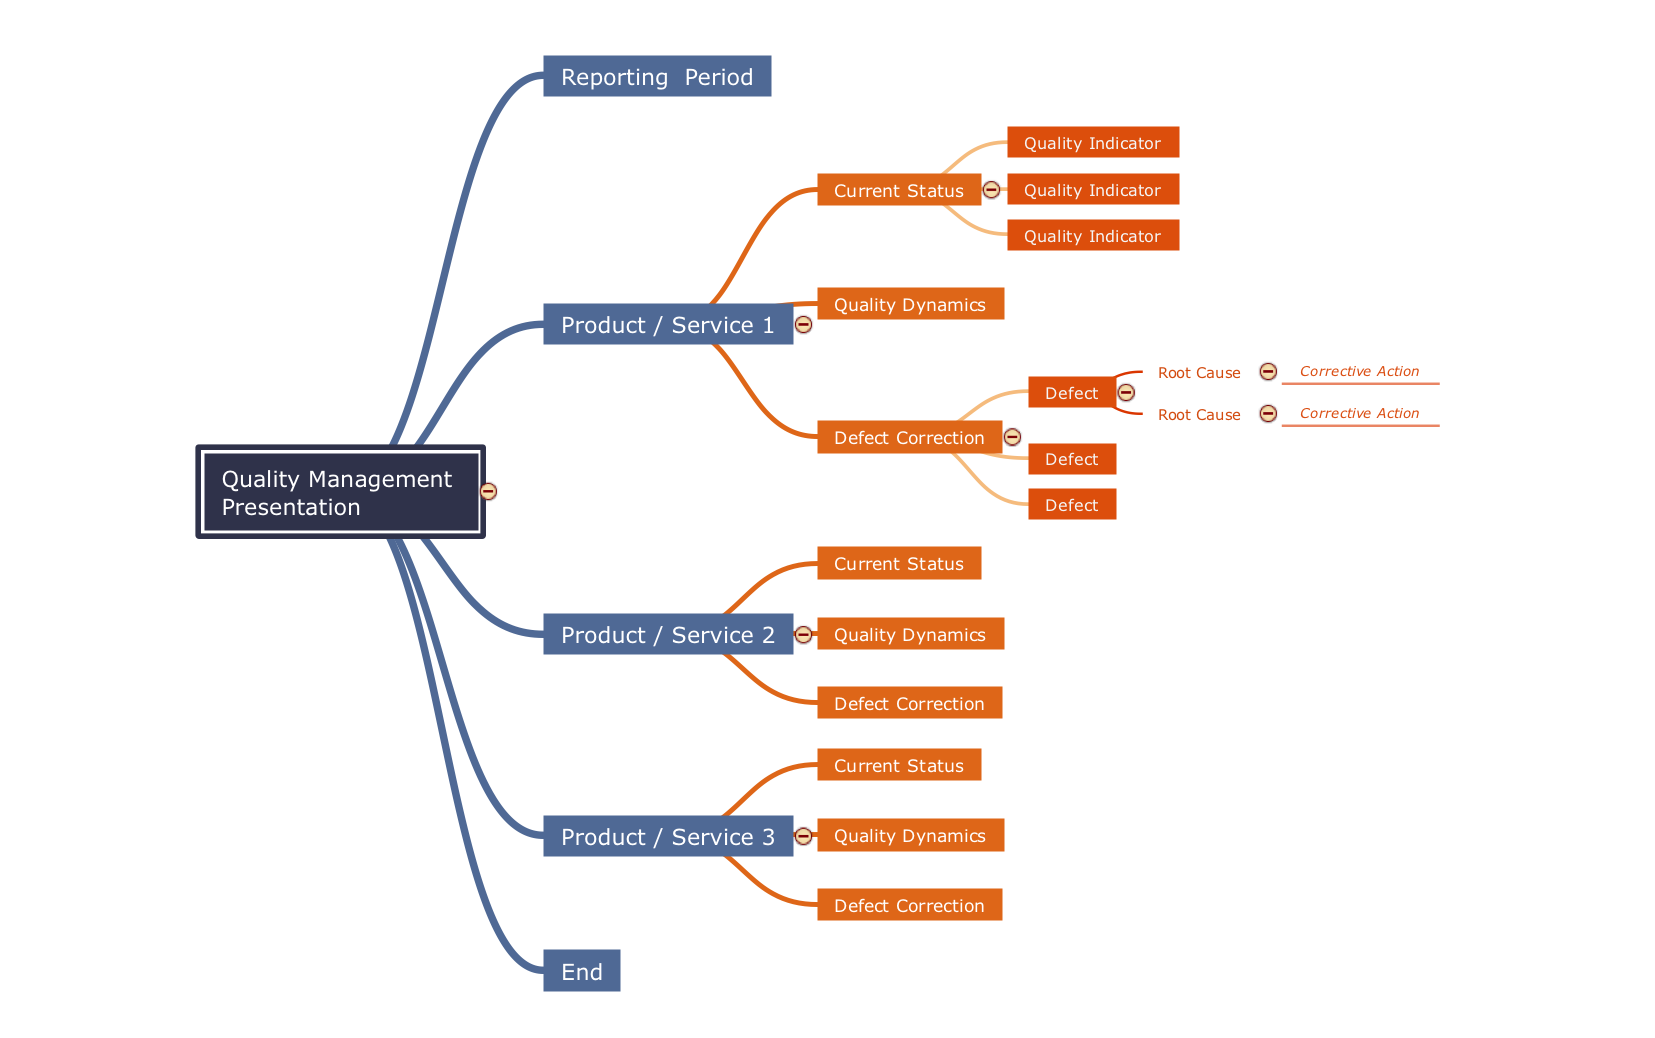
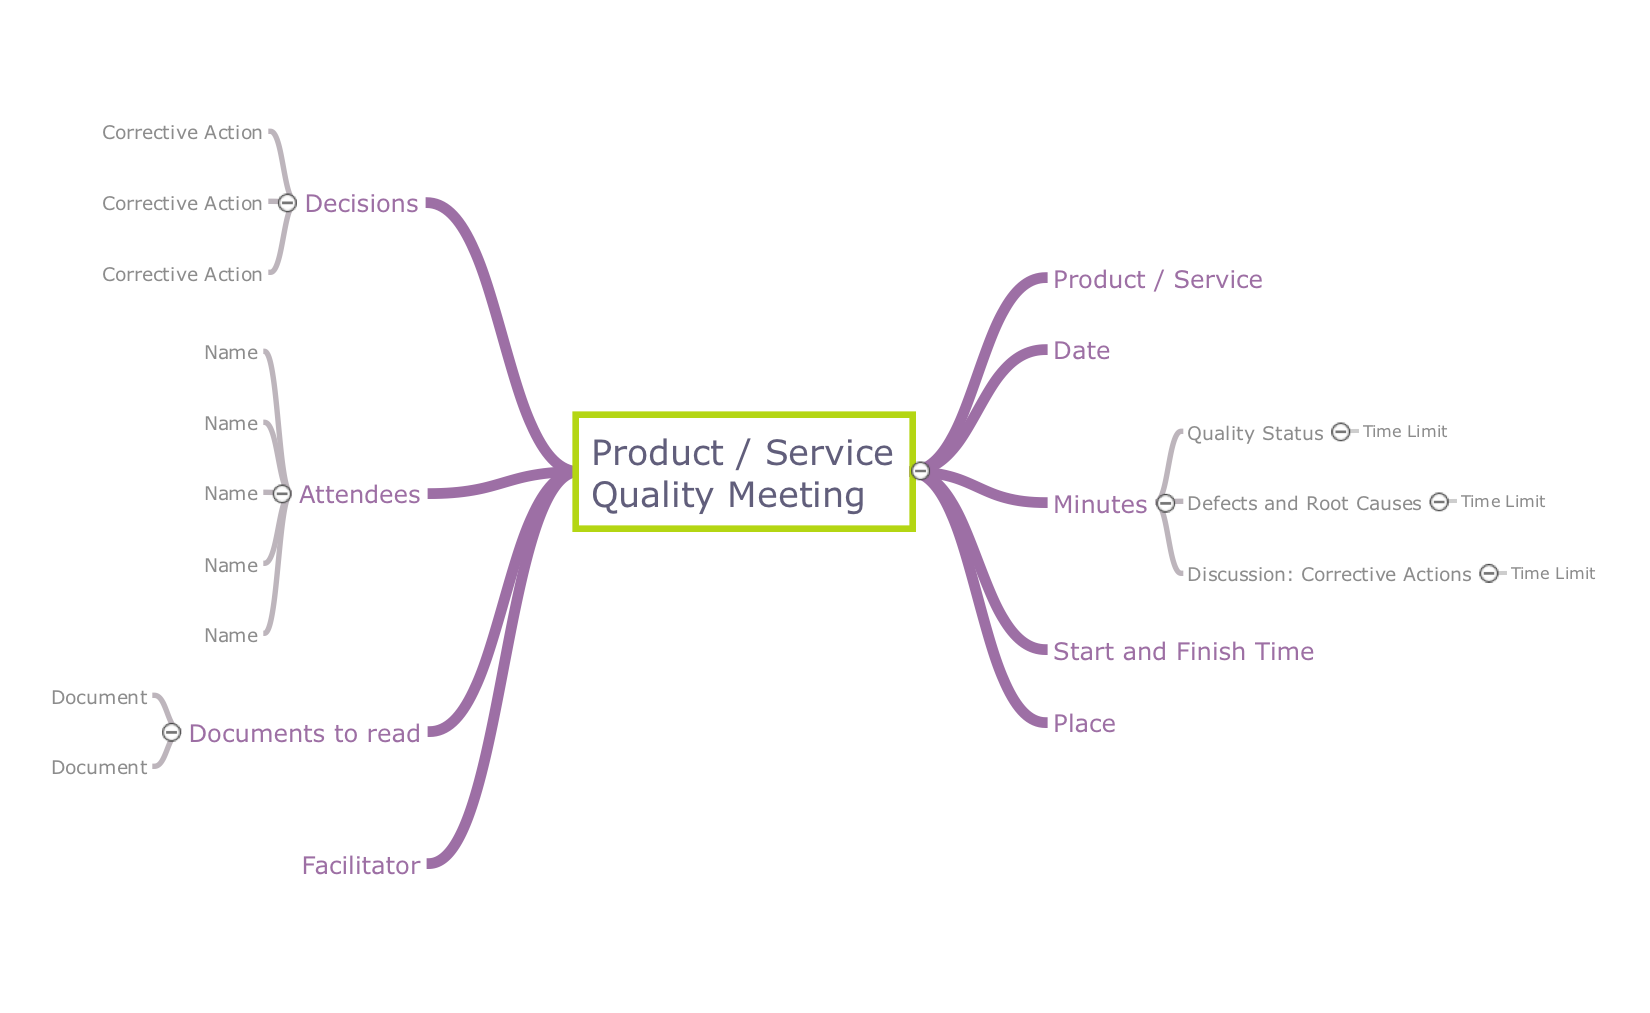
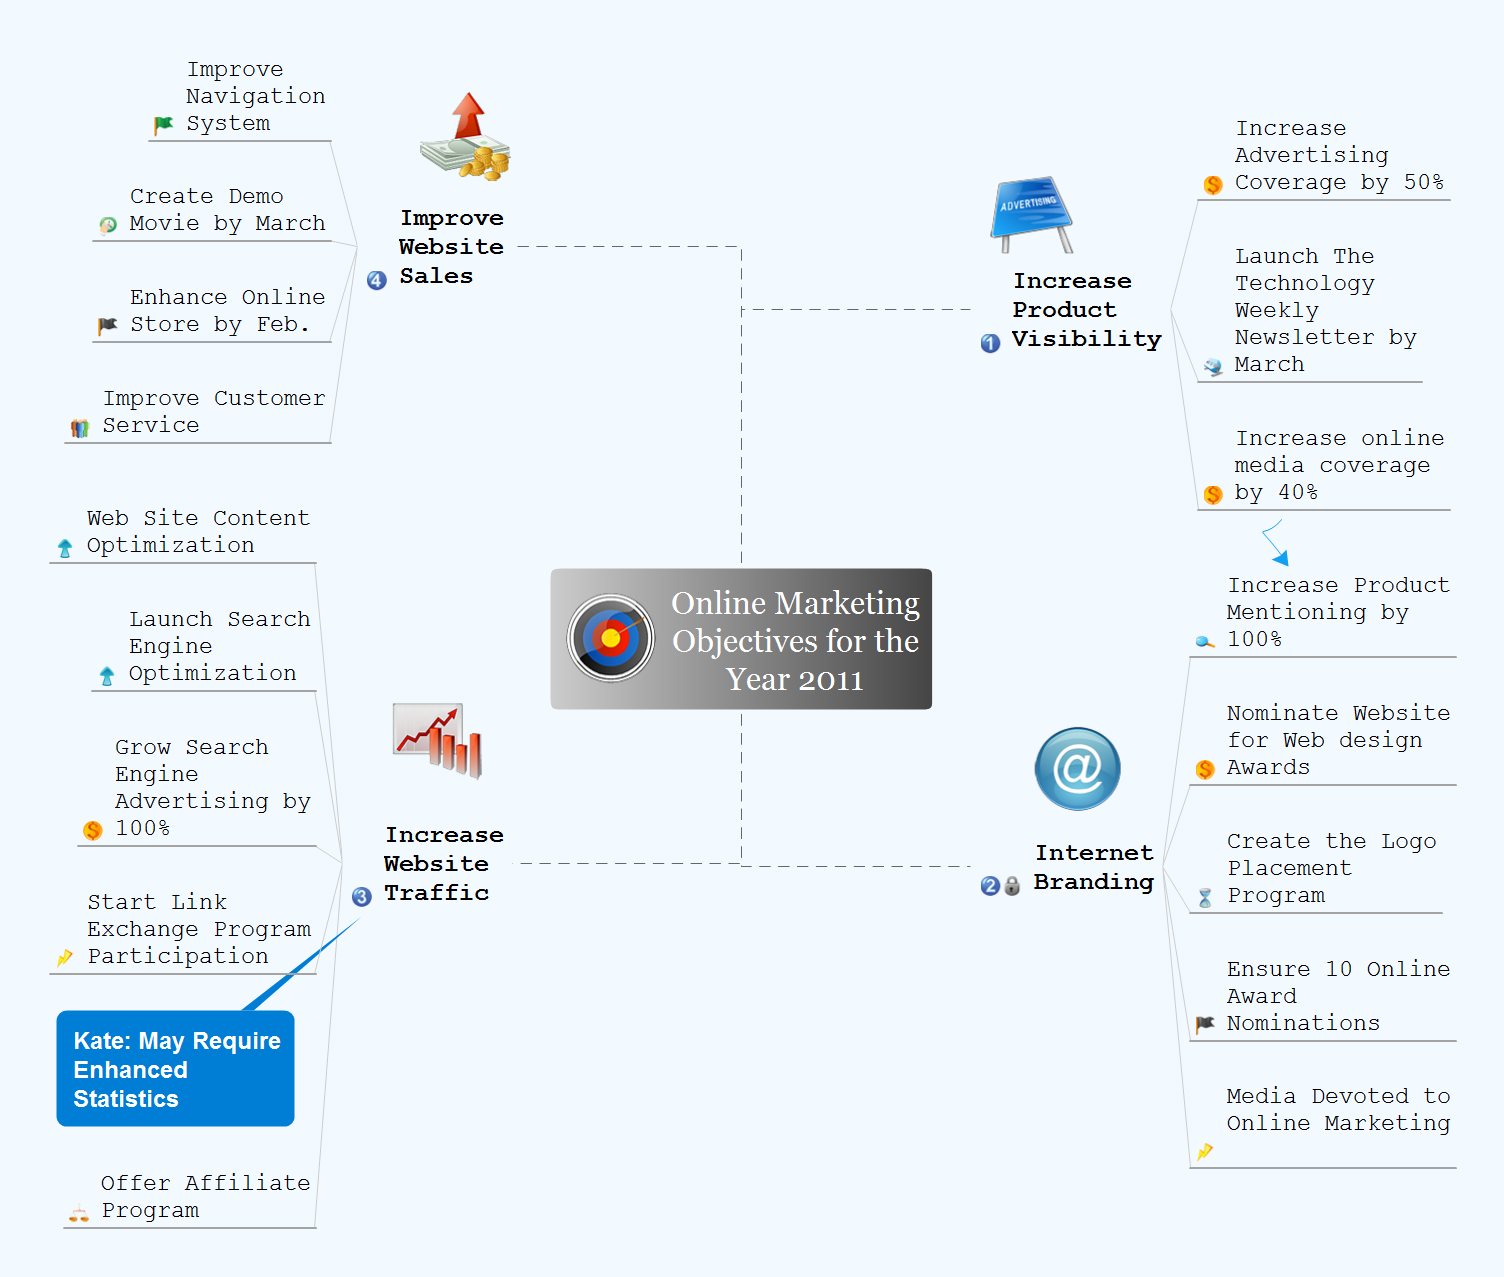
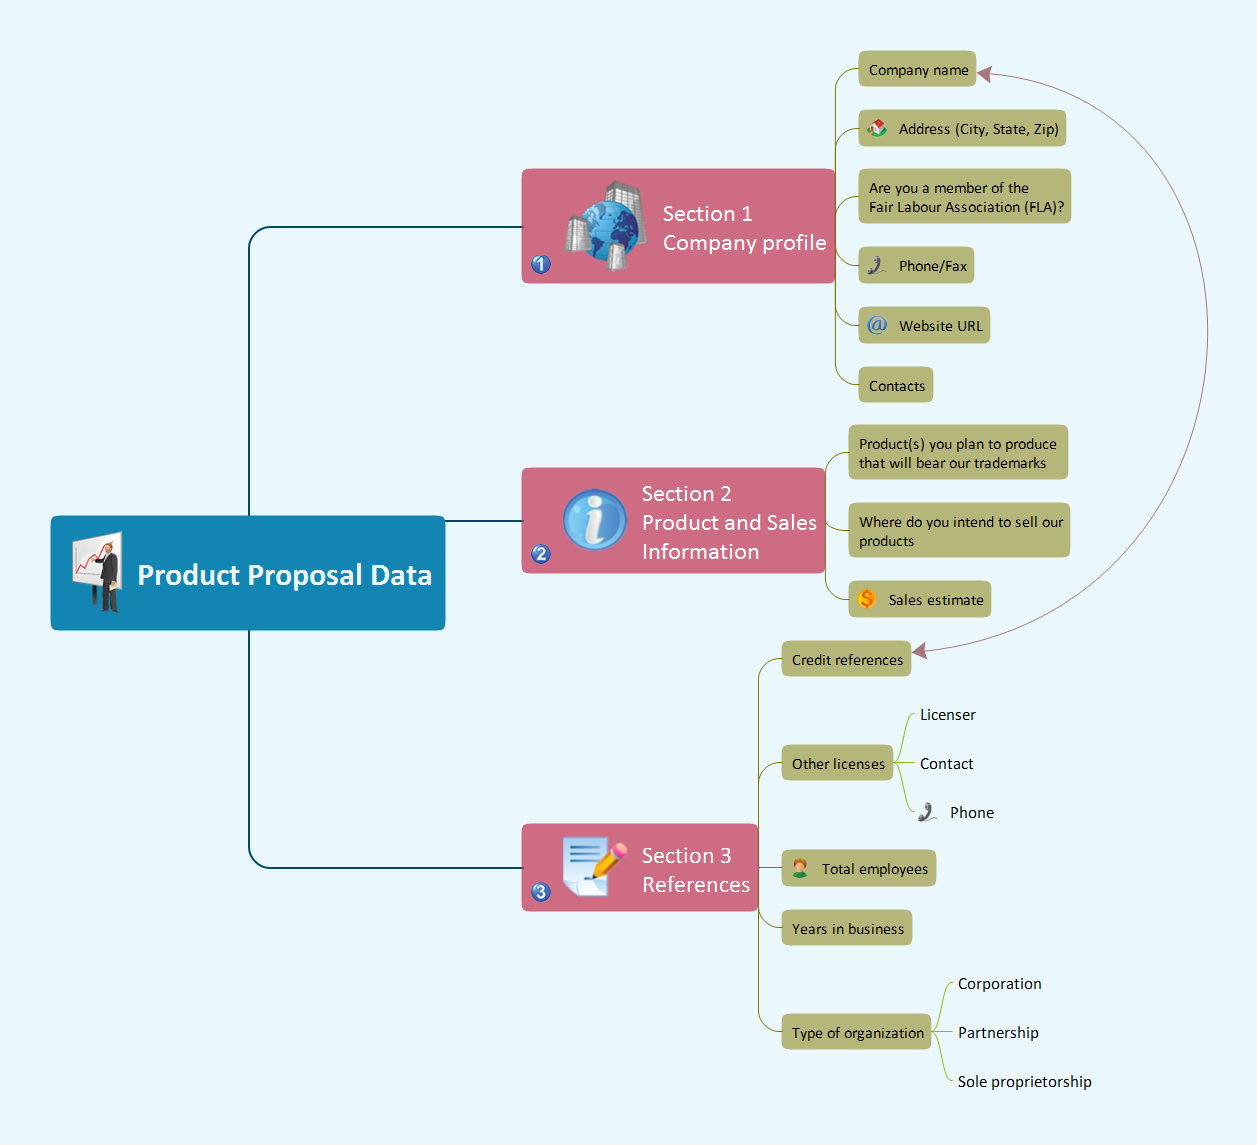
New developments in the world market are bound to produce new challenges, demanding an enhanced ability to comprehend, visualize, interpret and share data. Mind maps have proved the mind-mapping technique's usability, since they enable to retain information and ideas more efficiently than by using traditional "linear" methods of notation. Mind mapping software ConceptDraw MINDMAP is intended for use in generating, visualizing, structuring and classifying ideas, and is recommended as an essential tool in any activity involving organizing data, problem solving or decision making.
ConceptDraw MINDMAP delivers efficiency and productivity, by assisting in planning, improving organization, and transforming great ideas into critical strategies. You and your peers will make better informed decisions because of improved communications inside your team and with external stakeholders. All interested parties become key collaborators to the process when communications is facilitated by using powerful mind mapping tool ConceptDraw MINDMAP
|
|
|
SCIENCE & EDUCATION |
 |
The education process demands from those involved in this sphere forward thinking and a well planned out approach which can be achieved with ConceptDraw MINDMAP - powerful mind mapping software.
For students - a clear system for work organizing when revising for exams, working on a project, or keeping track of investigation. For graduate students and researchers working on doctorates - a tool to structure a large amount of interconnected material which needs to be quickly, accessible and clearly set out. For training - an irreplaceable tool for the work of coaches as well as students during both preparation and training.
The cross platform compatibility of ConceptDraw MINDMAP makes them the universal mind mapping and communicative tool. You can freely share mind maps, you have created in Mac with your friends who use Mac and Windows as well.
|
|
|
PERSONAL |
 |
In everyone's life there are plenty of different situations where you need to study, analyze, take stock and think about how they affect you.
ConceptDraw MINDMAP is an excellent mind mapping tool which can help you save time, increase the effectiveness of your thinking, and learn to concentrate on the most important things in your life.
Make use of the advantages of mind maps which ConceptDraw MINDMAP can give you for your personal development. ConceptDraw MINDMAP enables you to create the same mind map on Mac or Windows. You can exchange your issue among computers and platforms.
|
|