One formula of professional mind mapping :
input data + output data + make great presentation
ConceptDraw MINDMAP
Capture What You Think, Do What You Plan
ConceptDraw® MINDMAP software provides all components for professional Mind Mapping and much more beyond the traditional mind mapping. It imports MS Office files and major mindmaping files such as MindJet Mindmanager and Freemind. It provides rich exporting capabilities to generate MS Office documents, Project Management reports as well as create slide show for presentation, export it to MS PowerPoint or demonstrate via Skype to remote team.
Using ConceptDraw MINDMAP with Skype conference call - you can play and control the presentation's slide show on computers of Skype call participants. This is professional mind mapping presentation to remote team via Skype conference call.
Input data + Output data:
- MS Word, MS PowerPoint, MS Project, Mindjet MindManager®, INGYRE
- Project Status Reports: tasks, milestones, resources and assignments
Make great presentation:
- via Skype conference call:
play the slide show via Skype conference call to your remote team - Use Slide Navigator to setup sequence of presentation and interactive notes
- Use Map Stylish tools to make presentation fancy in one click
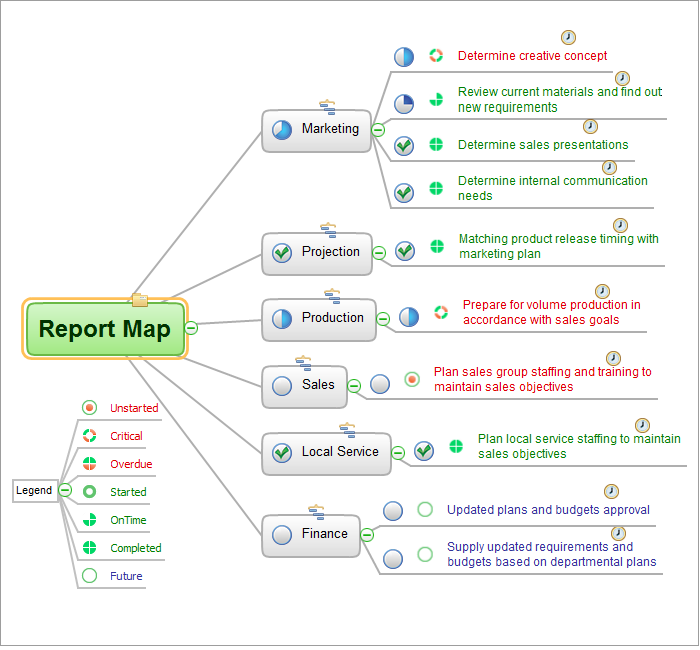
Example - Project Status Report
Here an example of project status report which can be subject of reporting the project status. This status report includes many pages and slides. It can be played as a slide show presentation to remote team using Skype conference call. This example created with ConceptDraw MindMap software.
Pic. 1. Professional Mind Mapping
Related Video:
Video tutorials related with ConceptDraw Mindmap includes - beginner, intermediate and advanced cources.
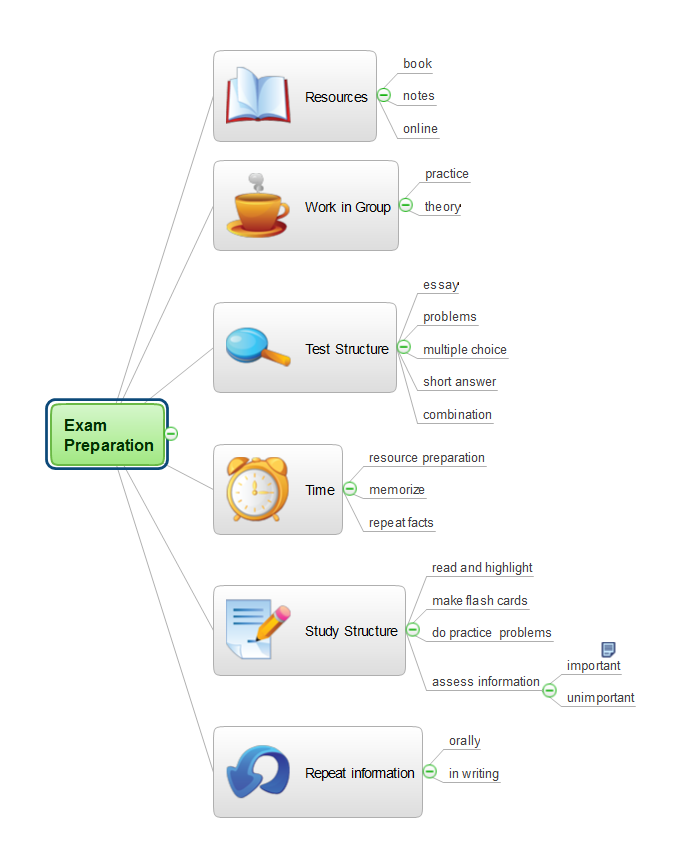
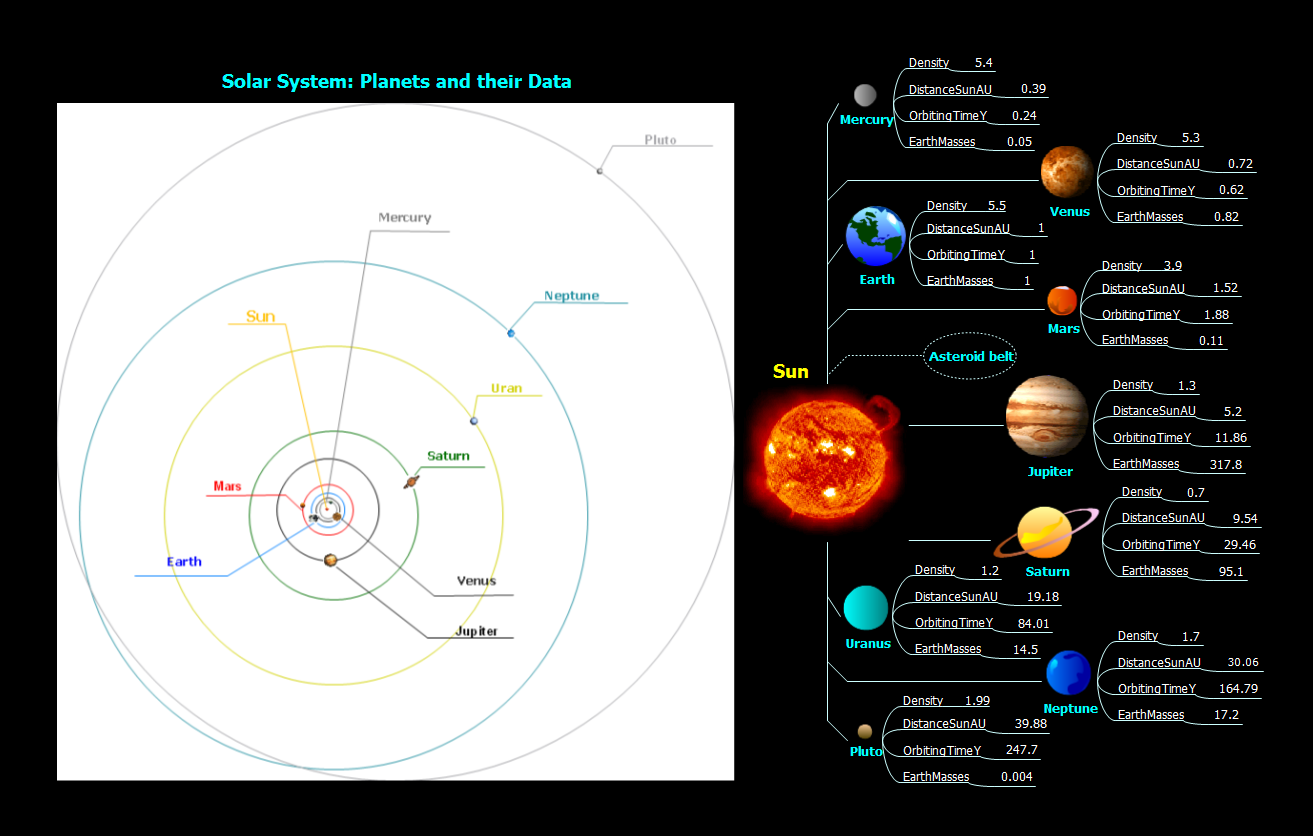
Example - Solar System
This example demonstrates capability of professional mind mapping to create learning materials and use them for webinars or training classes.
See also:
How to make great presentation via Skype?
...how it works with ConceptDraw MINDMAP ?
See also Samples of mind maps:
- Mind Maps
- Mind Maps — Marketing
- Mind Maps — Idea Communication
- Mind Maps — Mind Map Exchange
-
Mind Maps — Presentation Exchange
TEN RELATED HOW TO's:Design efficiently the technical flow charts in ConceptDraw DIAGRAM software for various fields and provide ✔️ clarity, ✔️ accuracy, ✔️ usability, ✔️ simple communication, analysis, and improvement Picture: Technical Flow Chart ExampleRelated Solution:Video tutorials on ConceptDraw products. Try it today!
 Picture: What can you create with ConceptDraw MINDMAP?Critical information from your mindmaps can be accessed from almost any device using ConceptDraw MINDMAP and Evernote.
 Picture: Gather Requirements Exchanging Mind Maps with EvernoteRelated Solution:The vector stencils library Spain contains contours for ConceptDraw DIAGRAM diagramming and vector drawing software. This library is contained in the Continent Maps solution from Maps area of ConceptDraw Solution Park.
 Picture: Geo Map — Europe — SpainRelated Solution:Use Software Diagram Templates from the solutions of Software Development area for ConceptDraw DIAGRAM to create your own professional looking Software Diagrams in minutes. The Software Diagrams designed with ConceptDraw DIAGRAM are vector graphic documents and are available for reviewing, modifying, converting to a variety of formats (image, HTML, PDF file, MS PowerPoint Presentation, Adobe Flash or MS Visio XML), printing and send via e-mail in one moment.
 Picture: Software Diagram TemplatesThe diagrams and schemes are effective way to visualize the Cloud computing, the differences in their types and how Cloud computing works. Thanks to the ConceptDraw DIAGRAM diagramming and vector drawing software extended with Cloud Computing Diagrams solution from the Computers and Network area of ConceptDraw Solution Park, you can design diagrams as easy and quickly as you need.
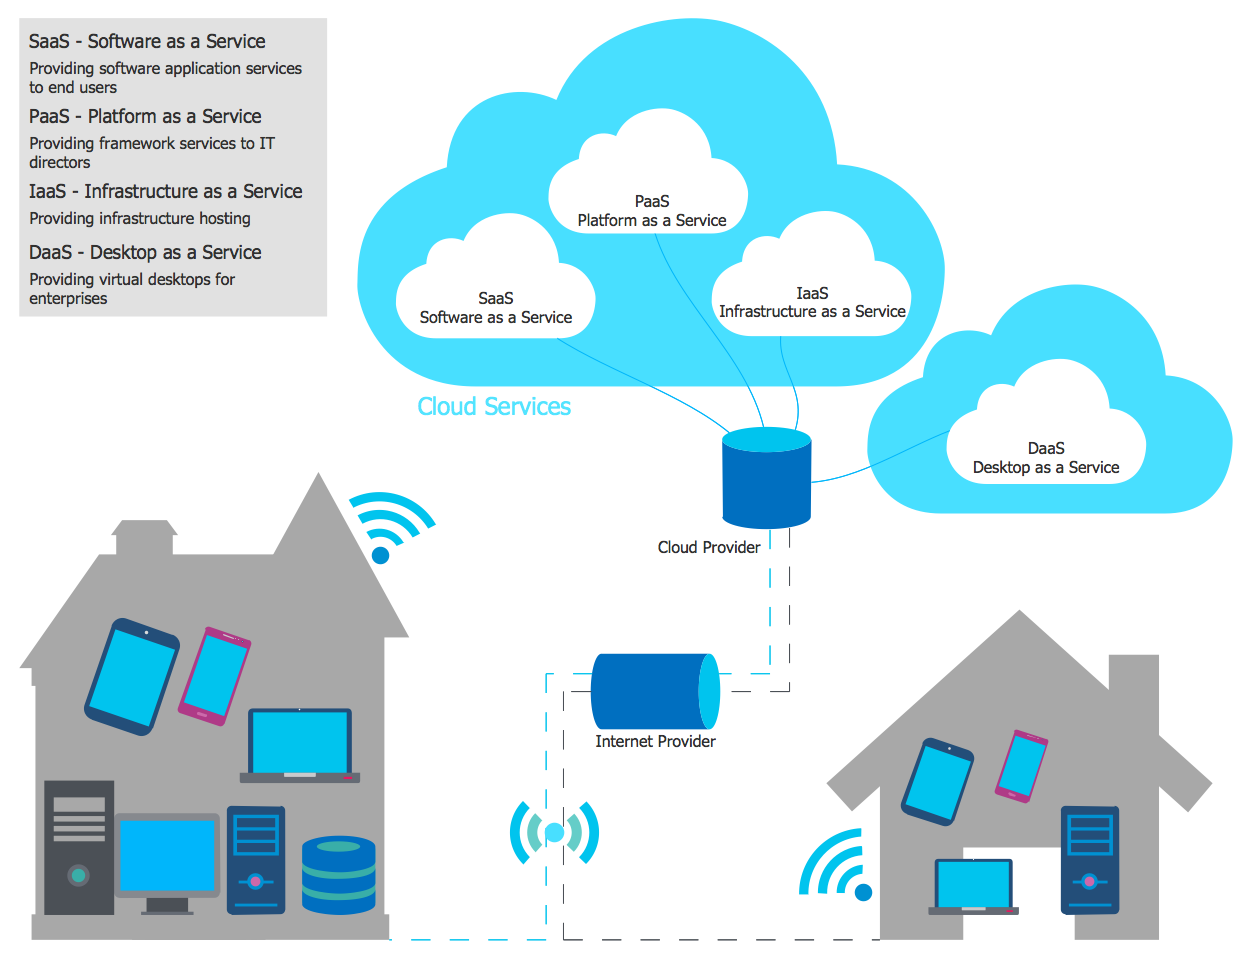 Picture: How Cloud Computing WorksRelated Solution:ConceptDraw MINDMAP and Evernote has a multitude of options for users — you can save any part of a mind map: including topics, branches, and entire maps to your Evernote.
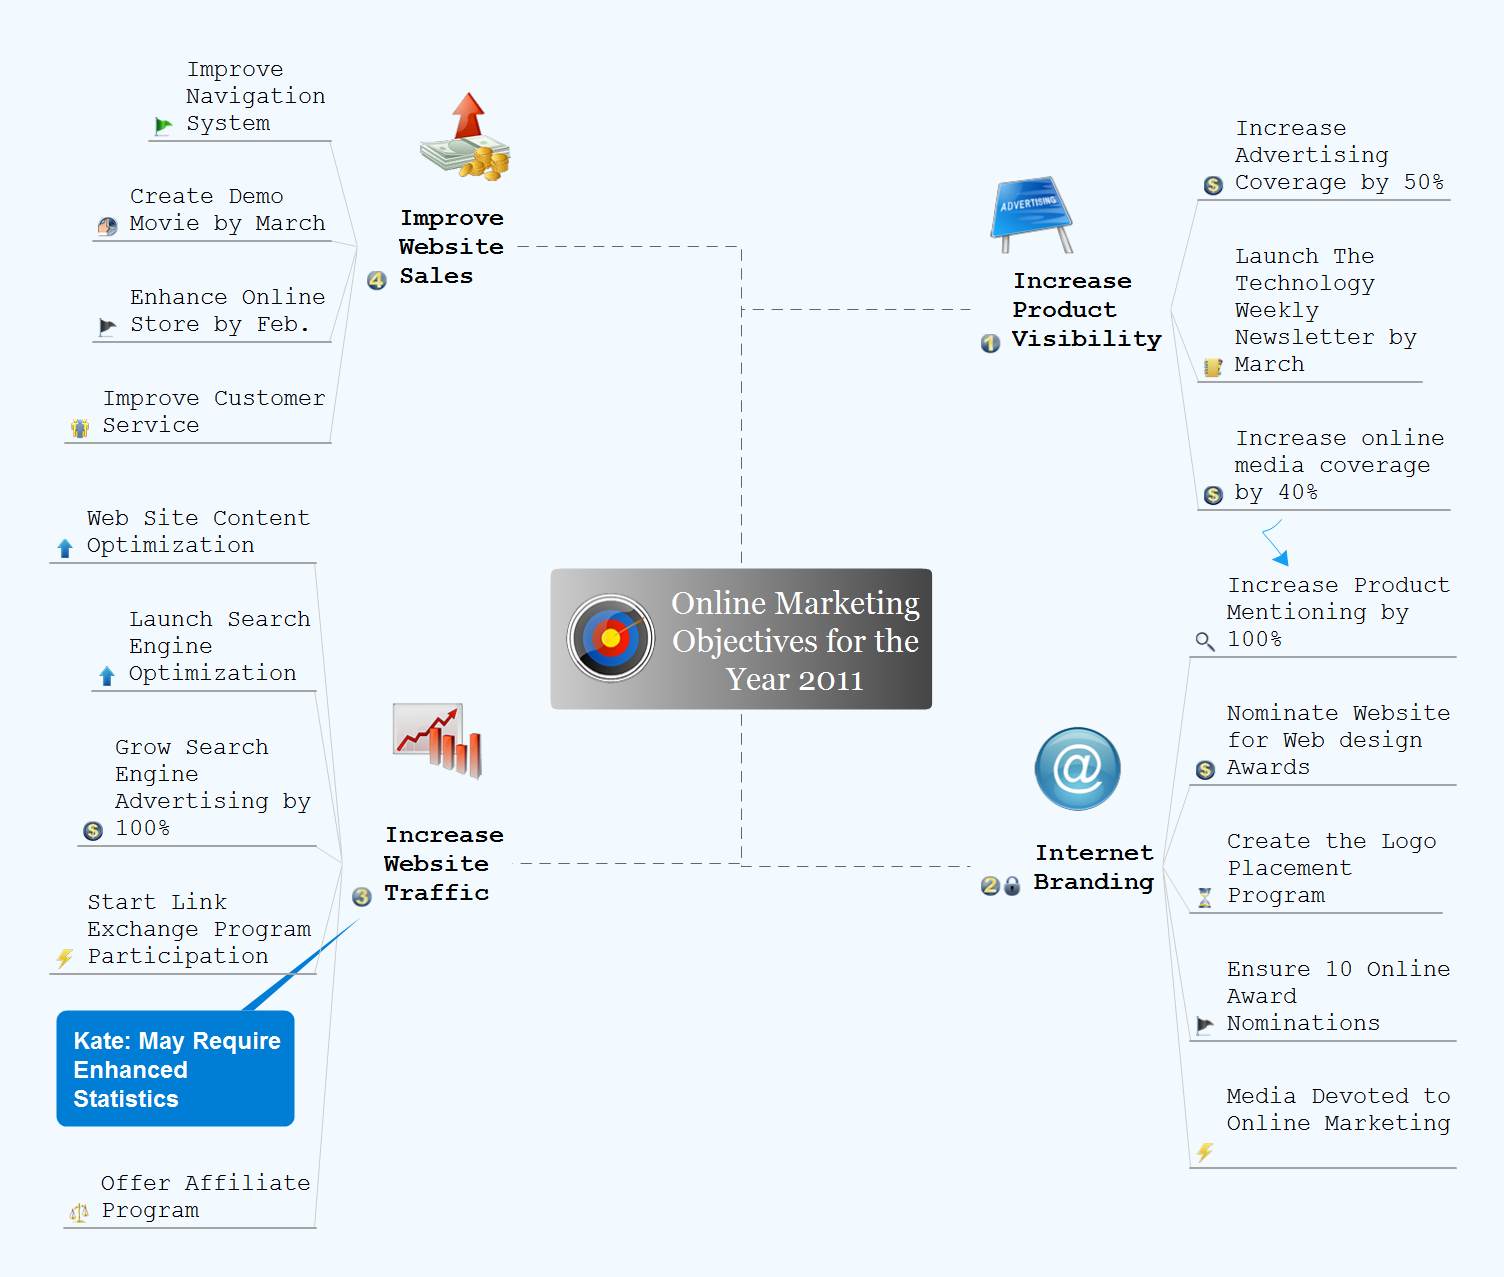 Picture: Evernote + MindMappingRelated Solution:ConceptDraw DIAGRAM is a powerful drawing and vector diagram maker software that allows to design the professional looking Influence Diagrams quick and easy.
 Picture: Influence Diagram SoftwareRelated Solution:UML Collaboration Diagram Example Illustration. This sample was created in ConceptDraw DIAGRAM diagramming and vector drawing software using the UML Collaboration Diagram library of the Rapid UML Solution from the Software Development area of ConceptDraw Solution Park. This sample shows the creation process of the contact list and can be used at the staff training and staff working, at the attraction process the new clients.
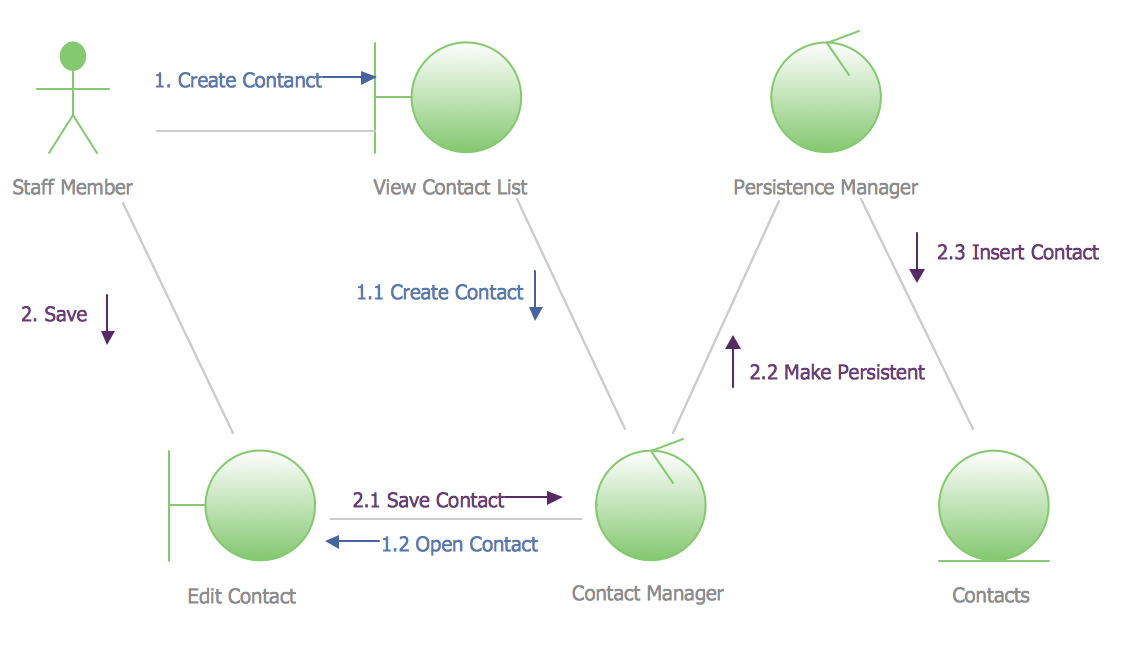 Picture: UML Collaboration Diagram Example IllustrationRelated Solution:ConceptDrawMINDMAP 16