TOWS matrix template contains a blank TOWS Matrix to be filled with the user’s data. After SWOT analysis, TOWS analysis focuses on external factors and action planning.
This sample of a completed TOWS matrix diagram with example entities provides an example to help you start your SWOT and TOWS analysis.
TEN RELATED HOW TO's:
The Total Quality Management Diagram solution helps you and your organization visualize business and industrial processes. Create Total Quality Management diagrams for business process with ConceptDraw software.
Picture: Total Quality Management Value
Related Solution:
ConceptDraw MINDMAP with Quality mindmaps solution as a demonstration of the creative approach to quality management in daily work of quality management team.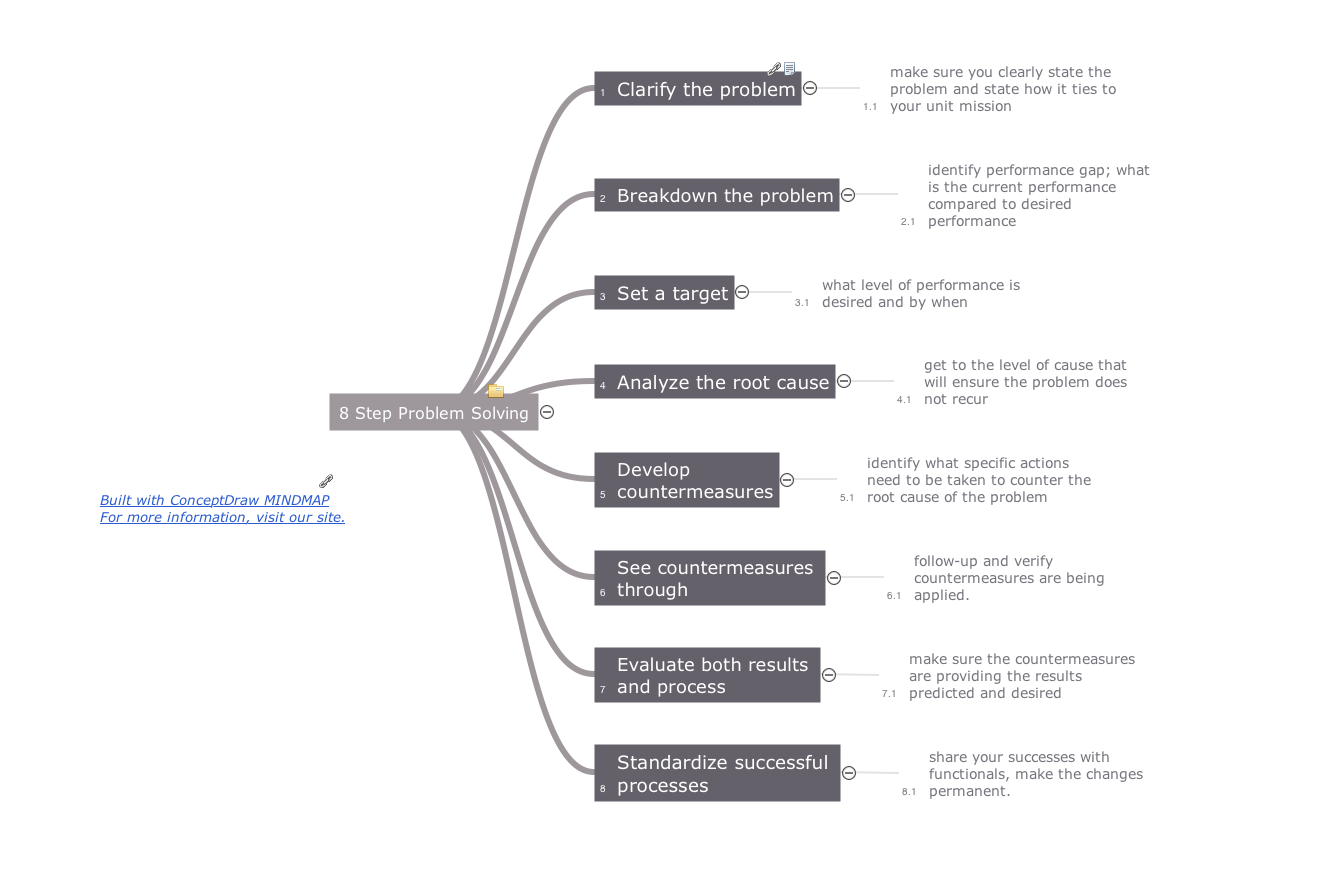
Picture: Quality Management Teams
Related Solution:
Matrix organizational structure is one of the main forms of structures which is actively used by organizations to carry forth the functions of a company visually and effectively.
Now we have ConceptDraw DIAGRAM diagramming and vector drawing software extended with 25 Typical Orgcharts solution from the Management area of ConceptDraw Solution Park which will help easy represent matrix organizational structure of any degree of complexity.
Picture: Matrix Organization Structure
Related Solution:
Subway infographic design elements for ConceptDraw DIAGRAM (mac and pc).
Picture: Infographic design elements, software toolsSubway and Metro style
Related Solution:
The efficiency of any corporate network depends on many factors such as equipment, architecture etc. Moreover, every administer knows that network architecture is a cornerstone for any system. Also, it's easy to make a draft of a network structure using an appropriate diagramming tool.
Designing network architecture diagrams refers to the network structure, including hardware, software, connectivity, protocols of communication and type of transmission: wired or wireless. A high performance, highly reliable, and secure network architecture is critical for the successful deployment and operation of modern communication network. This diagram represents in detail the sample of the network architecture of the three-divisional office. It is designed using vector libraries supplied with ConceptDraw Computer and Networks solution.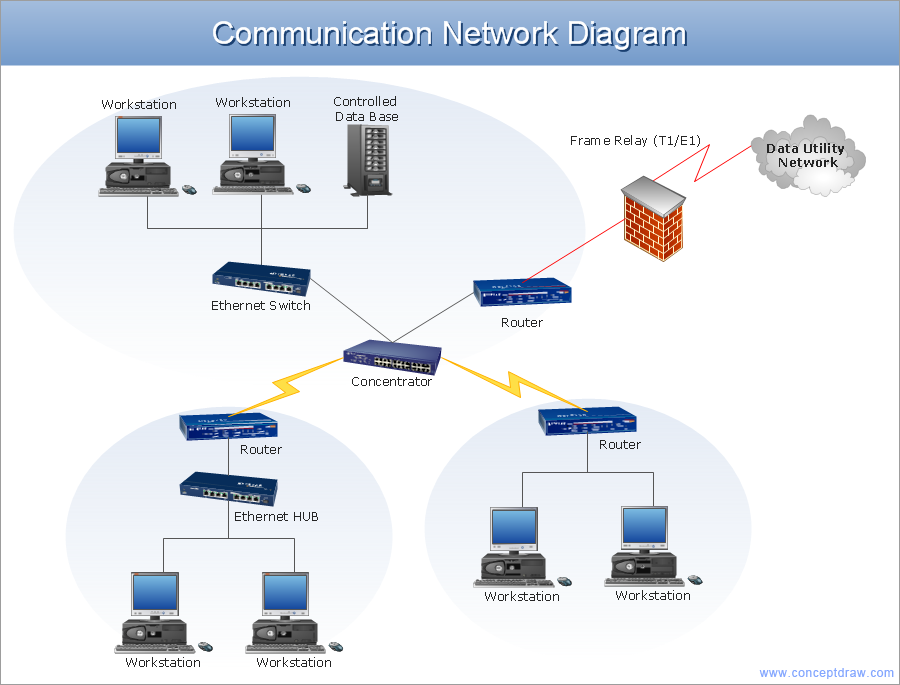
Picture: Network Architecture
Related Solution:
It’s not easy to plan all the details of your landscape at once. Therefore, you can use a bubble diagram to create a draft of the future project. You can develop any bubble diagrams and use them in your landscape design project with ConceptDraw DIAGRAM and it’s predesigned templates.
This bubble diagram can be applied while initiating the development of garden and landscape design. The bubble diagrams used for this purpose are different from the classic bubble diagrams. Being used in landscape and garden design, they obtain the quite another understanding. Bubbles in this diagram visualize some captured areas, which define the general spaces of a future garden: lawn, flower garden, pool, built-up area, lighting, etc. The bubble diagram represents the landscape project without any special expenses on its creation. It is better to make such simple sketch before you drill down into detailed project and cost estimates.
Picture: Bubble diagrams in Landscape Design with ConceptDraw DIAGRAM
Many people who use mind mapping software for personal organizing find ConceptDraw MINDMAP sufficiently useful mind mapping tool in their business and daily life. Especially many positive responses receive ConceptDraw MINDMAP as cross platform tool to mind maps for Macintosh and Windows.
Picture: Think and act effectively
ConceptDraw MINDMAP - an excellent tool for exporting mind maps to PowerPoint to visualize and presenting your project. You can simply generate, change, update your mindmap and then make a presentation in PowerPoint.
Picture: How To Do A Mind Map In PowerPoint
Related Solution:
Create bar charts for business management problem solving and data comparison using the ConceptDraw DIAGRAM diagramming and vector drawing software extended with the Bar Graphs Solution from the Graphs and Charts area of ConceptDraw Solition Park.
Picture: Bar Diagrams for Problem Solving.Create business management bar charts with Bar Graphs Solution
Related Solution:
This sample was created in ConceptDraw DIAGRAM diagramming and vector drawing software using the Seven Management and Planning Tools Solution from the Business Productivity area of ConceptDraw Solution Park.
This sample shows the Property Management matrix, the ideas are ordered in regards to importance and frequency. This matrix gives the ability to turn the theory into quantifiable data.
Picture: Property Management Examples
Related Solution:
