
Example 1. TOWS Matrix in ConceptDraw DIAGRAM /p>
SWOT and TOWS Matrix Diagrams Solution offers the extensive drawing tools, the set of templates and samples, and also SWOT Analysis library with variety of predesigned vector shapes for drawing SWOT and TOWS Matrix in a few minutes.

Example 2. SWOT Analysis Library Design Elements
The main purpose of TOWS analysis is to develop four groups of different strategies: SO Strategies, WO Strategies, ST Strategies, and WT Strategies.
So, TOWS Matrix is divided on four parts:
- Strengths - Opportunities
- Strengths - Threats
- Weakness - Opportunities
- Weaknesses - Threats

Example 3. TOWS Analysis Instructional Sample
This sample was created in ConceptDraw DIAGRAM using the tools of SWOT and TOWS Matrix Diagrams Solution. It shows the TOWS matrix developed for the instructional analysis. An experienced user spent 5 minutes creating this sample, you can open it from ConceptDraw STORE.
Use the SWOT and TOWS Matrix Diagrams Solution for ConceptDraw DIAGRAM software for quick, easy and effective TOWS matrix creating.
All source documents are vector graphic documents. They are available for reviewing, modifying, or converting to a variety of formats (PDF file, MS PowerPoint, MS Visio, and many other graphic formats) from the ConceptDraw STORE. The SWOT and TOWS Matrix Diagrams Solution is available for all ConceptDraw DIAGRAM or later users.
TEN RELATED HOW TO's:
ConceptDraw defines some map types, divided into three categories. Every map type has specific shapes and examples.
Picture: Types of Map - Overview
Related Solution:
Office design must to be well thought-out. It is especially important for the small offices, where each detail is in sight. ConceptDraw DIAGRAM software offers you the Office Layout Plans Solution from the Building Plans Area for quick and easy creating detailed Small Office Design plans.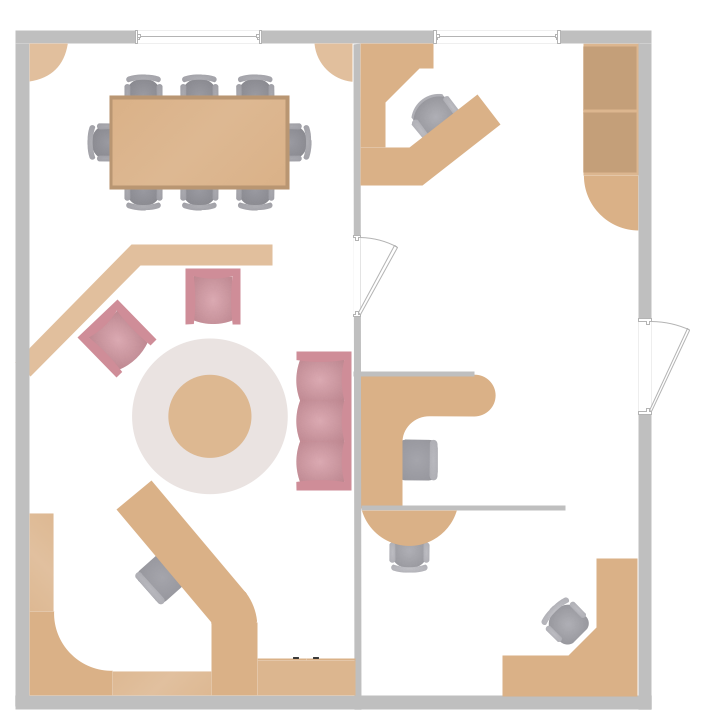
Picture: Small Office Design
Related Solution:
The Total Quality Management Diagram solution helps you and your organization visualize business and industrial processes. Create Total Quality Management diagrams for business process with ConceptDraw software.
Picture: Organizational Structure Total Quality Management
Related Solution:
ConceptDraw DIAGRAM is the world’s premier cross-platform business-diagramming tool. Many, who are looking for an alternative to Visio, are pleasantly surprised with how well they can integrate ConceptDraw DIAGRAM into their existing processes. With tens of thousands of template objects, and an easy method for importing vital custom objects from existing Visio documents, ConceptDraw DIAGRAM is a powerful tool for making extremely detailed diagrams, quickly and easily.
Picture: ConceptDraw DIAGRAM : Able to Leap Tall Buildings in a Single Bound
Related Solution:
What are the favorite educational technology tools and techniques for teachers? Of course these are pictures, images and education infographics! ConceptDraw DIAGRAM software supplied with Education Infographics Solution from the Business Infographics Area provides powerful drawing tools to help design the education infographics of any complexity.
Picture: Educational Technology Tools
Related Solution:
Easy charting software comes with beautiful chart templates and examples. This makes it easy to create professional charts without prior experience.
Picture: Chart Examples
Related Solutions:
Lean Six Sigma (LSS) is a well-known in all over the world methodology of quality improvement and business perfection. ConceptDraw DIAGRAM diagramming and vector drawing software is a powerful Lean Six Sigma Diagram Software thanks to the included Value Stream Mapping solution from the Quality Management Area of ConceptDraw Solution Park.
Picture: Lean Six Sigma Diagram Software
Related Solution:
This sample was created in ConceptDraw DIAGRAM diagramming and vector drawing software using the Bar Graphs Solution from Graphs and Charts area of ConceptDraw Solution Park. It is Bar Graphs example, Sales Growth example, Column Chart Example - Sales Report.
Picture: Sales Growth. Bar Graphs Example
Related Solution:
ConceptDraw DIAGRAM extended with Organizational Charts Solution from the Management Area is a powerful but easy-to-use Organizational Structure Diagram Software.
Organizational Charts Solution provides a wide variety of templates and samples and large quantity of predesigned vector objects to help you design your Organizational Structure Diagrams and other business diagrams.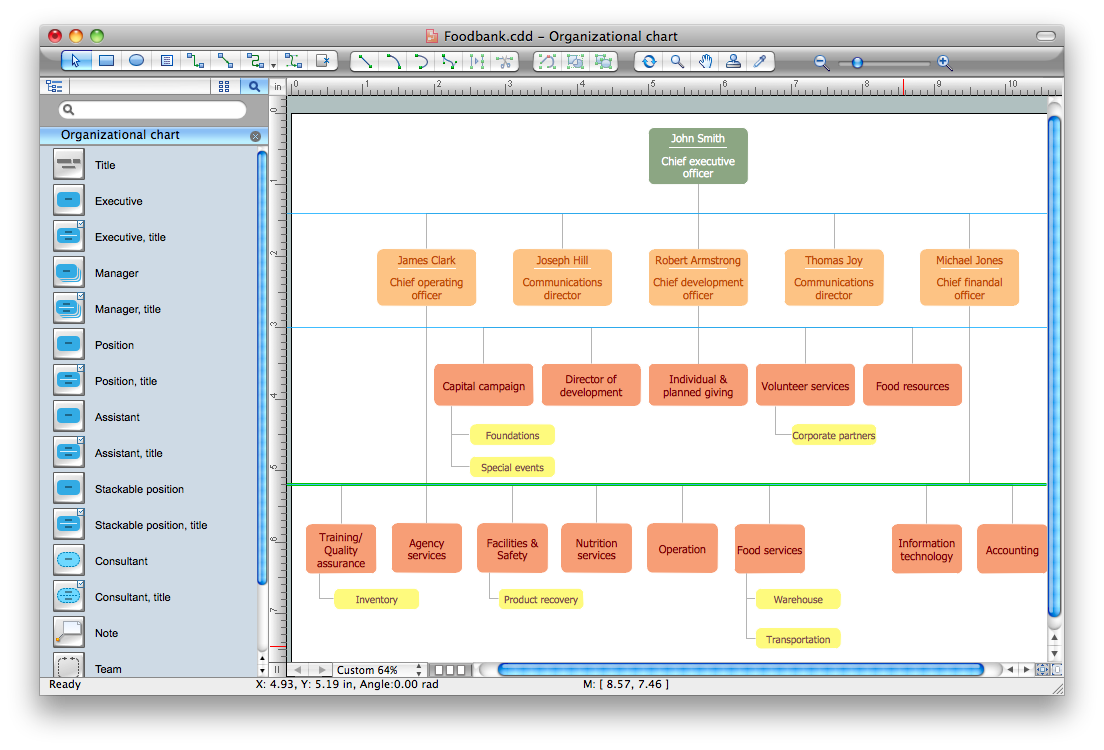
Picture: Organizational Structure Diagram Software
Related Solution:
While creating flowcharts and process flow diagrams, you should use special objects to define different statements, so anyone aware of flowcharts can get your scheme right. There is a short and an extended list of basic flowchart symbols and their meaning. Basic flowchart symbols include terminator objects, rectangles for describing steps of a process, diamonds representing appearing conditions and questions and parallelograms to show incoming data.
This diagram gives a general review of the standard symbols that are used when creating flowcharts and process flow diagrams. The practice of using a set of standard flowchart symbols was admitted in order to make flowcharts and other process flow diagrams created by any person properly understandable by other people. The flowchart symbols depict different kinds of actions and phases in a process. The sequence of the actions, and the relationships between them are shown by special lines and arrows. There are a large number of flowchart symbols. Which of them can be used in the particular diagram depends on its type. For instance, some symbols used in data flow diagrams usually are not used in the process flowcharts. Business process system use exactly these flowchart symbols.
Picture: Flowchart Symbols: Meaning and Examples
Related Solution:

