Entity Relationship Diagram - ERD - Software for Design
Crows Foot ER Diagrams
ER-model is used in a high-level (conceptual) design databases. You can use it to identify key entities and designate connections that can be established between these entities. During database design the ER model is converted into specific database scheme based on the selected data model (relational, objective, networking, or any other).
Crow's Foot notation was proposed by Gordon Everest, originally called Inverted Arrow. According to this notation, the entity is represented by rectangle containing its name. Name of the entity must be unique within this model. In this case, the name of the entity is a name of type, rather than a specific instance of this type. A concrete representative of the entity is called by the entity instance.
The entity attributes are written inside the rectangle depicting entity. Among the attributes is also highlighted the entity key - the set of attributes the values of which in aggregate are unique for each instance of the entity.
Relation is depicted by line which ties two entities involved in a relationship. The plurality of the relationship is indicated graphically by a "plug" on the end of the link. Optionality of a link is marked by a circle at the end of the link.
Entity-relationship diagrams based on both Chen's and Crow's Foot notations, can be easily drawn using the ConceptDraw DIAGRAM ERD diagrams software tools for design element Crow's Foot and Chen from Entity-Relationship Diagram (ERD) solution.
ERD Crow's Foot library from Entity-Relationship Diagram (ERD) solution contains 17 Crow's Foot notation symbols.

Example 1. Crow's Foot notation symbols
The shapes which include circles, bars, and symbols, indicate various possibilities. A single bar at Crows foot notation indicates one, a double bar indicates one and only one, a circle indicates zero, and a crow's foot indicates many.
Entity Relationship Diagrams (ERD) illustrates the logical structure of databases. The vector graphic diagrams produced when using the ConceptDraw ERD solution can be successfully used in whitepapers, presentations, datasheets, posters, or any technical materials.
_Win_Mac.png)
Example 2. Entity Relationship Diagram Software
Design Elements — Crow's Foot (Windows, Macintosh).
The samples you see on this page were created in ConceptDraw DIAGRAM software in macOS and Windows using the Entity-Relationship Diagram (ERD) solution and show the ER Diagrams created with Crow's Foot notation. An experienced user spent 10 minutes creating each of these samples.
Use the Entity-Relationship Diagram (ERD) Solution for ConceptDraw DIAGRAM to create quick and easy your own Entity-Relationship Diagrams using the Crow's Foot and Chen's notations.
 solution")
Example 3. Entity-Relationship (ERD) Diagram Solution
All source documents are vector graphic documents. They are available for reviewing, modifying, or converting to a variety of formats (PDF file, MS PowerPoint, MS Visio, and many other graphic formats) from the ConceptDraw STORE. The Entity-Relationship Diagram (ERD) Solution is available for all ConceptDraw DIAGRAM users.
TEN RELATED HOW TO's:
The world-best Entity Relationship Diagram software suitable for professional ERD drawing is ConceptDraw DIAGRAM software extended with the Entity-Relationship Diagram (ERD) solution. This solution contains all libraries, templates and samples you may need for professional ERD drawing.
Picture: Entity Relationship Diagram Software
Related Solution:
It is easy to recreate any informational system structure using diagrams. There are three main components of any ER diagram: entity, attribute and relationship. Basing on these three components, one can define other, less used elements, such as weak entity or relationship, derived attribute, recursive relationship etc.
This is the set of graphic elements of ERD Chen's notation. This ERD notation is used to represent an entity–relationship models. It involves the set of geometric forms: rectangles - depicting entities, ovals - representing attributes and diamonds depicting relationships assigned for first-class objects, that can have relationships and attributes of their own. Connections are displayed with arrowed lines. It is known that the Chen's ERD notation is used to show a detailed view of entities and relationships. ConceptDraw Entity-Relationship Diagram solution from the Software Development section of Solution Park provides the ability to create ERD of database structure for software development purposes using the Chen’s notation elements.
Picture: Components of ER Diagram
Related Solution:
UML Use Case Diagrams are used to illustrate the structure of arbitrarily complex systems and illustrates the service consumer - service provider relationship between components.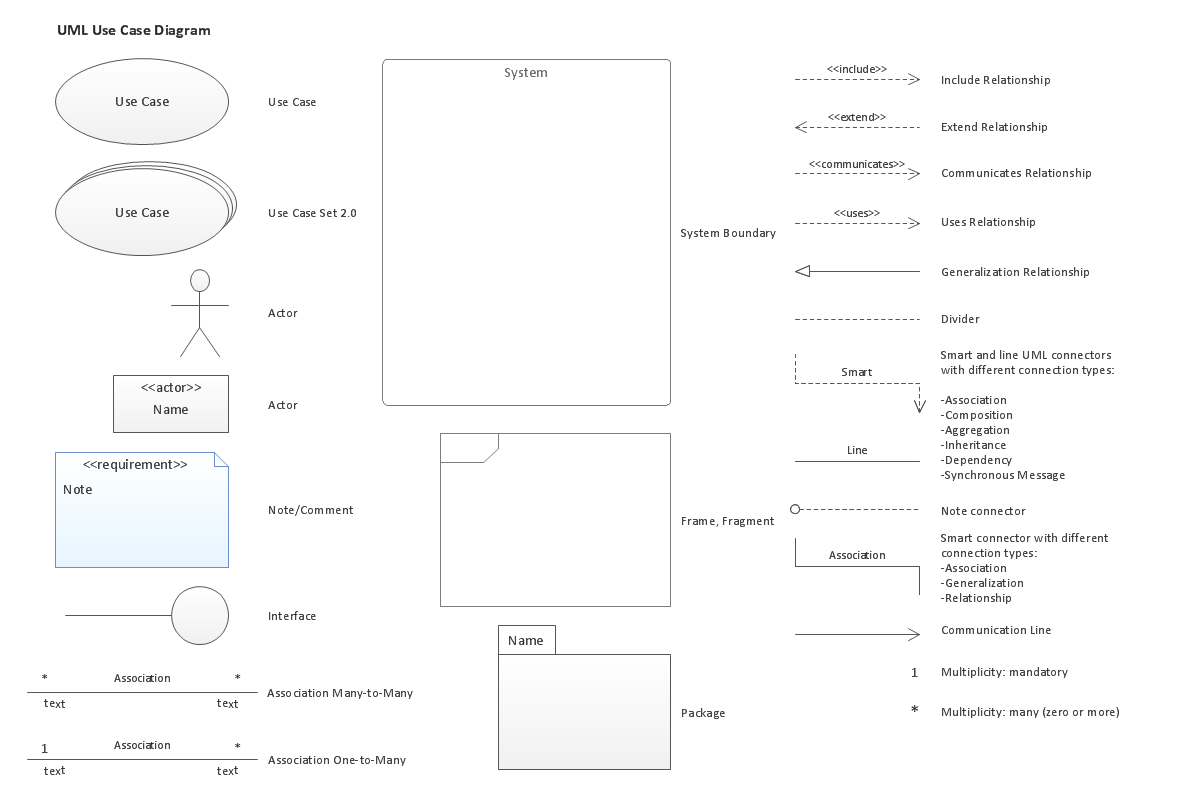
Picture: UML Use Case Diagram. Design Elements
ConceptDraw Network Diagram Software is ideal for network engineers and network designers who need to draw Physical Network Diagrams.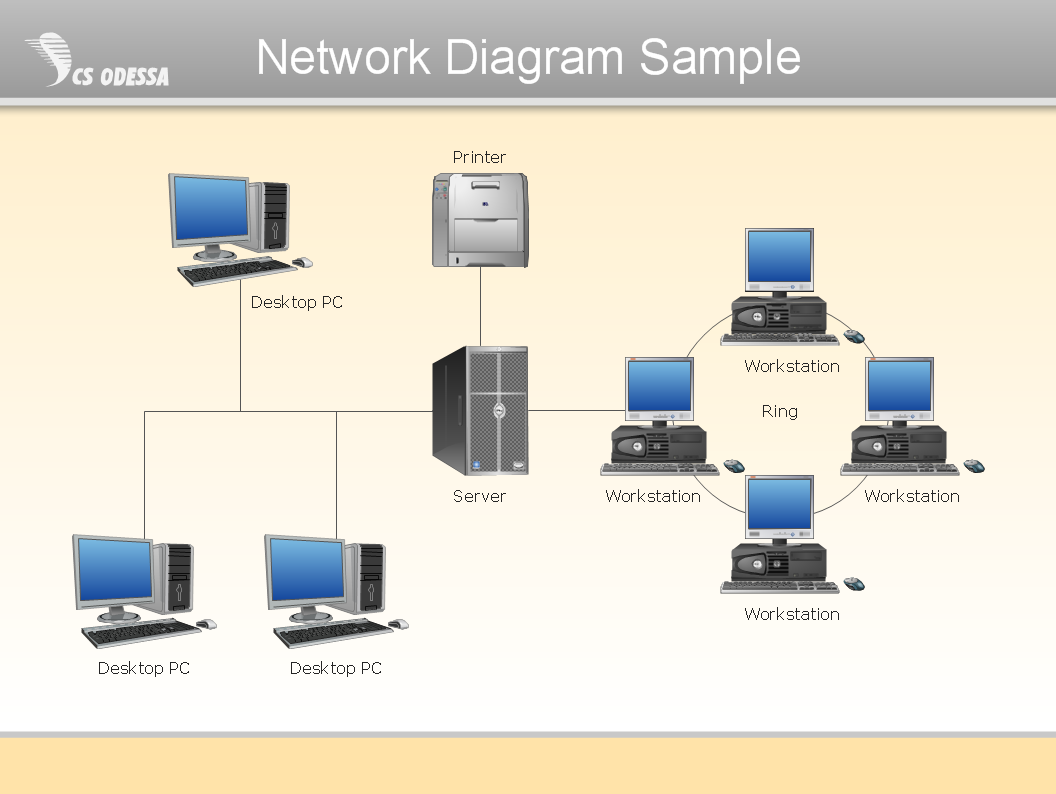
Picture: Network Diagram SoftwarePhysical Network Diagram
Why do you need network visualizations? 🔸 Unlock the full potential of network visualization with our in-depth guide on using the ConceptDraw Network Visualization Tool. ✔️ Explore features, tips, and best practices to create stunning visual representations of your network architecture
Picture:
Network Visualization Guide.
How to Use ConceptDraw Network Visualization Tool
Related Solutions:
State Diagram UML of Online Store. This sample was created in ConceptDraw DIAGRAM diagramming and vector drawing software using the UML Class Diagram library of the Rapid UML Solution from the Software Development area of ConceptDraw Solution Park.
This sample shows the work of the medical shop and is used at the creation of the medical shop or pharmacy project, for understanding the process of shopping in the medical shop, for keeping purchases, for medical supplies.
Picture: UML Class Diagram Example - Medical Shop
Related Solution:
The use case diagram (behavior scenarios, precedents) is the initial conceptual representation of the system during its design and development. This diagram consists of actors, use cases and relationships between them. When constructing a diagram, common notation elements can also be used: notes and extension mechanisms.
This sample was created in ConceptDraw DIAGRAM diagramming and vector drawing software using the UML Use Case Diagram library of the Rapid UML Solution from the Software Development area of ConceptDraw Solution Park.
This sample shows the types of user’s interactions with the system and is used at the registration and working with the database system.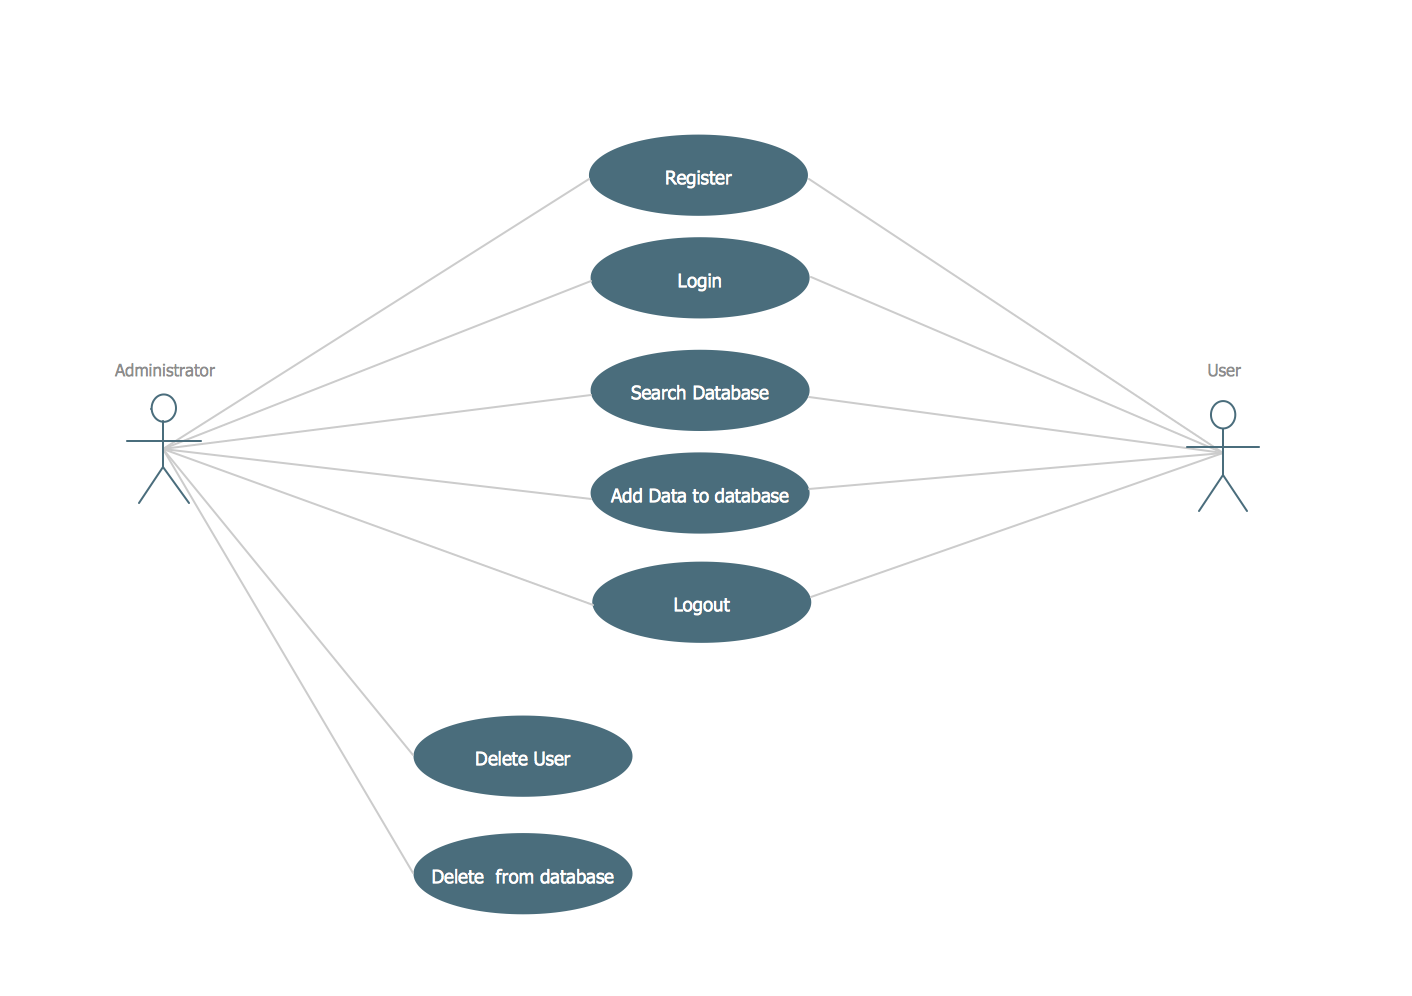
Picture: UML Use Case Diagram Example. Registration System
Related Solution:
The most easier way of creating the visually engaging and informative Sales Process Flowchart is to create the new ConceptDraw document and to use the predesigned vector symbols offered in 6 libraries of the Sales Flowchart Solution. There are more than six types of sales process flow diagrams, ConceptDraw DIAGRAM software is flowchart maker which include six collections of extended flowchart symbols for effective diagramming. There are main collections of color coded flowchart symbols: Sales Department, Sales Steps, Sales Workflow, Sales Symbols and special set of Sales Arrows and Sales Flowchart.
Picture: Sales Process Flowchart Symbols
Related Solution:
It’s very important that your soccer drawing looked beautiful, interesting and attracted the attention. For this it is necessary add the illustrations! The Soccer solution delivers several libraries with predesigned bright and interesting clipart objects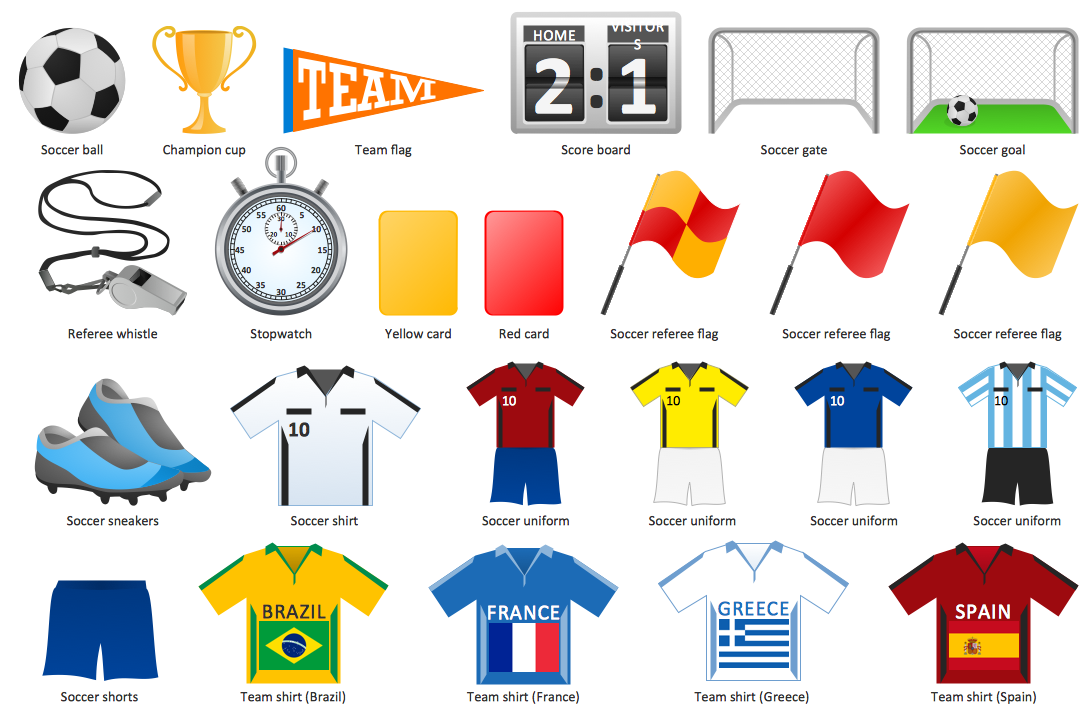
Picture: Soccer (Football) Illustrated
Related Solution:
A network diagram represents the set of computers and network devices and the connections among them. This scheme can be developed for any institution or establishment. To illustrate this concept let’s take for example, a hotel network topology diagram or a school network diagram. These diagrams depict access points, servers, workstations, firewalls and another equipment needed to provide a network.
On this masterpiece drawing one will see a simple scheme a of connecting computers together. Such form of connecting can be applied for a hotel, guest house, bungalow, hut or something else. This diagram shows the images of the real LAN components. So, it represents a physical category of a network construction. It looks similar to a star - so this network configuration is named a star topology. The typical feature of this construction is a center point - usually it is hub, or router. The rays of this star means network connections. Computers, peripherals and other network details are placed on the ends of the star rays.
Picture: Hotel Network Topology Diagram
Related Solution:

 solution")