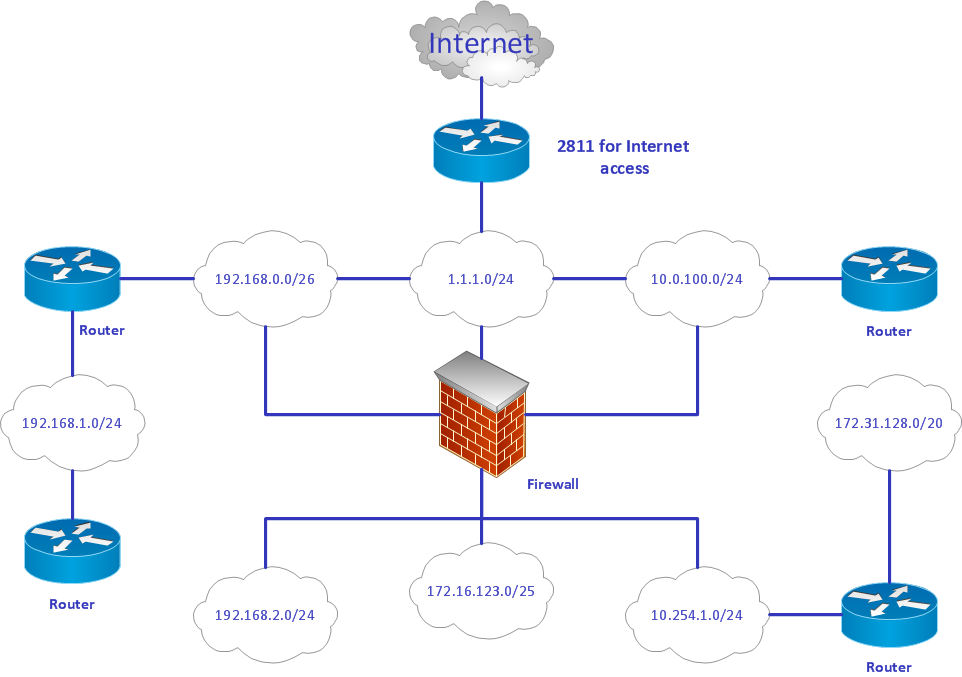
Sample 1. Logical network diagram.
ConceptDraw DIAGRAM diagramming software provides vector shapes and connector tools for quick and easy drawing diagrams for business, technology, science and education.
Use ConceptDraw DIAGRAM enhanced with solutions from ConceptDraw Solution Park to create diagrams to present and explain structures, process flows, logical relationships, networks, design schemes and other visually organized information and knowledge.
TEN RELATED HOW TO's:
No security system cannot be constructed without detailed security plan, or even a set of plans in some cases. ConceptDraw DIAGRAM software offers the Security and Access Plans Solution from the Building Plans Area to help you design the Security Plans for any premises and of any complexity.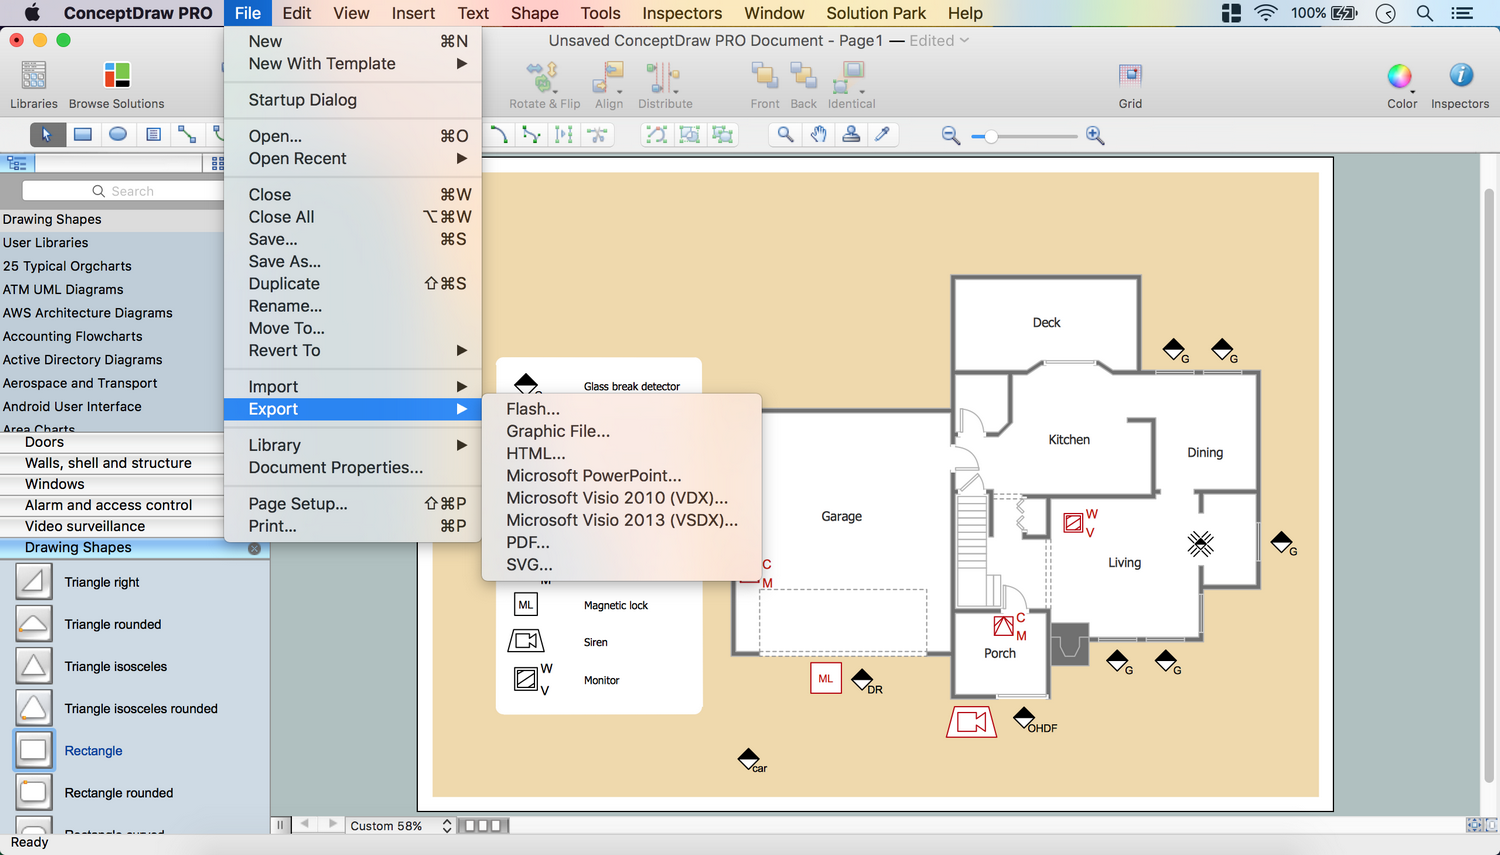
Picture: Security Plans
Related Solution:
Critical information from your mindmaps can be accessed from almost any device using ConceptDraw MINDMAP and Evernote.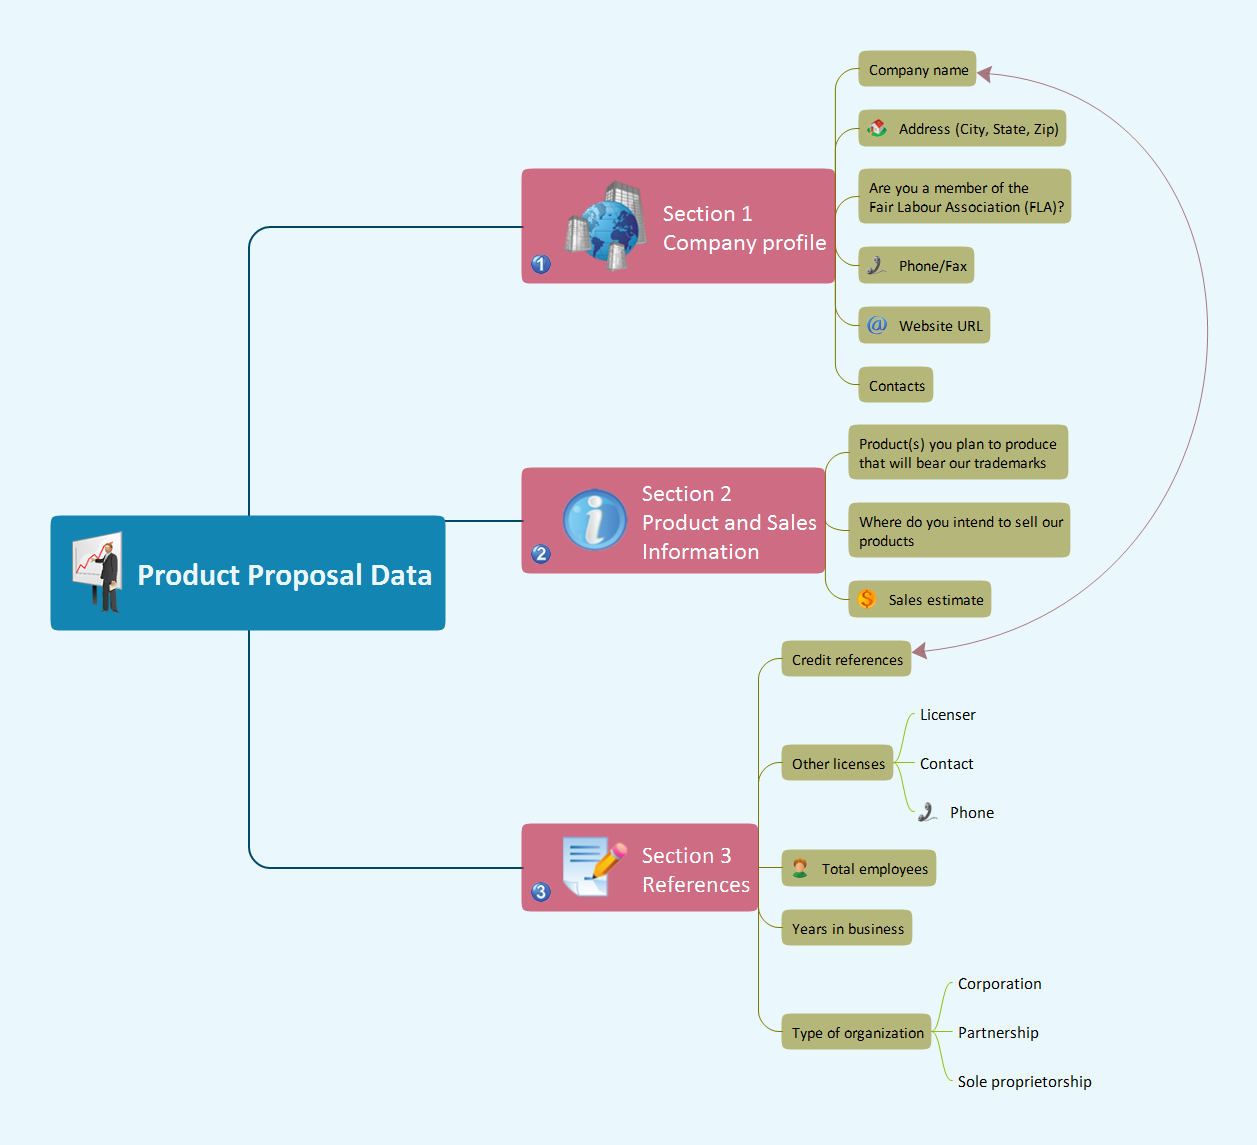
Picture: Gather Requirements Exchanging Mind Maps with Evernote
Related Solution:
Learn about Virtual Private Networks (VPNs), and how they work, exploring VPN Networks with diagrams. ✔️ How to create VPN flowcharts using the ConceptDraw DIAGRAM software?
Picture:
What is a Virtual Private Network?
VPN Diagram Examples
Related Solution:
Wireless Networks solution from ConceptDraw Solution Park extends ConceptDraw DIAGRAM diagramming and vector drawing software to help network engineers and designers efficiently design, create and illustrate WAN network diagram of any complexity. The ConceptDraw DIAGRAM software helps users to quickly transit from an idea to the implementation of a Wireless Network WAN
Picture: Wireless Network WAN
Related Solution:
ConceptDraw DIAGRAM is a powerful tool for business and technical diagramming.
Software Development area of ConceptDraw Solution Park provides 5 solutions:
Data Flow Diagrams, Entity-Relationship Diagram (ERD), Graphic User Interface, IDEFO Diagrams, Rapid UML.
Picture: Software Diagram Examples and Templates
Related Solution:
Automatically create a presentation-quality diagram in one click with ConceptDraw DIAGRAM.
Picture: Visual Presentations Made Easy with Diagramming Software
Related Solution:
Working with information can be quite tedious, furthermore, some data can be quite difficult to perceive without any graphic representation. So, to facilitate your work, you can use business diagrams, such as simple flowcharts or Gantt charts for project management and orgcharts for clarifying your company structure. You can use a proper software, like ConceptDraw Pro, draw them on paper, or use whiteboards, but it is more convenient to use a digital tool.
This diagram shows a cross-functional flowchart that was made fore telecom service provider. A workflow of a common telecommunication service provider has a rather branched structure. Thus, it is useful to have a flow chart to visualize the sequences and interrelations of the work flow steps. Business process flowchart contains 17 processes and 4 decision points,that are distributed through 2 lines depicting the participants involved. Also there are connectors that show the data flow within processes. This flowchart displays a detailed model of the telecom service trading process, as well as all participants in the process and how they interact with each other.
Picture: Business diagrams & Org Charts with ConceptDraw DIAGRAM
ConceptDraw DIAGRAM diagramming and vector drawing software extended with tools of Flowcharts Solution from the Diagrams Area of ConceptDraw Solution Park ideally suits for fast and easy Online Flow Chart designing. We propose to verify this right now.
Picture: Online Flow Chart
Related Solution:
Bar charts represent data in different categories or groups.
Create bar graphs for visual solving your scientific problems and data comparison using the ConceptDraw DIAGRAM diagramming and vector drawing software extended with the Bar Graphs Solution from the Graphs and Charts area of ConceptDraw Solition Park.
Picture: Bar Diagrams for Problem Solving.Create space science bar charts with Bar Graphs Solution
Related Solution:
ConceptDraw DIAGRAM is the best network diagram software. To design the Cisco Network Diagrams and visualize the computer networks topology use ConceptDraw DIAGRAM diagramming and vector drawing software extended with Cisco Network Diagrams solution for ConceptDraw DIAGRAM Solution Park.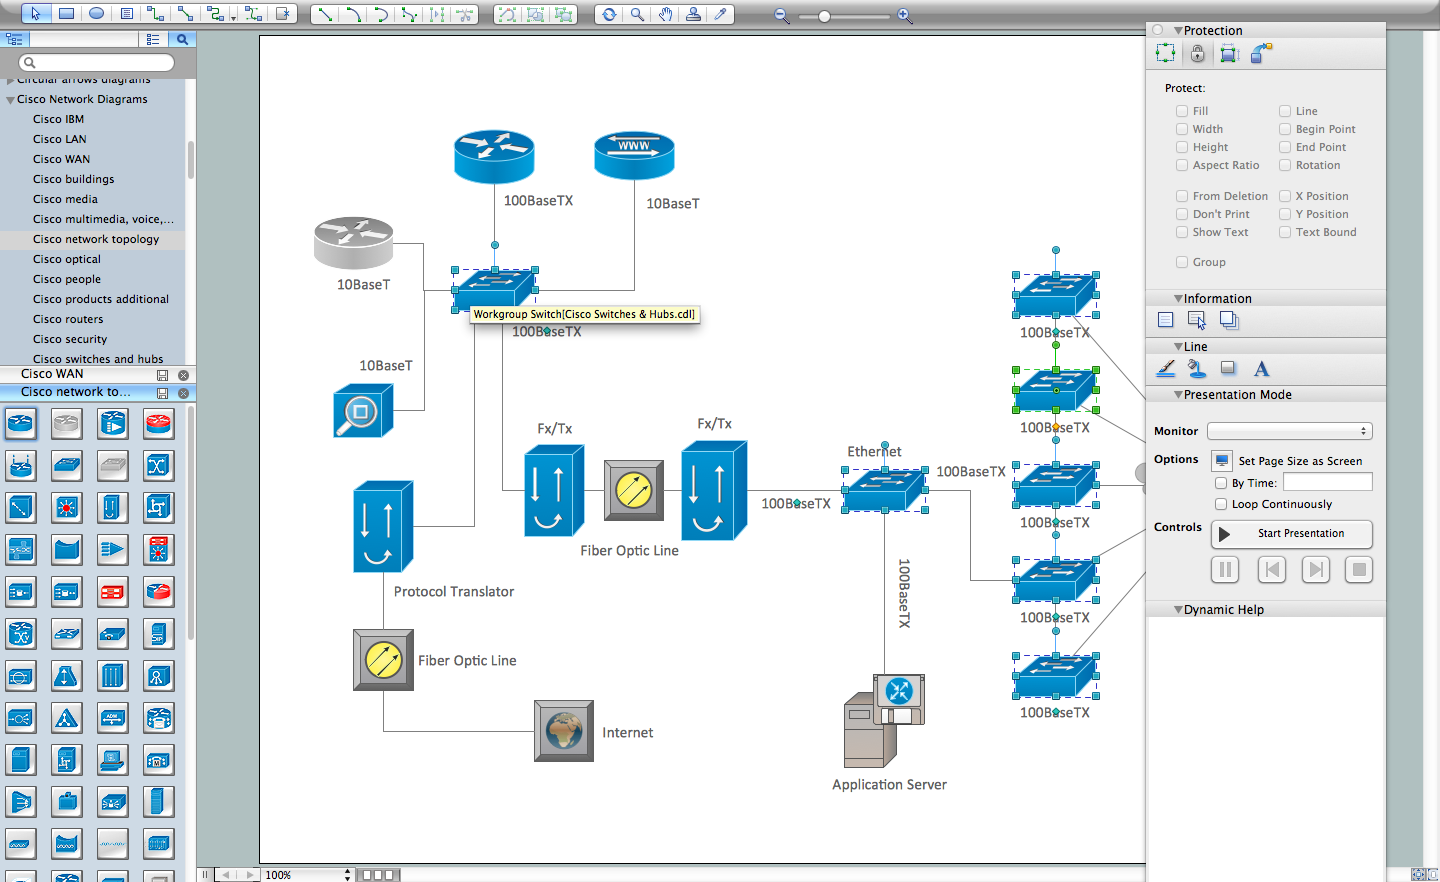
Picture: Cisco Network Diagram Software
Related Solution: