Security Plans
A security alarm protects various property objects from unauthorized entry. Such system can be used in all types of buildings including private houses and apartments, state buildings, commercial and military objects. Security alarm system ensures your personal safety and protection of your belongings against burglary. When installed in cars, these systems are used against car thefts and carjacking. Also, a security alarm is used in prisons and high security facilities.
These alarm systems can have either one function (e.g. burglary protection) or combine fire and intrusion detection. Intrusion alarm system often works together with closed-circuit television surveillance systems when the process of unauthorized entry is automatically recorded. Systems vary from compact audio alarms to sophisticated computerized systems that can cover a vast area.
No security system cannot be constructed without detailed security plan, or even a set of plans in some cases. ConceptDraw DIAGRAM software offers the Security and Access Plans Solution from the Building Plans Area to help you design the Security Plans for any premises and of any complexity.
Security plans are very convenient way to explain what result you want to get. Security and Access Plans Solution provides 3 libraries:
- Alarm and Access Control
- Initiation and Annunciation
- Video Surveillance
with wide variety of vector shapes to help you draw your security plans in minutes.
How To Create Security Plan
- Launch ConceptDraw DIAGRAM
- Set a page orientation: File – Page Setup – Horizontal Orientation – Ok.

- First layer “Floor Plan”:
- Open the Layers tab in Inspectors. Double click on the layer – Change name.

- In the Floor Plans Solution open the libraries containing the necessary shapes:
- Doors
- Walls, shell and structure
- Windows

- Using the necessary objects, create a floor plan.

- To change the walls’ color, select the walls – open the Fill tab in Inspectors – choose the color.

- Double click on the white space of the page – enter your text – move the Text box to the needed part of the Floor Plan.

- To edit the text, select it and open the Text tab in Inspectors.

- Second Layer “CCTV Plan”:
- Inspector – Layers tab: Select another layer for the next part of the drawing.
- Lock the previous layer.

- In the Security and Access Plans Solution open the libraries containing the necessary shapes:
- Alarm and access control
- Video surveillance

- At the Video surveillance library take a Monitor object.

- Right click on the object – Custom Properties.

- Set the Type and the Value of the object:
- Type: String
- Value: W- Wall

- Using the necessary objects from the library, place them on the floor plan.

- To make objects same size:
- Select all the objects – Shape Menu on the Toolbar – Make Same – Size.

- To change the lines and text color, open Inspectors – Line tab, Text tab.

- Third Layer “Legend”:
- Inspector – Layers tab: Select another layer for the next part of the drawing.
- Lock the previous layer.

- Arrange all the objects in a column.
- Select all objects – choose Align function on the Toolbar – Align Center.

- Group all selected objects using Cmd+G or Shape menu – Group.

- Resize the group using the control dots.
- the objects: Shape menu – Ungroup or Cmd+U.
- Double click on the white space of the page – enter the objects’ names.

- Select the text boxes – Align Left using Align function on the Toolbar.

- Make the same distance between the text boxes using Distribute option on the Toolbar.

- Align the text boxes and the objects using Align function on the Toolbar.

- To make a background for the Legend, choose Rounded Rectangle at the Drawing Shapes library.

- Using control dots, make it slightly bigger than the text boxes and the objects together.
- Right click on the Rectangle – Object – Send to Back.

- The fourth Layer “Background”:
- Inspectors – Layers tab – Add a New Layer using plus icon (+).
- Lock the previous layer.

- Take Rectangle at the Drawing Shapes library. Using control dots, set the size of the object same as the page size.
- Open Inspectors – Line tab – deselect Stroke.

- Open the Fill tab – Color – Color Sliders – Make your color.

- Right click on the Rectangle – Object – Send to Back.

- From the File menu open the Document Properties – Page Size – Adjust to Drawing Contents – Ok.

- Now your drawing is ready!
- You may save it or export to different formats via the File menu.
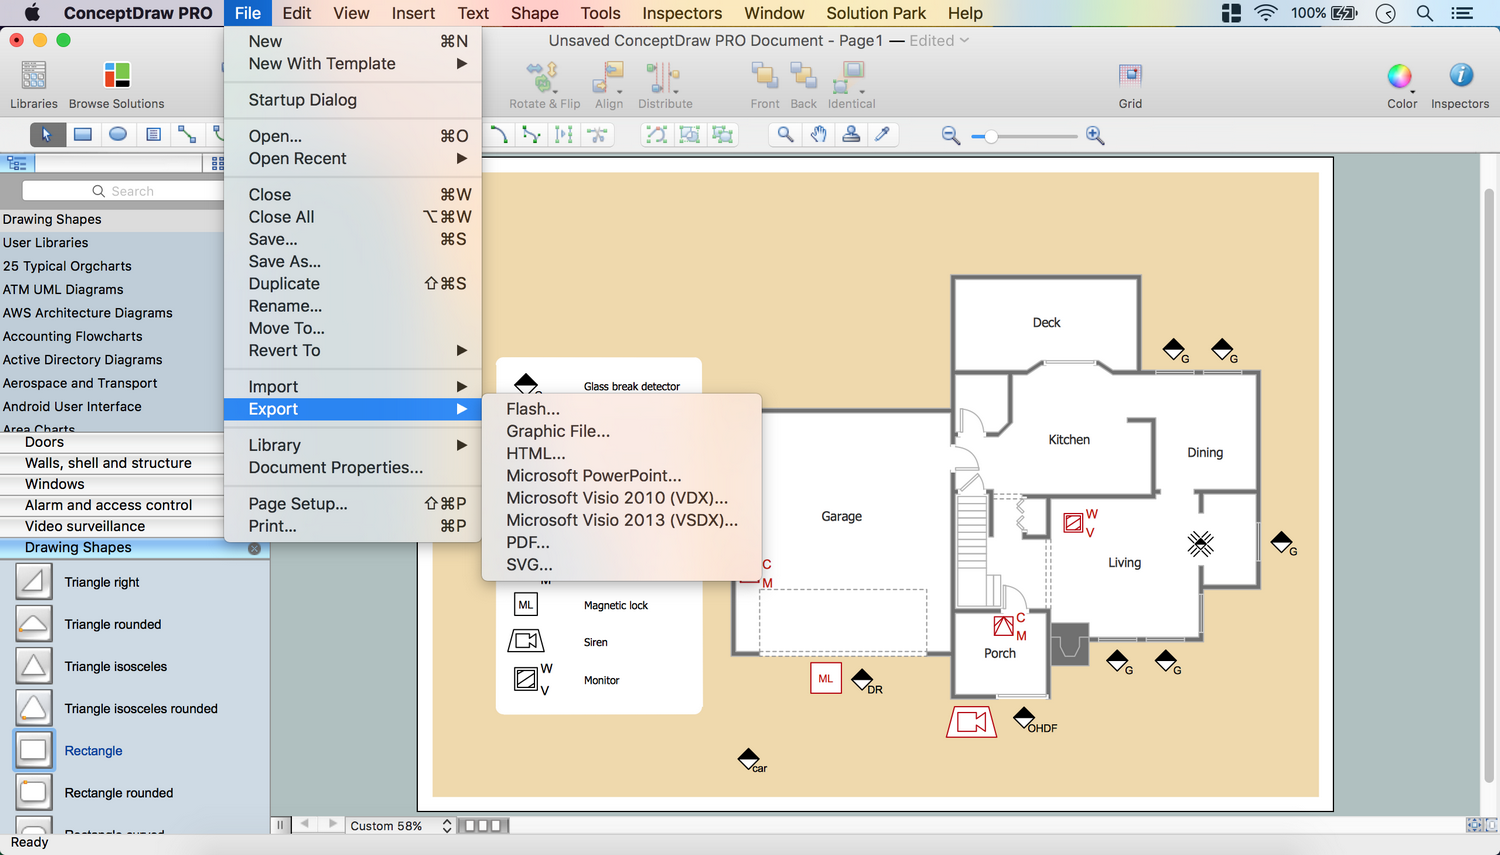
The possibility of exporting to variety of popular graphical formats (PNG, JPEG, JPG, GIF, TIF, TIFF, BMP, DIB, EMF, SVG) and file formats, such as Microsoft PowerPoint (PPT), Adobe Acrobat (PDF), Microsoft Visio (VDX, VSDX), Adobe Flash (SWF), Encapsulated PostScript (EPS), HTML, opens wide opportunities for you.
Video. How To Create CCTV Network Diagram (2min 29sec)
TEN RELATED HOW TO's:The following examples cctv network were created in ConceptDraw DIAGRAM diagramming and vector drawing software using the Audio, Video, Media Solution. Using this easily customizable cctv network template you can represent any existing cctv network.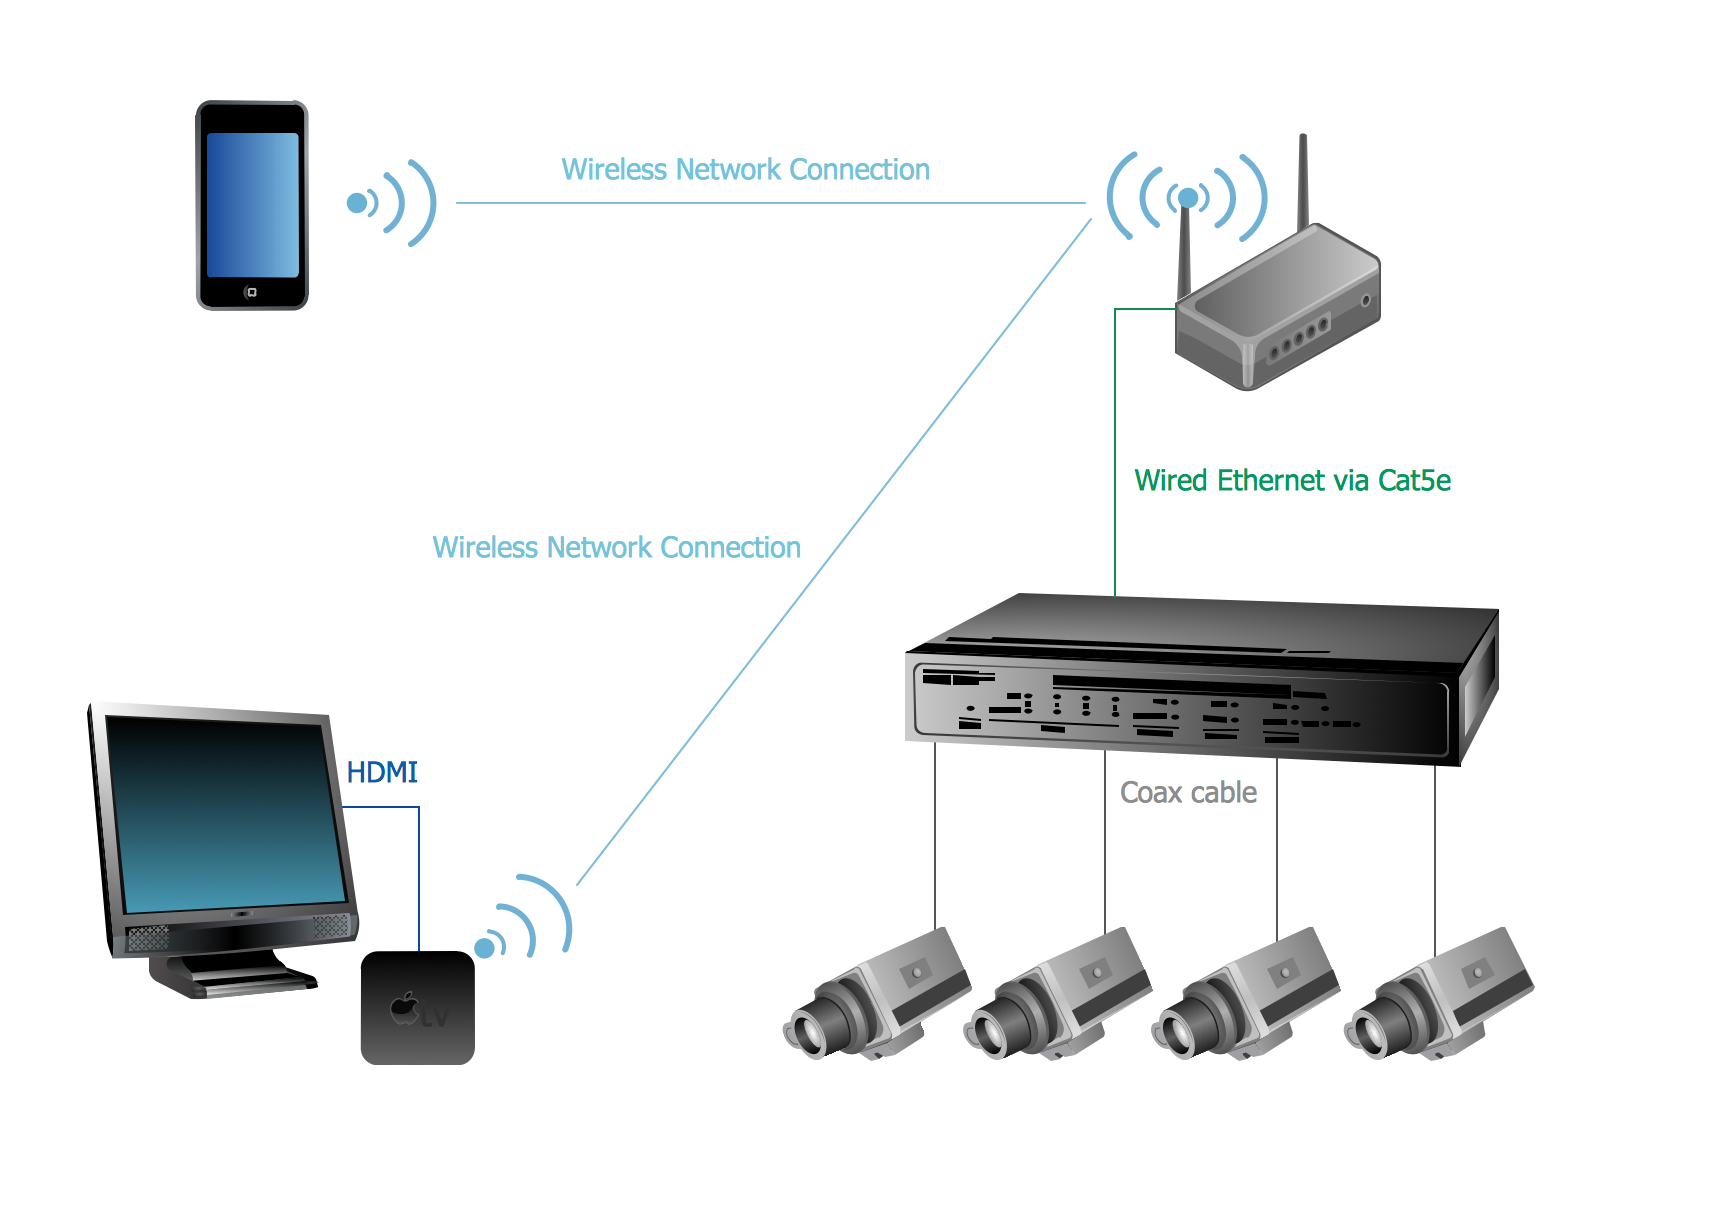 Picture: CCTV Network ExampleRelated Solutions:This sample was created in ConceptDraw DIAGRAM diagramming and vector drawing software using the Computer and Networks solution from Computer and Networks area of ConceptDraw Solution Park. A Daisy Chain is the simple computer network. It is the easiest way to add more Ethernet devices into the network. In the Daisy Chain network one computer is connected to the next without any intervening devices, thus the message is sent from one computer to the next and then to the next and so on. A Daisy Chain can be linear or ring
 Picture: Daisy Chain Network TopologyRelated Solution:This sample was created in ConceptDraw DIAGRAM diagramming and vector drawing software using the Organizational Charts Solution from the Software Development area of ConceptDraw Solution Park. This sample shows the organizational chart in the field of Architect Engineering. Create your own orgchart professional drawings using ConceptDraw.
 Picture: Business Board Org ChartRelated Solution:ConceptDraw DIAGRAM enhanced with Audio, Video, Media solution is a helpful tool for illustration of a CCTV network. It contains library of vector cliparts of video and TV devices and different digital gadgets for drawing such illustrations
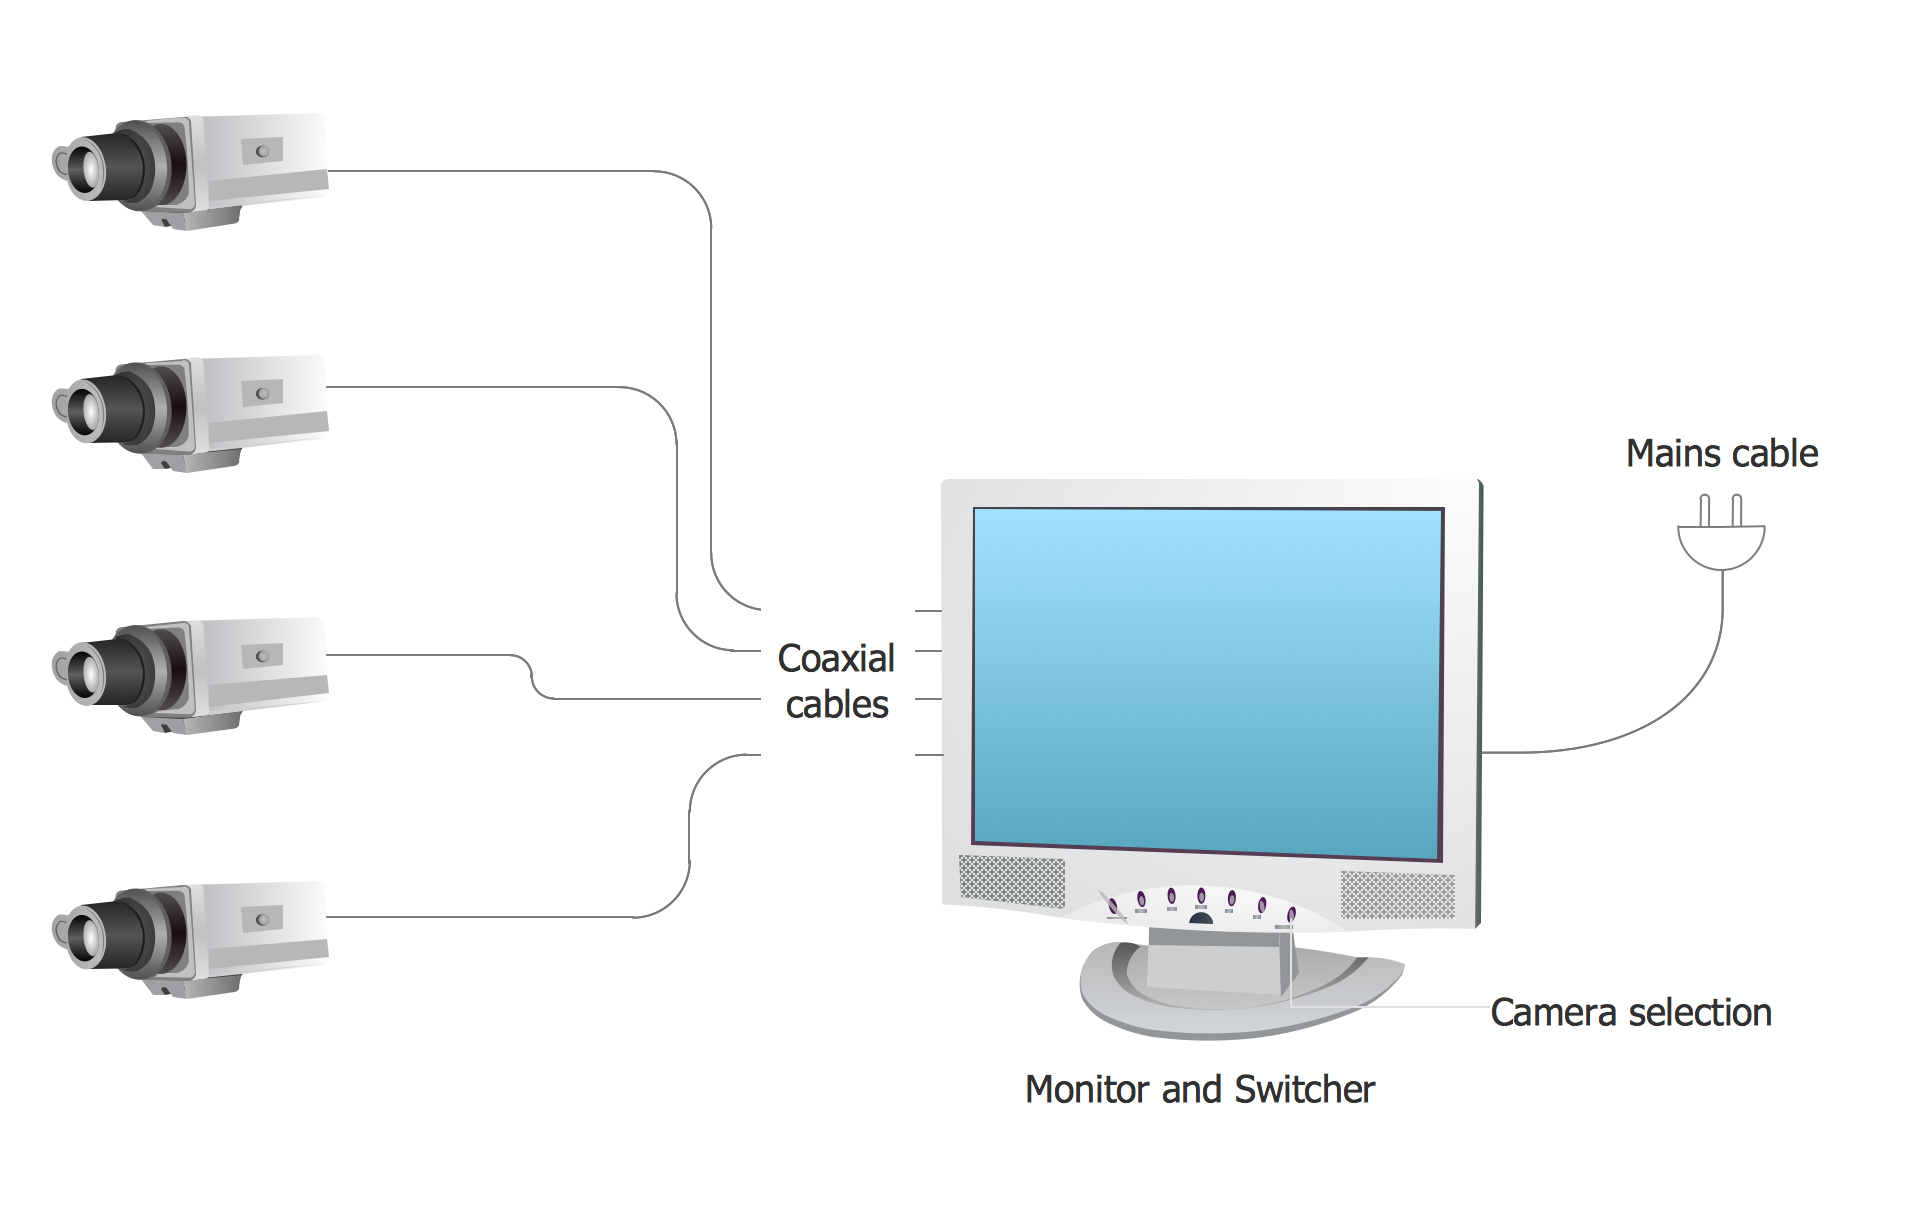 Picture: Basic CCTV System Diagram. CCTV Network Diagram ExampleRelated Solutions:The Ring Network Topology Diagram examples was created using ConceptDraw DIAGRAM software with Computer and Networks solution.
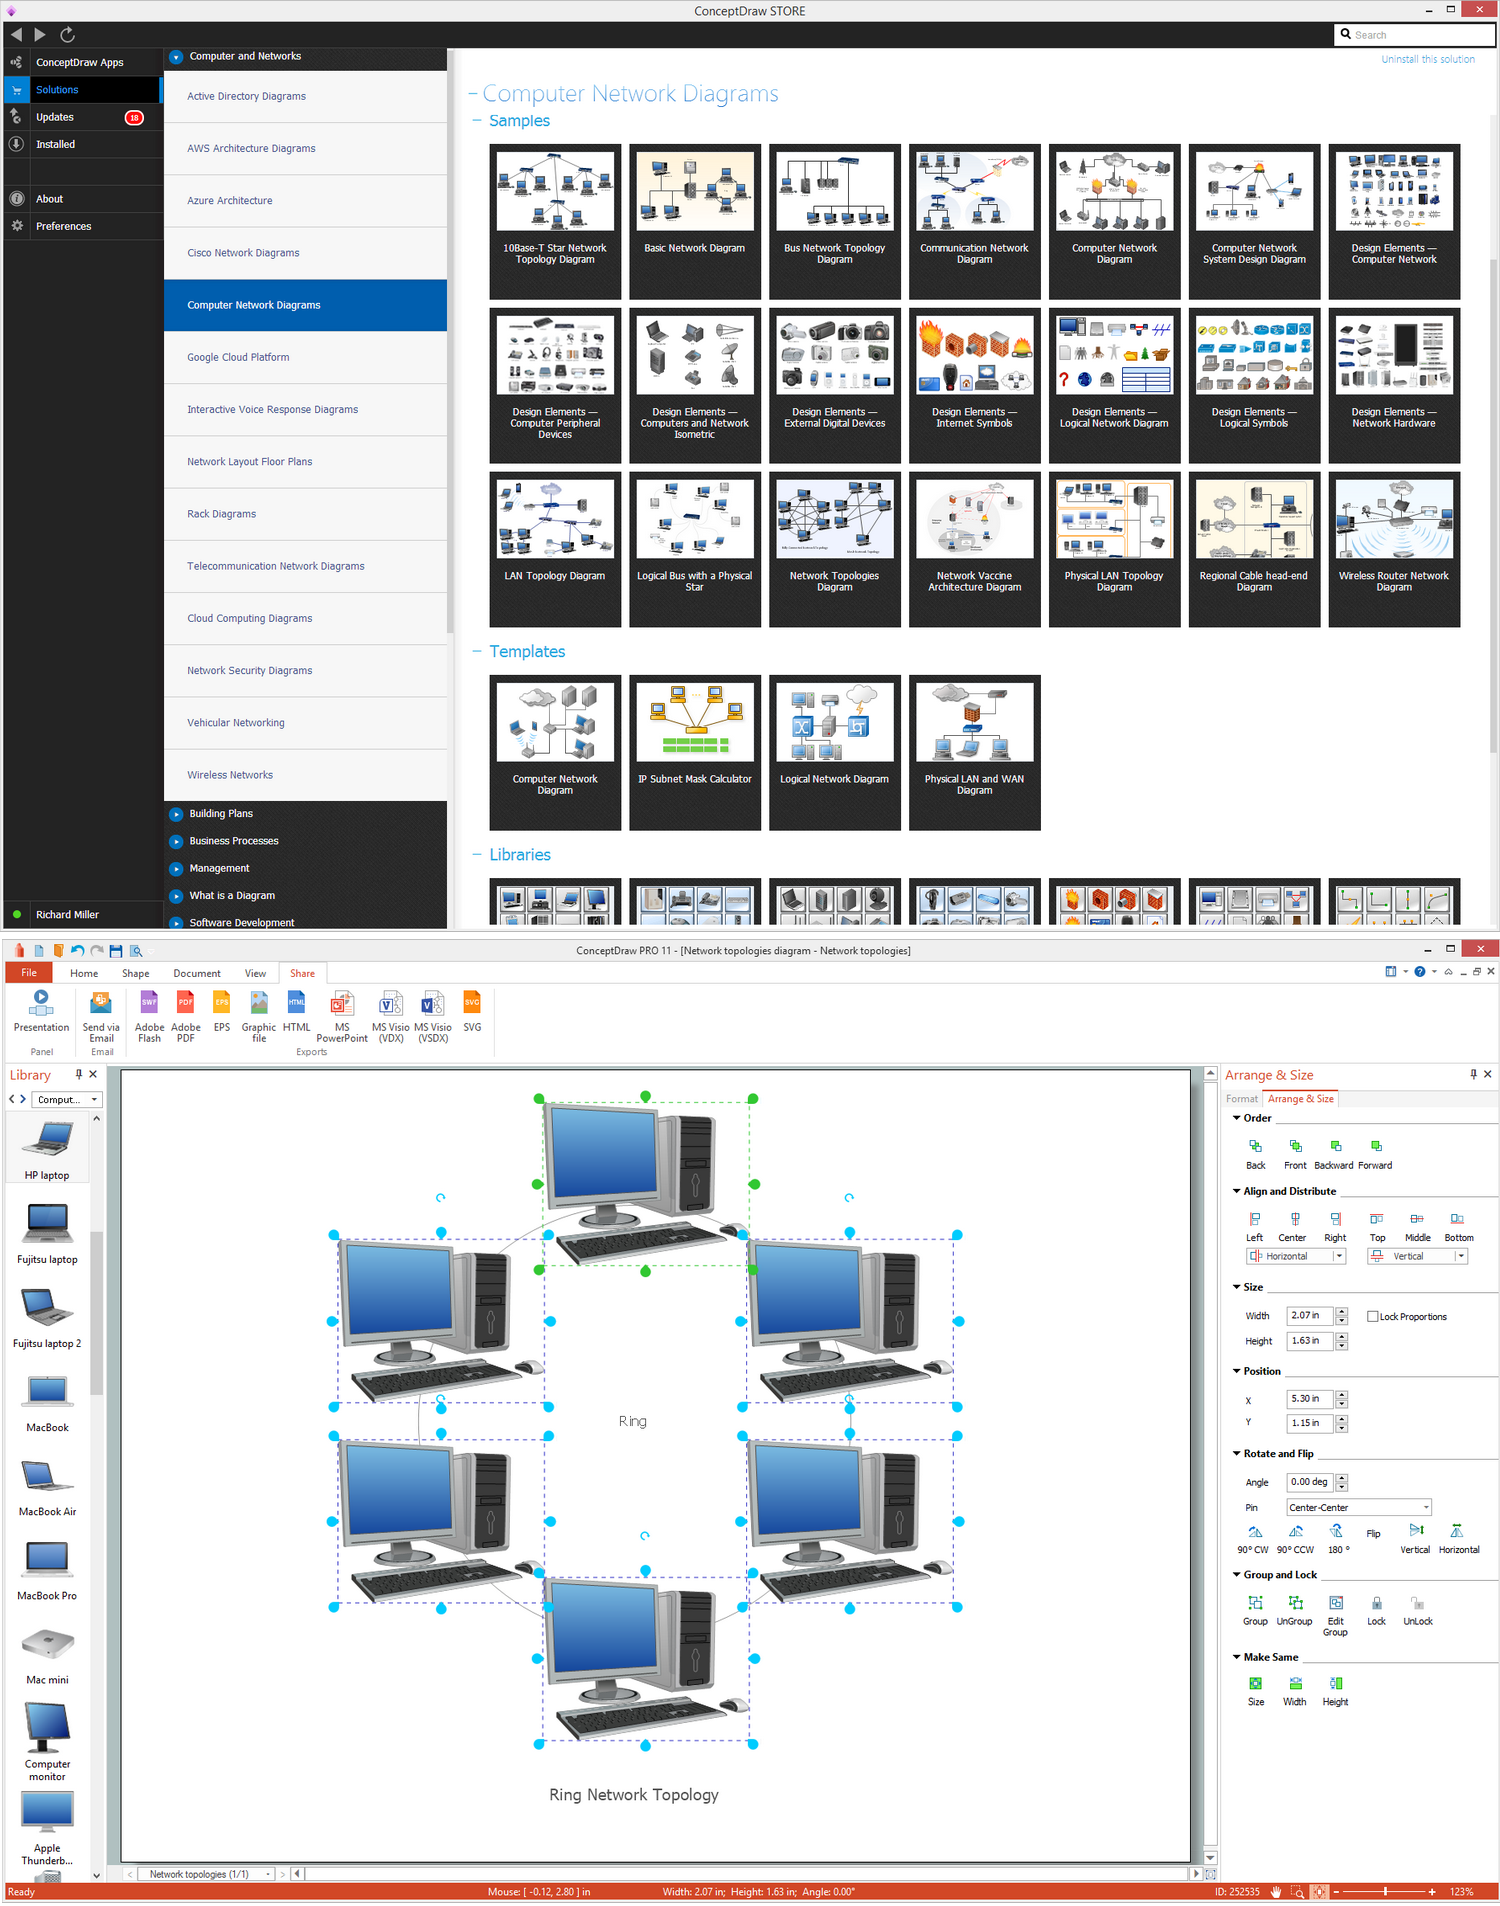 Picture: Ring Network TopologyRelated Solution:This sample was created in ConceptDraw DIAGRAM diagramming and vector drawing software using the Computer and Networks solution from Computer and Networks area of ConceptDraw Solution Park. A communication network topology is defined by the evaluating costs of the states. Each state represents the possible distribution of the hubs and remote nodes to nodes of the communication network.
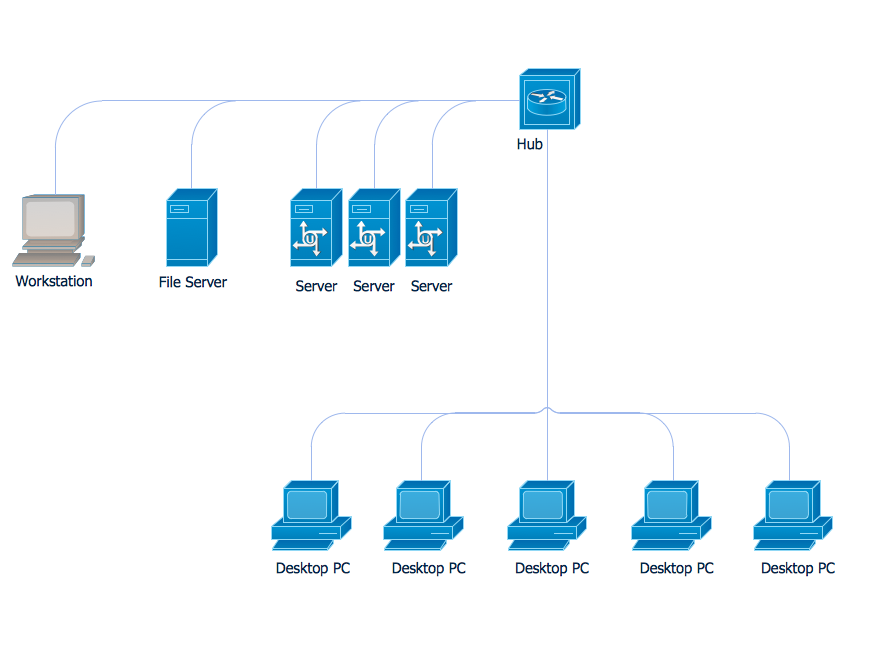 Picture: Communication Network TopologyRelated Solution:Network Security Architecture Diagram visually reflects the network's structure and construction, and all actions undertaken for ensuring the network security which can be executed with help of software resources and hardware devices. You dream to find powerful software for easy designing Network Security Architecture Diagram? We recommend to use ConceptDraw DIAGRAM extended with Network Security Diagrams Solution from the Computer and Networks Area of ConceptDraw Solution Park.
 Picture: Network Security Architecture DiagramRelated Solution:Event-Driven Process Chain Diagrams for improvement throughout an organisation. ConceptDraw DIAGRAM - software that reduces the time needed to create a business process model.
 Picture: Modelling Complex Events with Event-Driven Process chainRelated Solution:As restaurant industry is growing rapidly nowadays, researches show that almost half of the adults have worked in a restaurant or a cafe. Moreover, many of them dream to start their own someday. Unfortunately, it takes a lot of time to write a business plan and to find a great location, although some know how to create a restaurant floor plan in minutes or how to plan budget effortlessly. Hiring employees can also cause a lot of headache, but this is crucial for further success, because every guest comes to restaurant for a good service and delicious food. It is also worth noting that restaurant concept is also important, because it defines target audience and influences the menu. This diagram represents the floor plan of an ongoing sports-theme establishment - restaurant, cafe, or other food service. A number of widescreen monitors installed along the perimeter provide visitors the opportunity to follow the course of a match from anywhere in the dining room of restaurant or cafe. The most of sports fans believe that food and alcohol is a big part of any sports show. That is why the dining room takes the most space - almost 60% of the total establishment space. Nearly all sports fans consume beverages while watching sports - beer, soda or water at least. Thus, the restaurant floor plan designers added a large lavatory there. Moreover, project developers considered unnecessary the gender division of such delicate place - perhaps they guess that only men are watching football, or believe that alcohol will eliminate the most of gender differences.
 Picture: How To Create Restaurant Floor Plan in MinutesRelated Solution:Unfortunately, a man can’t predict the future and no one is safe from natural disasters, such as floods, earthquakes, hurricanes or fires. Nonetheless, what you can do to ensure safety for you and your relatives is to create an emergency plan, so everyone will know what to do if emergency happens. Keep that plan simple and train it several times a year so that no one could forget any details of it. Fire and emergency plans are important to supply people with a visual safety solution. This diagram presents a set of standard symbols used to depict fire safety, emergency, and associated information. Using clear and standard symbols on fire emergency plans provides the coherence of collective actions , helps to avoid embarrassment, and improves communications in an emergent situation. The fire emergency symbols are intended for the general emergency and fire service, as well as for building plans ,engineering drawings and insurance diagrams. They can be used during fire extinguishing and evacuation operations, as well as trainings. It includes vector symbols for emergency management mapping, emergency evacuation diagrams and plans.
 Picture: Emergency PlanRelated Solution:ConceptDrawDIAGRAM 18


