UML Flowchart Symbols
The Unified Modeling Language (UML) is an accepted standard, universal modeling language widely used in the field of software engineering and software development. Initially destined for the object-oriented documentation design, now it is used much more widely.
The UML is based on the notations of the Booch method, the object-modeling technique (OMT) and object-oriented software engineering (OOSE), and allows successfully visualize the blueprints and display a graphical view of software system's structure on the UML diagram, applying the common set of notations - UML flowchart symbols.
The UML diagram is a powerful tool which lets visually represent all system's components, the interactions between them and relationships with external user interface. Use of UML flowchart symbols helps easy represent the system's requirements and subsystems, logical and physical elements, structural and behavioral patterns.
There 14 types of UML diagrams, each of them has its own purpose:
- Class Diagram — diagram which represents the structure of a system showing the objects as classes with attributes, methods, and relationships among them.
- Component Diagram — diagram that depicts the system's components and how they are connected each other and form larger components and software systems.
- Composite Structure Diagram — diagram that illustrates the internal structure of a specific class and also collaborations with others classes and outside elements which are possible owing this structure.
- Deployment Diagram — diagram which models the physical deployment of artifacts (software) on nodes (hardware).
- Object Diagram — diagram which displays a system's overview at a particular moment of time.
- Package Diagram — diagram that shows the dependencies between the packages which compose a model.
- Profile Diagram — diagram which allows to show stereotypes as classes and profiles as packages at the metamodel level.
- Activity Diagram — diagram that graphically represents the steps in a software process as a workflow.
- State Machine Diagram — diagram which describes the system composed of a finite number of states and shows the current state of a machine.
- Use Case Diagram — diagram that depicts the interactions between users and the system, and different use cases in which the user is involved.
- Communication Diagram — diagram that displays the interactions between the objects in terms of a set of sequenced messages.
- Interaction Overview Diagram — diagram which describes a workflow through a system, the individual activities can contain the nested interaction diagrams.
- Sequence Diagram — diagram that depicts objects interactions in a specific time sequence.
- Timing Diagram — diagram that shows behaviours of a given set of objects throughout a certain period of time.
Part of these UML diagrams are behavior diagrams - they depict behaviors and interactions of various system's components, other part are static structure diagrams - they show the system's physical structure.
Design of UML digrams is often a complex process which requires powerful software, that's why the ability fast and easy create the UML diagrams of any type and complexity offered by ConceptDraw's Rapid UML solution from the Software Development area of ConceptDraw Solution Park makes the ConceptDraw DIAGRAM software the best choice for UML diagramming.

Example 1. UML Flowchart Symbols
The Rapid UML solution offers diversity of UML flowchart symbols for each from the existing UML diagrams types - 13 libraries with 393 vector objects from generally accepted UML notation.
 UML Activity symbols library
 UML Class Diagram symbols library
 UML Communication Diagrams symbols library
 UML Component symbols library
 UML Composite Structure symbols library
 UML Deployment symbols library
 UML Interaction Overview symbols library
 UML Object symbols library
 UML Package symbols library
 UML Sequence Diagram symbols library
 UML State Machine Diagram symbols library
 UML Timing symbols library
 UML Use Case symbols library
Follow the next simple steps to design the UML diagram of any type of UML diagrams without efforts:
- drag the UML objects from the library which corresponds to your UML diagram type, add the text and arrange them on your document page;

Example 2. Adding UML objects
- connect the objects with connectors which appropriate for diagrams of selected type;

Example 3. Connecting UML objects
- add the text and color your diagram;

Example 4. UML Collaboration Diagram - Ticket Processing System
- you can also add the next object and automatically connect it with previous by clicking on its icon from the RapidDraw arrows, which pop up when you bring the mouse cursor over the object.

Example 5. Use of RapidDraw feature


The Rapid UML Solution provides also large quantity of predesigned templates and samples for each type of UML diagrams. All they are available from ConceptDraw STORE and can be used as the base for your UML diagrams.
 UML Activity Diagram template
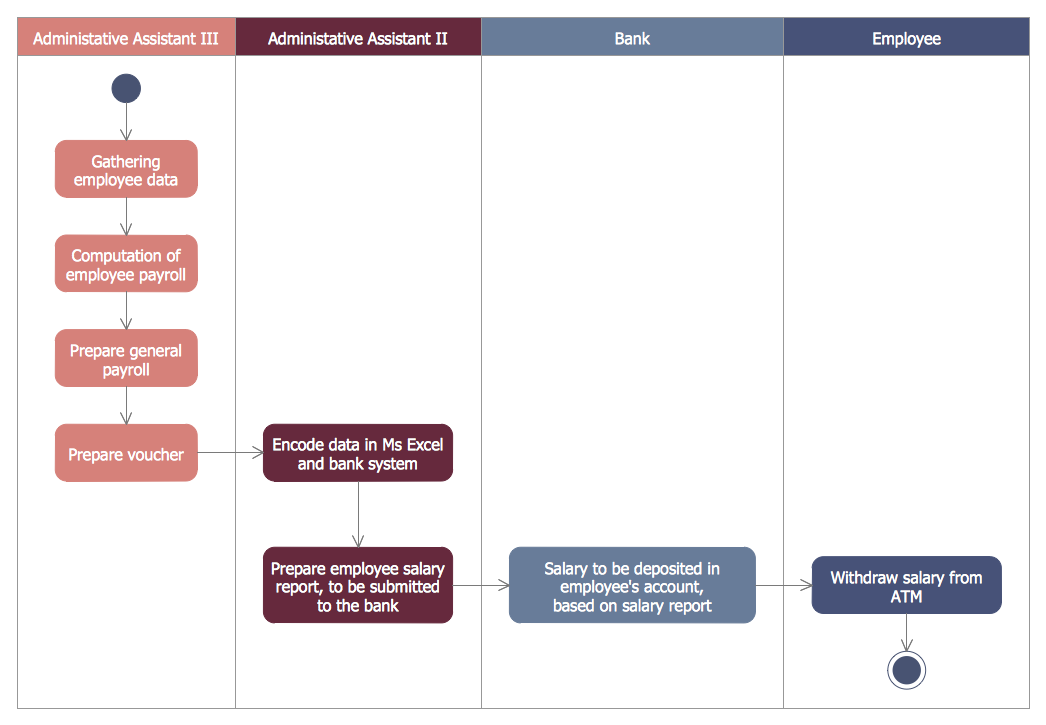
 template") UML Activity Diagram (Swimlanes) template
UML Activity Diagram (Swimlanes) template
 UML Class Diagram template
 UML Communication Diagram template
 UML Component Diagram template
 UML Composite Structure Diagram template
 UML Deployment Diagram template
 UML Interaction Overview Diagram template
 UML Object Diagram template
 UML Package Diagram template
 UML Sequence Diagram template
 UML State Machine Diagram template
 UML Timing Diagram template
 UML Use Case Diagram template
Use of template is the easiest way of drawing various diagrams and especially UML diagrams thanks to this multiplicity of professionally developed templates.

Example 6. Rapid UML Solution
The ConceptDraw DIAGRAM diagramming and vector drawing software is the best choice for easy drawing the UML diagrams thanks to the powerful drawing tools, collection of predesigned samples, examples, templates, and UML flowchart symbols.

Example 7. Export UML Diagram to Visio, PDF and PPT
Any UML Diagram created in ConceptDraw DIAGRAM can be then easy printed to share with colleagues, exported to various popular formats, including PPT, PDF, MS Visio, HTML, and many other graphic formats.