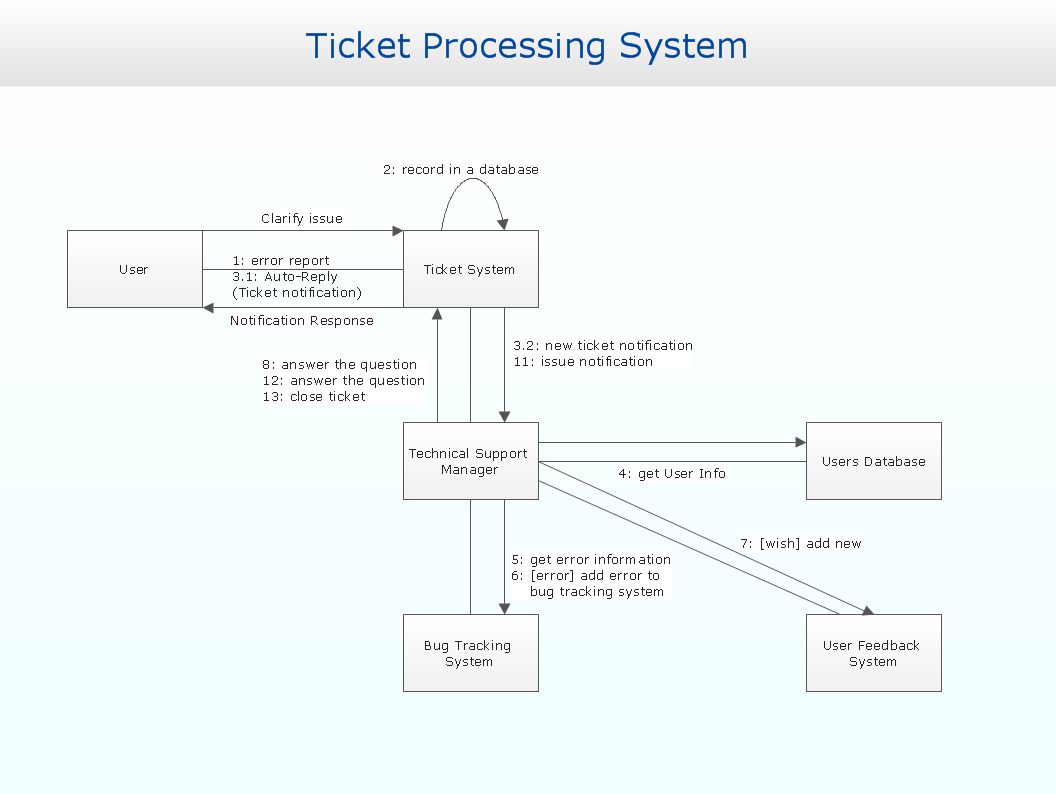
Sample 1. Ticket Processing System
ConceptDraw Rapid UML solution provides samples, templates and library of vector stencils to create both UML 2.0 communication diagrams and UML 1.x collaboration diagrams.
Use ConceptDraw DIAGRAM diagramming and vector drawing software enhanced with Rapid UML solution from ConceptDraw Solution Park to create your own UML 2.0 communication diagrams and UML 1.x collaboration diagrams that model both static structure and dynamic behavior of your systems.
TEN RELATED HOW TO's:
You need to draw a Functional Flow Block Diagram? You are an artist? Now it doesn't matter. With Block Diagrams solution from the Diagrams area for ConceptDraw Solution Park you don't need more to be an artist to design the Functional Flow Block Diagram of any complexity.
Picture: Functional Flow Block Diagram
Related Solution:
UML Class Diagrams describes the structure of a system by showing the system's classes, their attributes, and the relationships among the classes.
Picture: UML Class Diagram. Design Elements
Related Solution:
ConceptDraw DIAGRAM is the best software for illustration the network topologies. It's very easy and quickly to design the network topology diagrams of any kinds and complexity in ConceptDraw DIAGRAM diagramming and vector drawing software using the Computer and Networks solution from Computer and Networks area of ConceptDraw Solution Park.
Picture: Network Topology Illustration
Related Solution:
ConceptDraw DIAGRAM is a professional software for creating great looking flowcharts. The samples included in this set of software allows users to draw any type of flowchart.
Picture: Flowchart Process Example
Related Solution:
Software development flourishes nowadays. Students have tons of educational information and courses that would fit every taste. And it's no secret that knowing how to draw data flow diagrams is a useful skill for a future software architect. The diagrams help a lot in understanding how to storage data effectively and how data processes within a system.
This data flow diagram represents the model of small traditional production enterprise. It was created using Yourdon and Coad notation. The data flow diagram include four main objects: entity, process, data store and data flow. Yourdon and Coad notation uses circles to depict processes and parallel lines to represent data stores. Dataflows are shown as arrowed lines. They are labeled with the description of the data that move through them. Dataflow's role is to deliver the pieces of information. A process's function is to transform. the input data flow into output data flow. ConceptDraw Data Flow Diagrams solution contains the data flow diagram symbols of both Yourdon-Coad and Gane-Sarson notations and a set of handy templates to get started with DFD.
Picture: Data Flow Diagrams
Related Solution:
The behavior of worker in organization is influences organizational effectiveness. A simple block diagram made with ConceptDraw Block diagrams solution can improve the understanding of expectations of workers regarding what they l contribute to organization and what they wait to obtain. Making block diagram depicting the individual behavior in organization is used in HR management to obtain an optimal and positive overall contribution to the organization.
The behavior of worker in organization is influences organizational effectiveness. A simple block diagram made with ConceptDraw Block diagrams solution can improve the understanding of expectations of workers regarding what they l contribute to organization and what they wait to obtain. Making block diagram depicting the individual behavior in organization is used in HR management to obtain an optimal and positive overall contribution to the organization.
Picture: Basic Diagramming
Related Solution:
Website wireframes are convenient and widely used by developers, visual designers, business analysts, and many other people related with projection, development and promotion websites. Usually website wireframes look lacking of brilliance, but they effectively reflect website functionality, content and visually represent its skeletal framework.
ConceptDraw DIAGRAM software offers a unique Website Wireframe solution from the Software Development area with all needed tools for fast and easy drawing professional looking website wireframe with attractive interface design.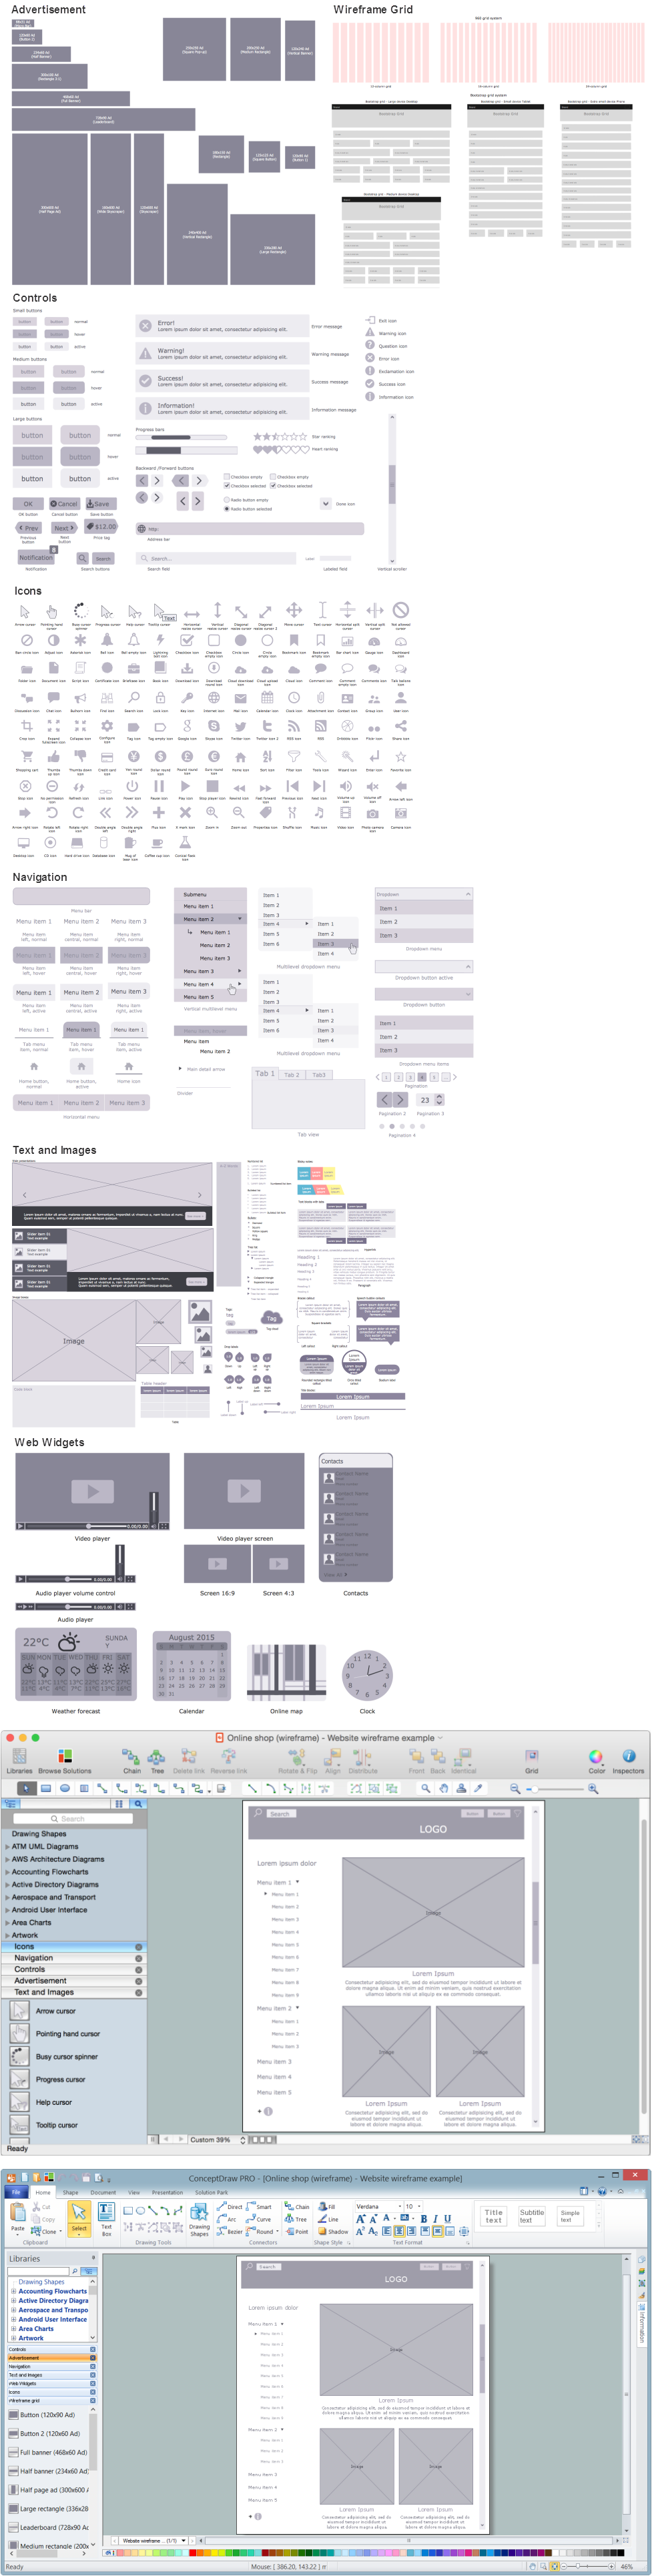
Picture: Interface Design
Related Solution:
ConceptDraw DIAGRAM diagramming and vector drawing software offers the Vehicular Networking Solution from the Computer and Networks Area of ConceptDraw Solution Park which makes it the best for designing professional looking vehicular network diagrams.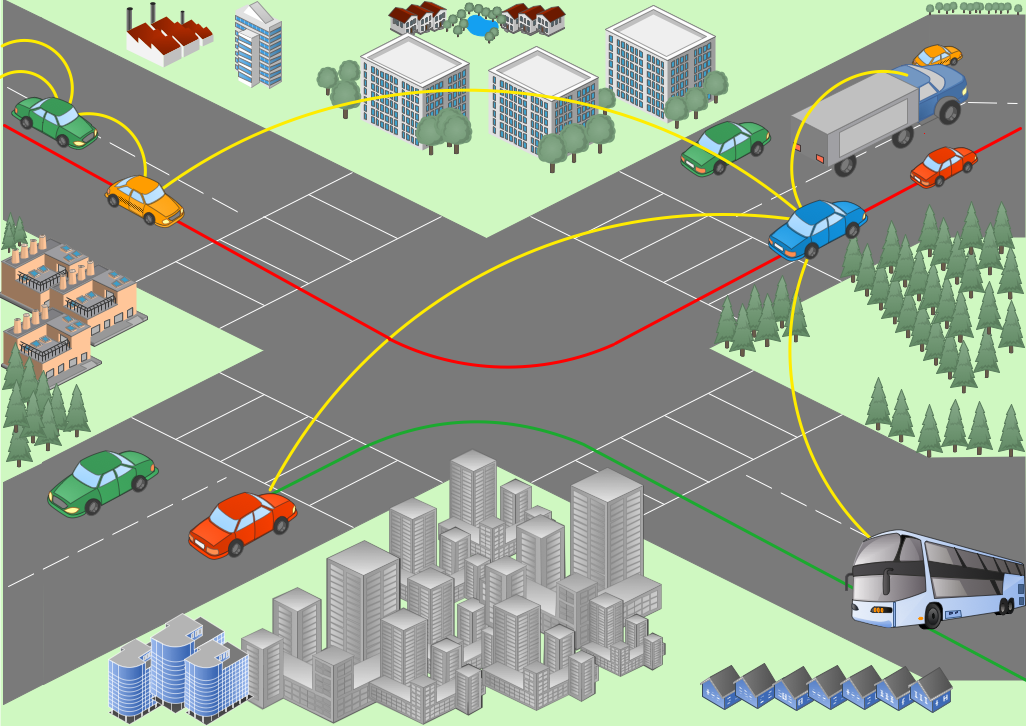
Picture: Vehicular Network
Related Solution:
UML Deployment Diagram depicts the physical deployment of artifacts on nodes (nodes are the existing hardware components, artifacts are the software components running on each node); and how the different pieces are connected.
Use ConceptDraw DIAGRAM with UML deployment diagram templates, samples and stencil library from Rapid UML solution to model the physical deployment of artifacts on nodes of your software system.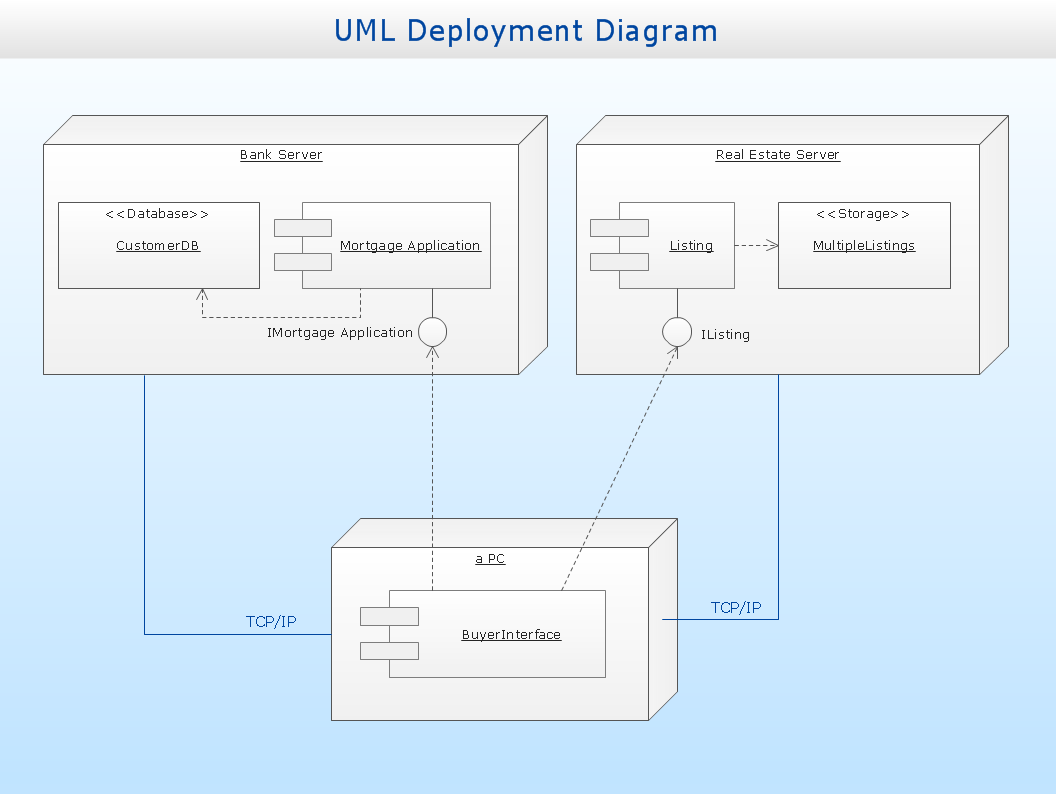
Picture: UML Deployment Diagram
Related Solution:
There are many ways to describe a database structure. One of the most usual is to draw an entity relationship diagram (ERD) using a Crow’s Foot notation to represent database elements. If you don’t want to draw it on paper, you should use an appropriate software.
An entity-relationship (ER) diagram is used to show the structure of a business database. ERD represents data as objects (entities) that are connected with standard relationships symbols which Illustrate an association between entities. ERD, there is a wide range of ERD notations used by data bases architects for reflecting the relationships between the data entities. According to the crow’s foot notation relationships are drawn as single labeled lines designating a certain kinds of relationship. Crow foot notation is a most frequently used ERD standard, because of improved readability of diagrams, with a more accurate use of space on the page._Win_Mac.png)
Picture: Entity Relationship Diagram - ERD - Software for Design Crows Foot ER Diagrams
Related Solution: