
Sample 1. Flow chart - purchasing process.
Accounting Flowcharts solution from ConceptDraw Solution Park provides templates, samples and library of vector shapes for drawing the Accounting Process Flowcharts.
Use ConceptDraw DIAGRAM with Accounting Flowcharts solution to document and communicate visually how accounting processes work, and how each operation is done.
TEN RELATED HOW TO's:
This sample was created in ConceptDraw DIAGRAM diagramming and vector drawing software using the UML State Mashine Diagram library of the Rapid UML Solution from the Software Development area of ConceptDraw Solution Park.
This sample shows the work of the online store and can be used for the understanding of the online shopping processes, for projection and creating of the online store.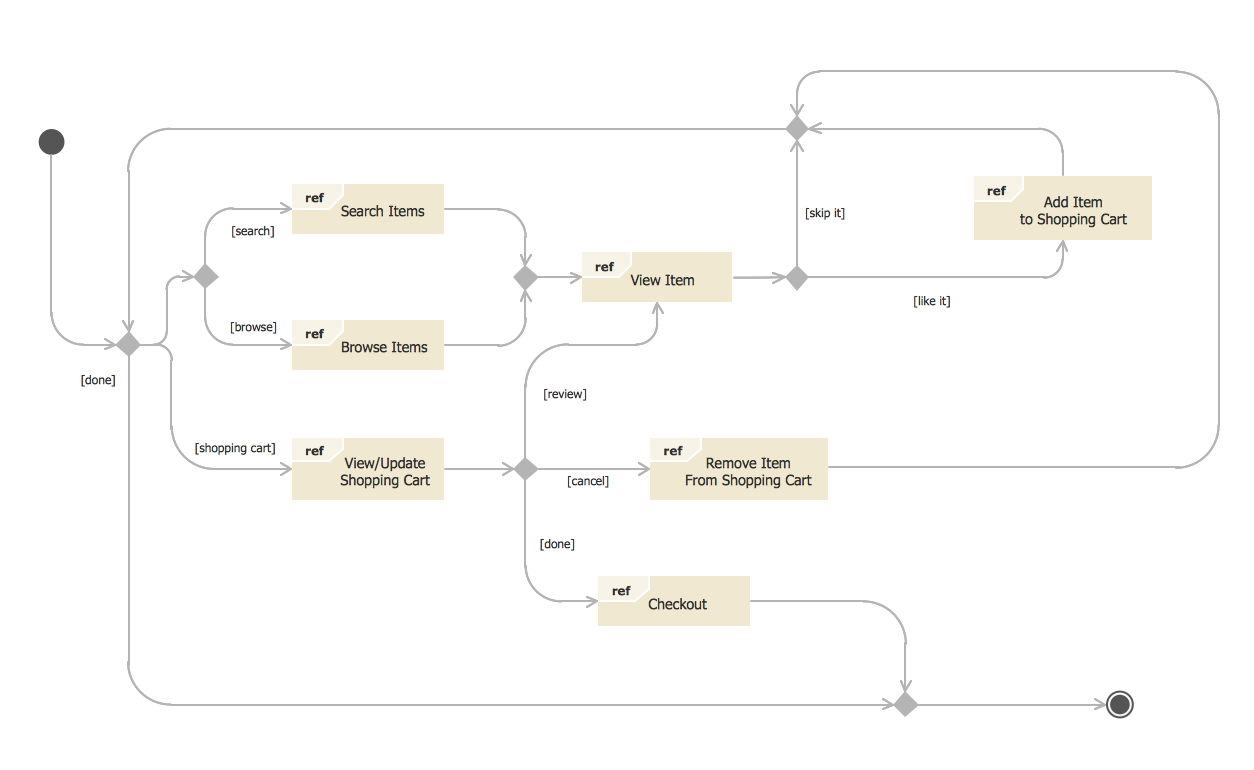
Picture: State Diagram Example — Online Store
Related Solution:
Data Flow Diagram is used to depict the flow of data through the system, where it enters and exits the system, as well as where it is stored. To simplify the process of drawing a data flow diagram (DFD), ConceptDraw DIAGRAM provides a DFD Library - design elements that will help you make your diagram as informative, streamlined and understandable as possible. Data flow diagrams are useful to create a general overview of the system or to document major data flows.
Here are the library of symbols used in data flow diagrams (DFD). Data Flow diagrams are graphic means of business process visualization. Any business process may involve the data transfer. It can be easily shown using data flow diagrams. DFDs are used to represent the processing and transformation of data within a business process. One can find out the Vector library of DFD symbols, that is a component of ConceptDraw solution for Data Flow Diagramming and is welcome to use in as addition to the common Conceptdraw DIAGRAM diagramming facilities.
Picture: DFD Library — Design elements
Related Solution:
Developing a software project supposes architecture first. To make it proper, you can use data flow diagram model in your current project.
The data flow diagram represents the Model of small traditional production enterprise that is made using Yourdon and Coad notation. It shows how the data is transfered through a process. According to the notation of Yourdon and Coad a process is represented by circles and data stores are drawn using parallel lines. This DFD was created using the ConceptDraw Data Flow Diagrams solution. Using this solution one can visualize data flow accordingly to the rules of two basic notations used for data flow modeling.
Picture: Data Flow Diagram Model
Related Solution:
ConceptDraw DIAGRAM diagramming and vector drawing software extended with Marketing Diagrams Solution from the Marketing Area of ConceptDraw Solution Park is the best software for quick and easy creating Marketing Flow Chart of any complexity and design.
Picture: Marketing Flow Chart
Related Solution:
High competition among the restaurants at the food court requires original design ideas. To attract visitors and increase sales are used many kinds of advertising products, brightly colored signboards, menus and show-cases, often are used the molds of beautifully decorated dishes. Now designing of colorful F&B (food and beverage) materials is easier than ever thanks to the ConceptDraw DIAGRAM diagramming and vector drawing software extended with Food Court Solution from the Food and Beverage Area of ConceptDraw Solution Park.
Picture: F&B
Related Solution:
How to draw a Process Flow Chart? It's very fast and easy to draw any Process Flow Chart using the tools of special Process Flow Chart software free.
Flowcharts Solution offers wide set of useful drawing tools, collection of samples, ready-to-use template and 2 libraries with predesigned vector elements which will help facilitate drawing process and designing professional looking process flow chart, process flow scheme, process block diagram, etc.
Picture: Process Flow Chart Software Free
Related Solution:
Those triangles within any technical analysis are known to be the chart patterns that can be commonly found in the price charts of the financially traded assets, such as stocks, futures, bonds, etc. The pattern is known to be deriving its name from the fact that it is characterized by some contraction in a price range being the converged trend lines, giving it a triangular shape.
Picture: Pyramid Diagram
Related Solution:
Now you know all of the tricks on assigning resources in ConceptDraw PROJECT. You can now better use these flexible management tools to realize your project’s goals efficiently.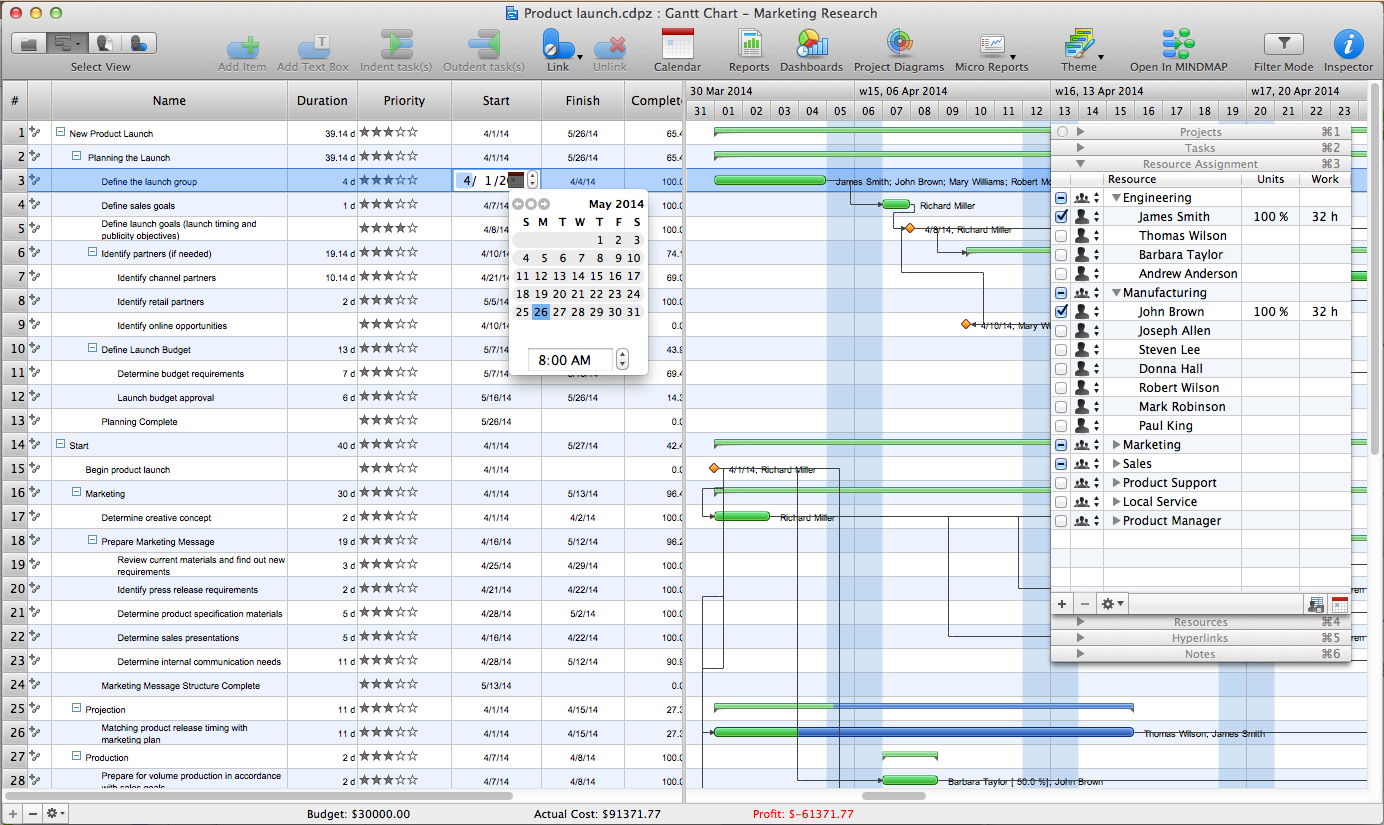
Picture: Advanced Resource Assignment in ConceptDraw PROJECT
Related Solution:
For documenting the Cloud Computing Architecture with a goal to facilitate the communication between stakeholders are successfully used the Cloud Computing Architecture diagrams. It is convenient and easy to draw various Cloud Computing Architecture diagrams in ConceptDraw DIAGRAM software with help of tools of the Cloud Computing Diagrams Solution from the Computer and Networks Area of ConceptDraw Solution Park.
Picture: Cloud Computing Architecture Diagrams
Related Solution:
ConceptDraw DIAGRAM extended with Data Flow Diagrams solution is the best diagramming and vector drawing software for quick and easy designing the Data Flow Diagram Example of any complexity.
Picture: Data Flow Diagram Example
Related Solution: