
Sample 1. Purchasing Flow Chart
Use the ConceptDraw DIAGRAM with Accounting Flowcharts Solution to create your own professional Accounting Flowcharts quick and easy.
The Accounting Flowcharts produced with ConceptDraw DIAGRAM are vector graphic documents and are available for reviewing, modifying, and converting to a variety of formats (image, HTML, PDF file, MS PowerPoint Presentation, Adobe Flash or MS Visio).
See also:
TEN RELATED HOW TO's:
The Flowchart is a very popular type of diagram, it is widely used for analyzing, designing, managing and visualizing the business and technical processes, various software algorithms. But how to create Flowchart quick and easy?
Flowcharts solution from the Diagrams area of ConceptDraw Solution Park helps you to design the professional looking Flowchart Diagrams quick and easy using the ConceptDraw DIAGRAM diagramming and vector drawing software.
Picture: Create Flowchart - Making a Flowchart
Related Solution:
Create your own Linux audit flowcharts using the ConceptDraw DIAGRAM diagramming and vector drawing software extended with the Audit Flowcharts solution from the Finance and Accounting area of ConceptDraw Solution Park.
This flowchart example describing auditd, the linux audit tool.
Picture: Linux Audit Flowchart Example. Flowchart Examples
Related Solution:
Value Stream Mapping solution extends ConceptDraw DIAGRAM software with templates, samples and vector shapes for drawing the current state value stream maps.
Picture: Learn how to create a current state value stream map
Related Solution:
Do you need to draw a check order process flowchart?
Use the intuitive product - ConceptDraw.
Picture: Check Order Process Flowchart. Flowchart Examples
Related Solution:
ConceptDraw DIAGRAM is a powerful business and technical diagramming software tool that enables you to design professional-looking graphics, diagrams, flowcharts, floor plans and much more in just minutes. Maintain business processes performance with clear visual documentation. Effectively present and communicate information in a clear and concise manner with ConceptDraw DIAGRAM.
Picture: ConceptDraw DIAGRAM
What is organizational charts and why your business need them? How to use business process diagram software? Explore how advanced organization chart software transforms the way companies ✔️ visualize, ✔️ communicate, and ✔️ streamline their organizational hierarchies
Picture:
What is an Organizational Chart and how it works?
Organization Chart Software
Related Solution:
If you have a premise, or a studio and you want to start your own business, catering might be perfect for you. You can see a cafe floor plan as an example of possible usages of the free space on the floor. Obviously, you can rearrange it in any plausible way.
This cafe floor plan was created with a help of ConceptDraw solution for Cafe and Restaurant Floor Plans. Working under the design of interiors plans for cafe, commonly cause various creative and architectural issues. Primarily, cafe floor plan and interior design must be nice and at the same time comfortable for customers. Developing a floor plan and interior conception for cafe involve various elements that can be found out in the ConceptDraw Cafe and Restaurant Floor Plan solution. This sample drawing may be used as a template while proceeding to design a particular cafe. This sample plan can help to select furniture most suitable for cafe's guest rooms or cuisine. Also, this drawing may be handy as a requirements list of a furnishing and accessories necessary for the new cafe.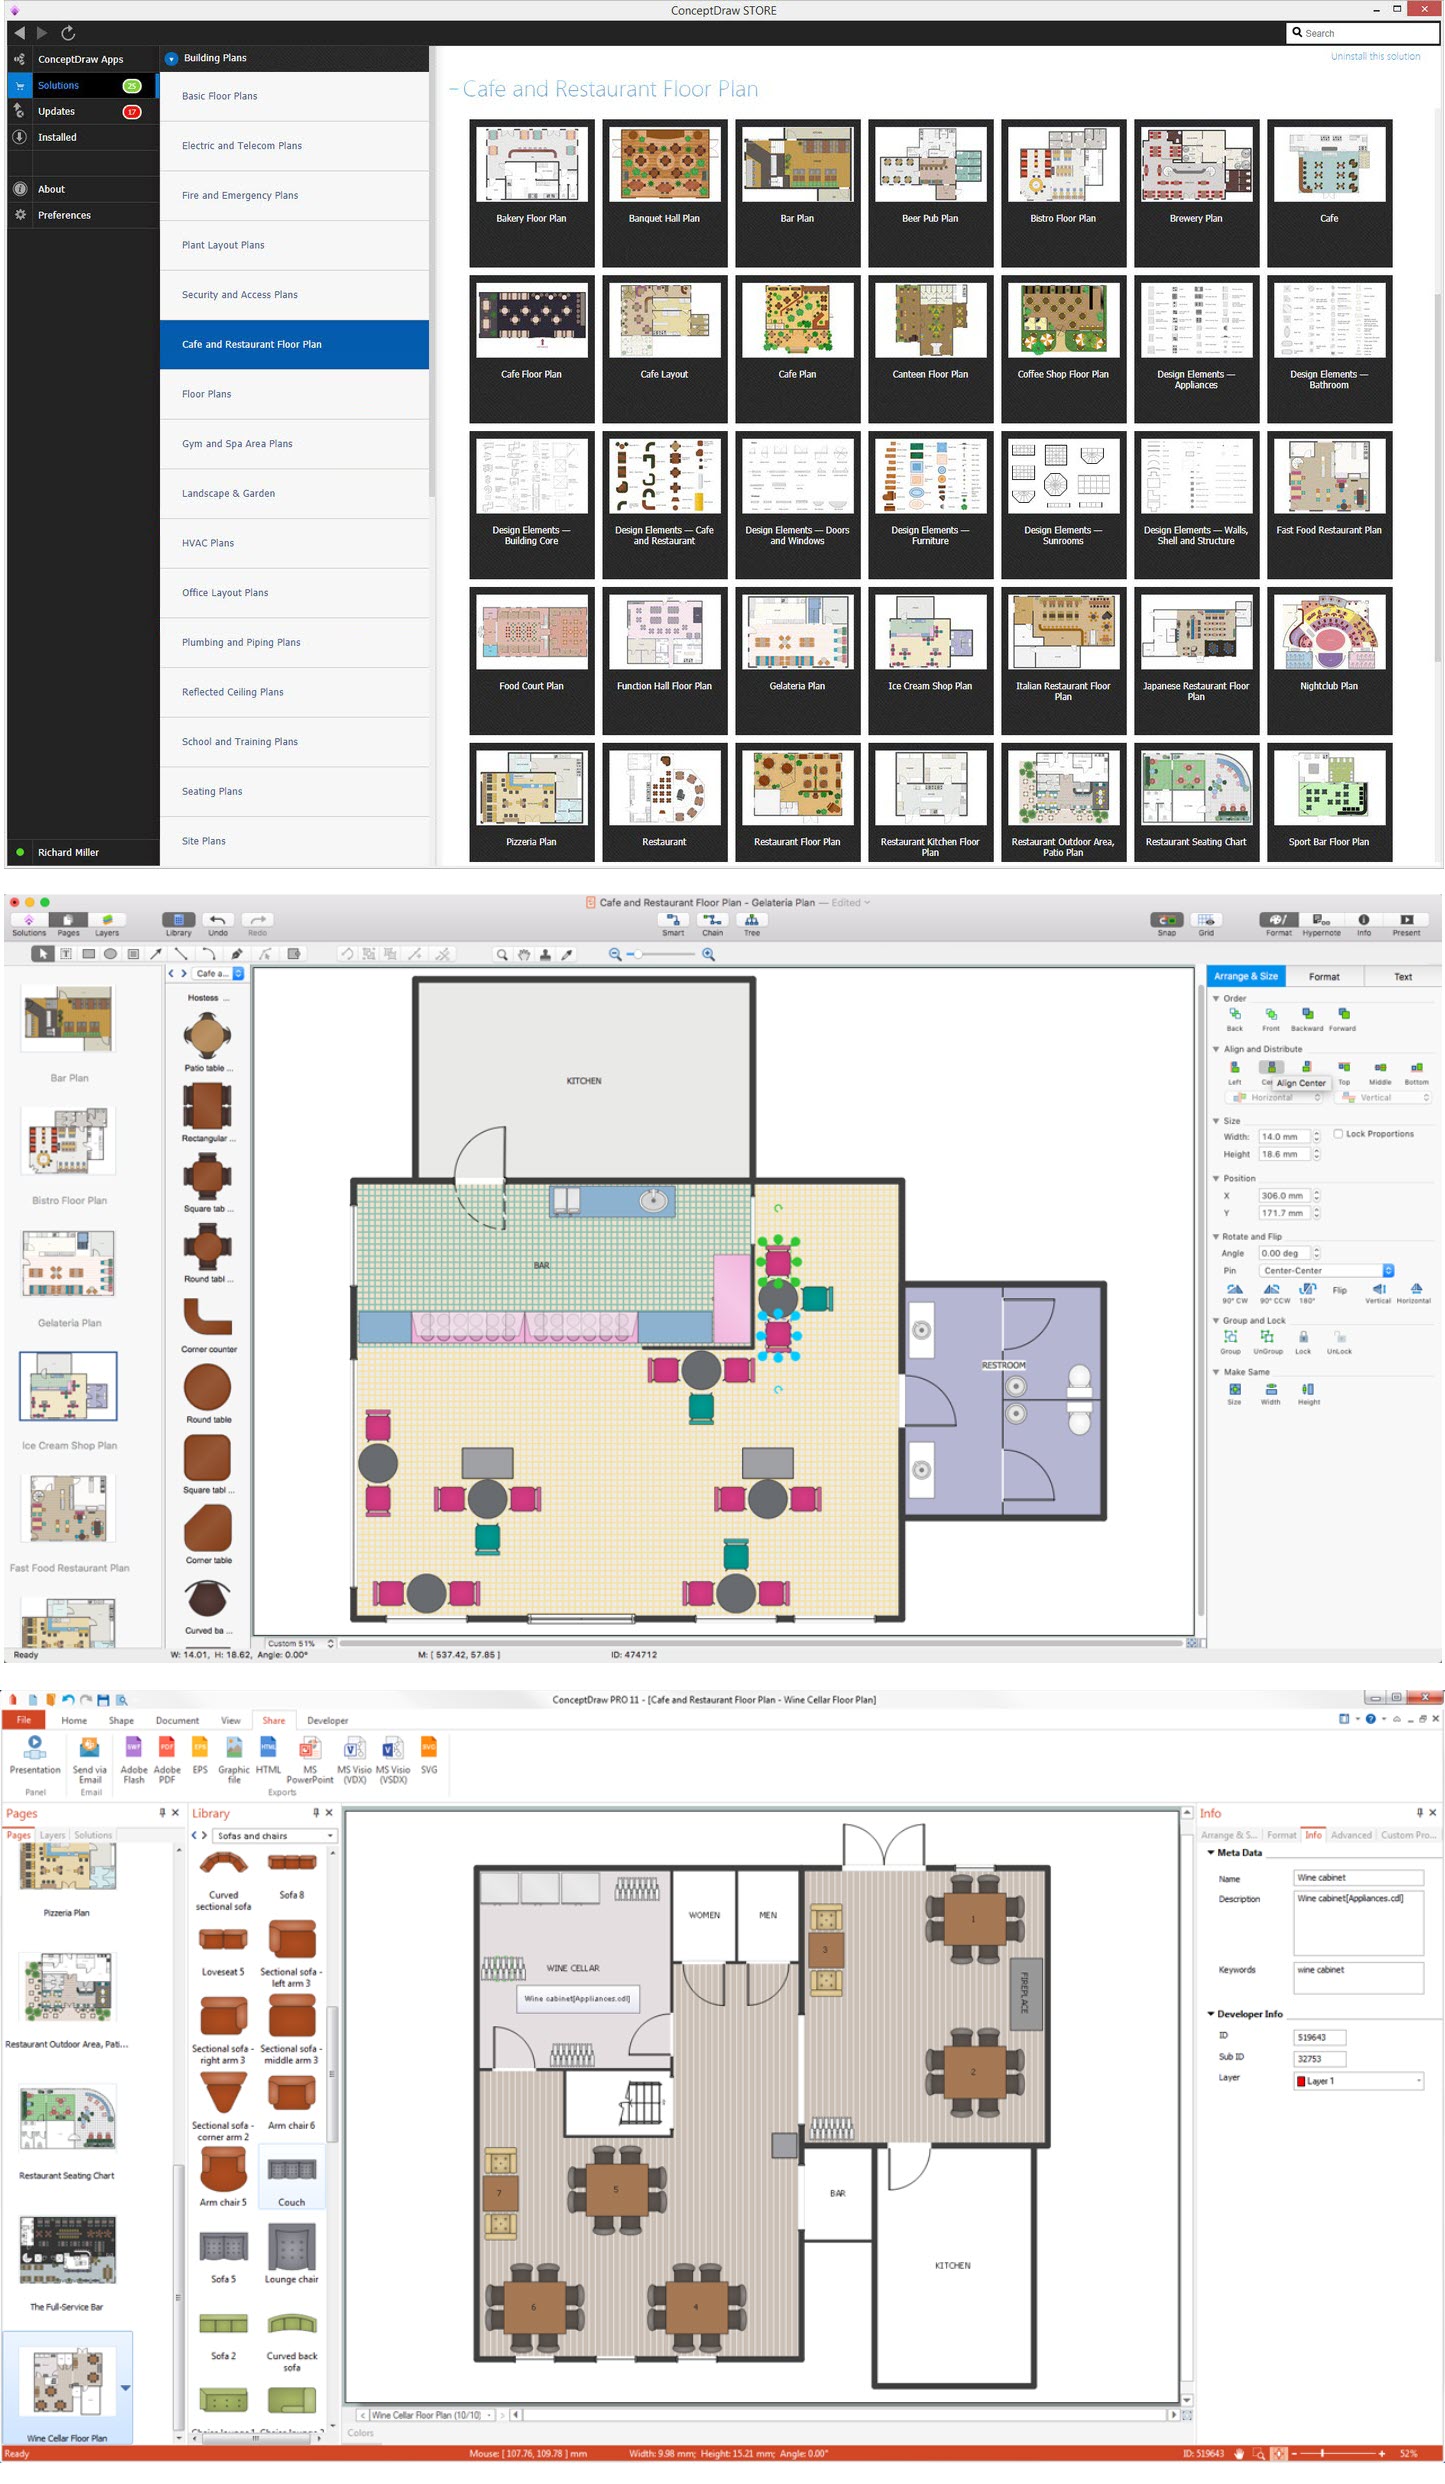
Picture: Café Floor Plan Example
Related Solution:
Interior design is an art of planning and coordinating the space in a building or on a floor to produce a charming and convenient environment for the client. You can ask professionals for help, or you can create floor plans easily with ConceptDraw DIAGRAM , using diverse libraries or altering numerous templates. You don’t need no formal training anymore to be a designer, isn’t it great?
Using a ConceptDraw DIAGRAM floor plan software makes depicting of home or office layout ideas a simple task. It does not require special skills to make detailed and scaled floor plans. Adding furniture to design interior is also a breeze. You can draw and furnish your floor plans with a floor plan software. Moreover, using software for floor planning you gain an opportunity to share your plans and high-resolution images of your designs with clients or stakeholders.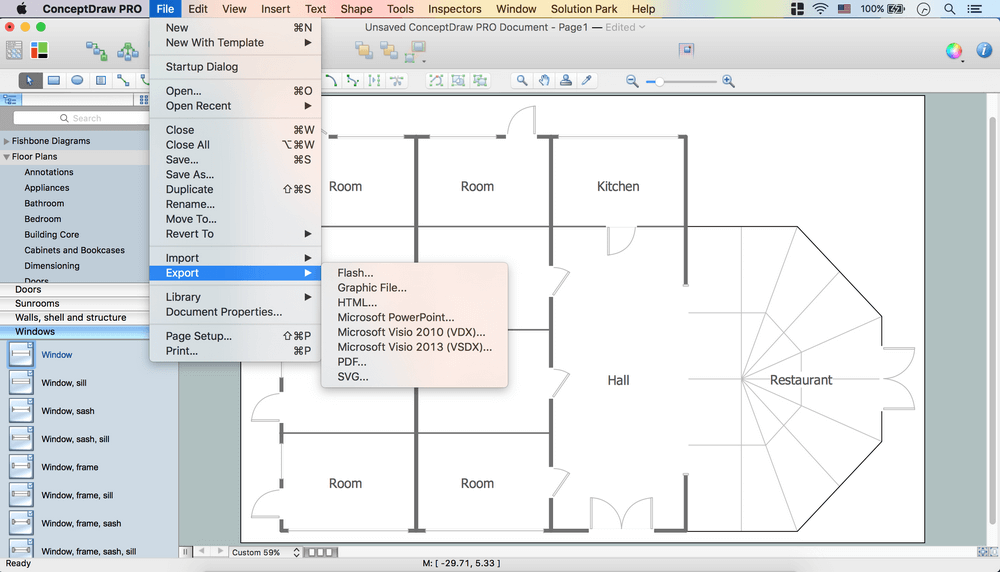
Picture:
Create Floor Plans Easily
with ConceptDraw DIAGRAM Floor Design Software
Related Solution:
You need create a Sales Process Map? Use the ConceptDraw DIAGRAM software which is ideal for the sales process management, marketing and engineering thanks to the powerful Sales Flowcharts solution from the Marketing area of ConceptDraw Solution Park.
Picture: Sales Process Map
Related Solution:
Electrical Engineering Solution used together with ConceptDraw DIAGRAM drawing facilities makes short a work of drawing various electrical and electronic circuit schemes. A library of vector objects composed from symbols of Analog and Digital Logic elements of electric circuit includes 40 symbolic images of logic gates, bistable switches of bi-stable electric current, circuit controllers, amplifiers, regulators, generators, etc. All of them can be applied in electronic circuit schemes for showing both analog and digital elements of the circuit.
Electrical Engineering Solution used together with ConceptDraw DIAGRAM drawing facilities makes short a work of drawing various electrical and electronic circuit schemes. A library of vector objects composed from symbols of Analog and Digital Logic elements of electric circuit includes 40 symbolic images of logic gates, bistable switches of bi-stable electric current, circuit controllers, amplifiers, regulators, generators, etc. All of them can be applied in electronic circuit schemes for showing both analog and digital elements of the circuit.
Picture:
Electrical Diagram Symbols F.A.Q.
How to Use Electrical ConceptDraw Diagram Software
Related Solution: