How should diagramming software work? Is it possible to develop a diagram as quickly as the ideas come to you?
The innovative ConceptDraw Arrows10 Technology included in ConceptDraw DIAGRAM is a powerful drawing tool that changes the way diagrams are produced.
While making the drawing process easier and faster.
ConceptDraw DIAGRAM is a powerful tool that helps you create a process map diagram quickly and easily. Fine-tuning the objects in ConceptDraw DIAGRAM allows you to create a really professional finished article.ConceptDraw Arrows10 Technology gives drawing connectors a smart behavior that provides quick and precise placement, allows for easy changes and automatic rearrangement.
A Bubble chart is a diagram that displays three dimensions of data. Each object’s size and position represents the values of its associated dataset.
Tree Auto-connection mode allows you to draw a bubble chart in moments. Thanks to ConceptDraw Arrows10 Technology you don’t need to concern yourself with technical points like how to connect or place objects. Your only concern is what to draw. Everything else is taken care of by ConceptDraw professionals.
Let′s see how it works when creating bubble chart.
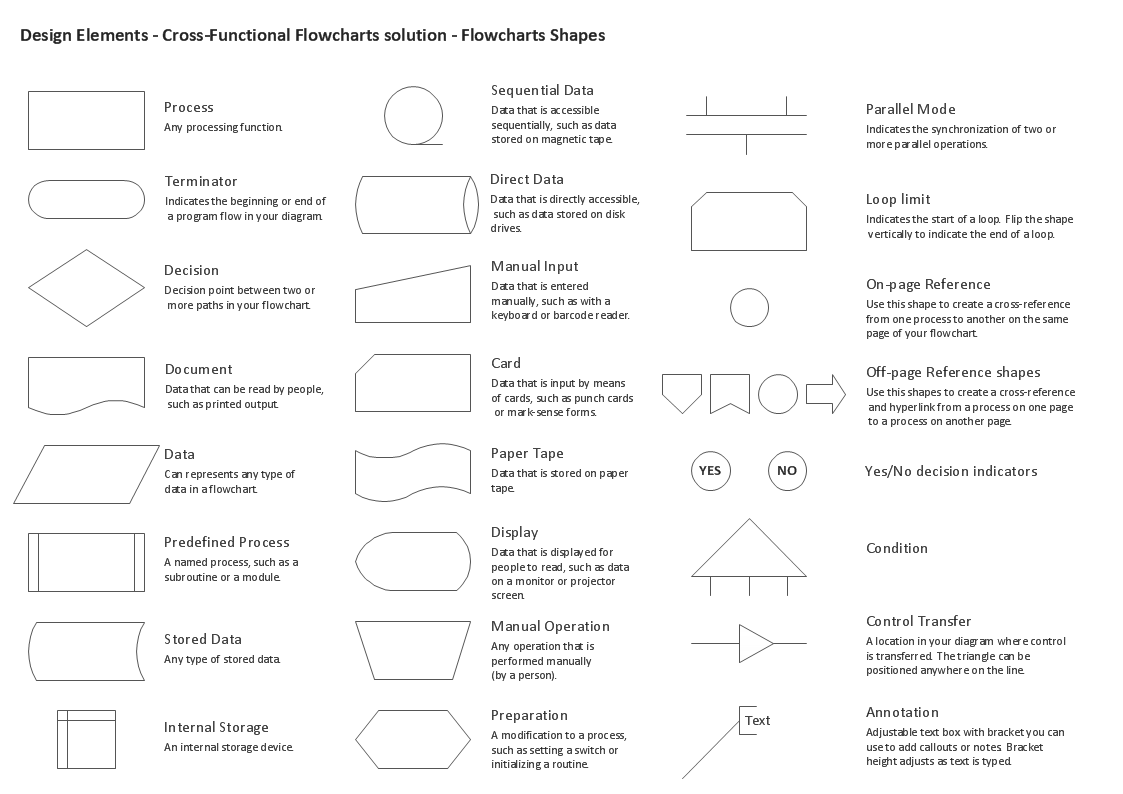
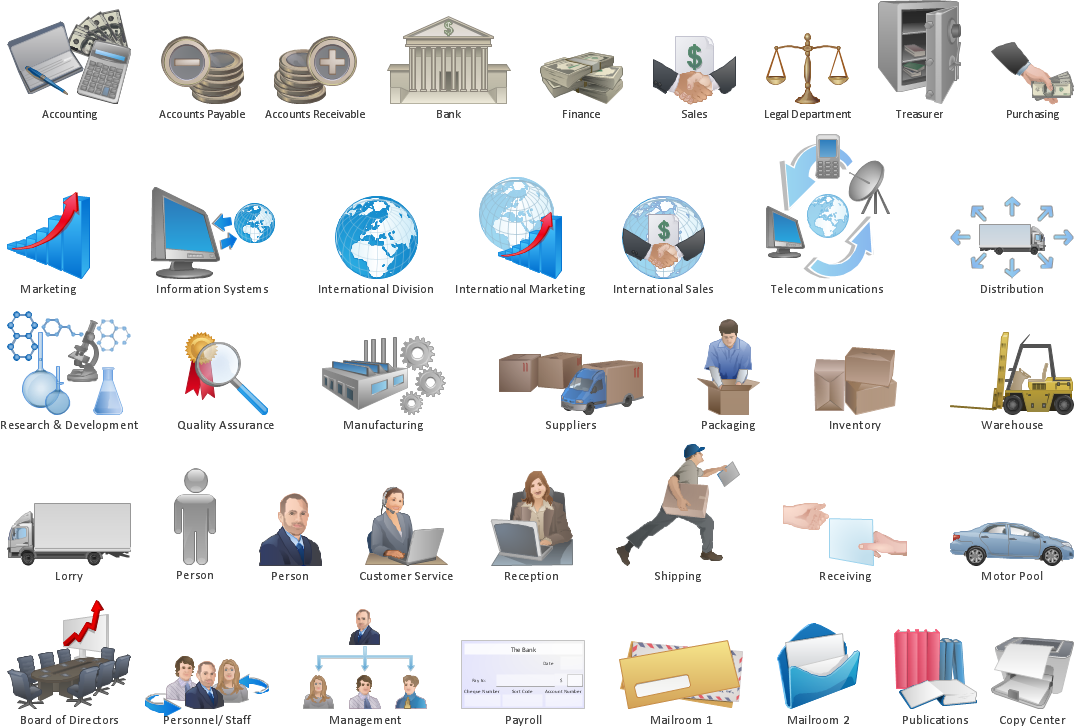
ConceptDraw DIAGRAM software provides vector shapes and connector tools for quick and easy drawing diagrams for business, technology, science and education
Some organization hold offices for years and decades, or even build their own campuses. However, if it’s time for your organization to move to another building, drawing software for designing office layout plan would come in handy. With such software you can save a lot of time and create a new layout or try to save old layout in a new building.
This office layout plan is an example of a typical office furniture and equipment arrangement. This drawing provides a graphic view of the office area and its facilities including furniture and office equipment. It can be used as template which represent, desks, files, and other pieces of equipment that can be re-arranged according the certain requirements to office space and facilities. The vector graphic objects that represent various office layout elements such as special office furniture and equipment can help you to shape a number of creative ideas and develop your office layout plan.
Picture: Building Drawing Software for Design Office Layout Plan
Using ConceptDraw you will be able to create bubble diagrams from the ready ConceptDraw library objects or make your own objects. The created diagram can be saved and edited, objects can be moved and links between them will be automatically repainted after object moving because of using the ConceptDraw connectors.
The most worked out and commonly used methodology of business processes description is IDEF methodology. Besides business processes it allows to describe functional blocks, for example production and marketing. ConceptDraw lets creation of business processes description using IDEF0 and IDEF2 methods.
Is it possible to develop a diagram as quickly as the ideas come to you? The innovative ConceptDraw Arrows10 Technology included in ConceptDraw DIAGRAM is a powerful drawing tool that changes the way diagrams are produced.
While making the drawing process easier and faster.
Drawing workflow diagrams combines both creative and analytic practice. To be the most effective in this process you should find a software that suites this kind of practice. Using ConceptDraw DIAGRAM software for drawing workflow diagrams you get support of features, libraries, templates and samples boosts you creativity and keep you focus on analytic practice, not drawing specifics.
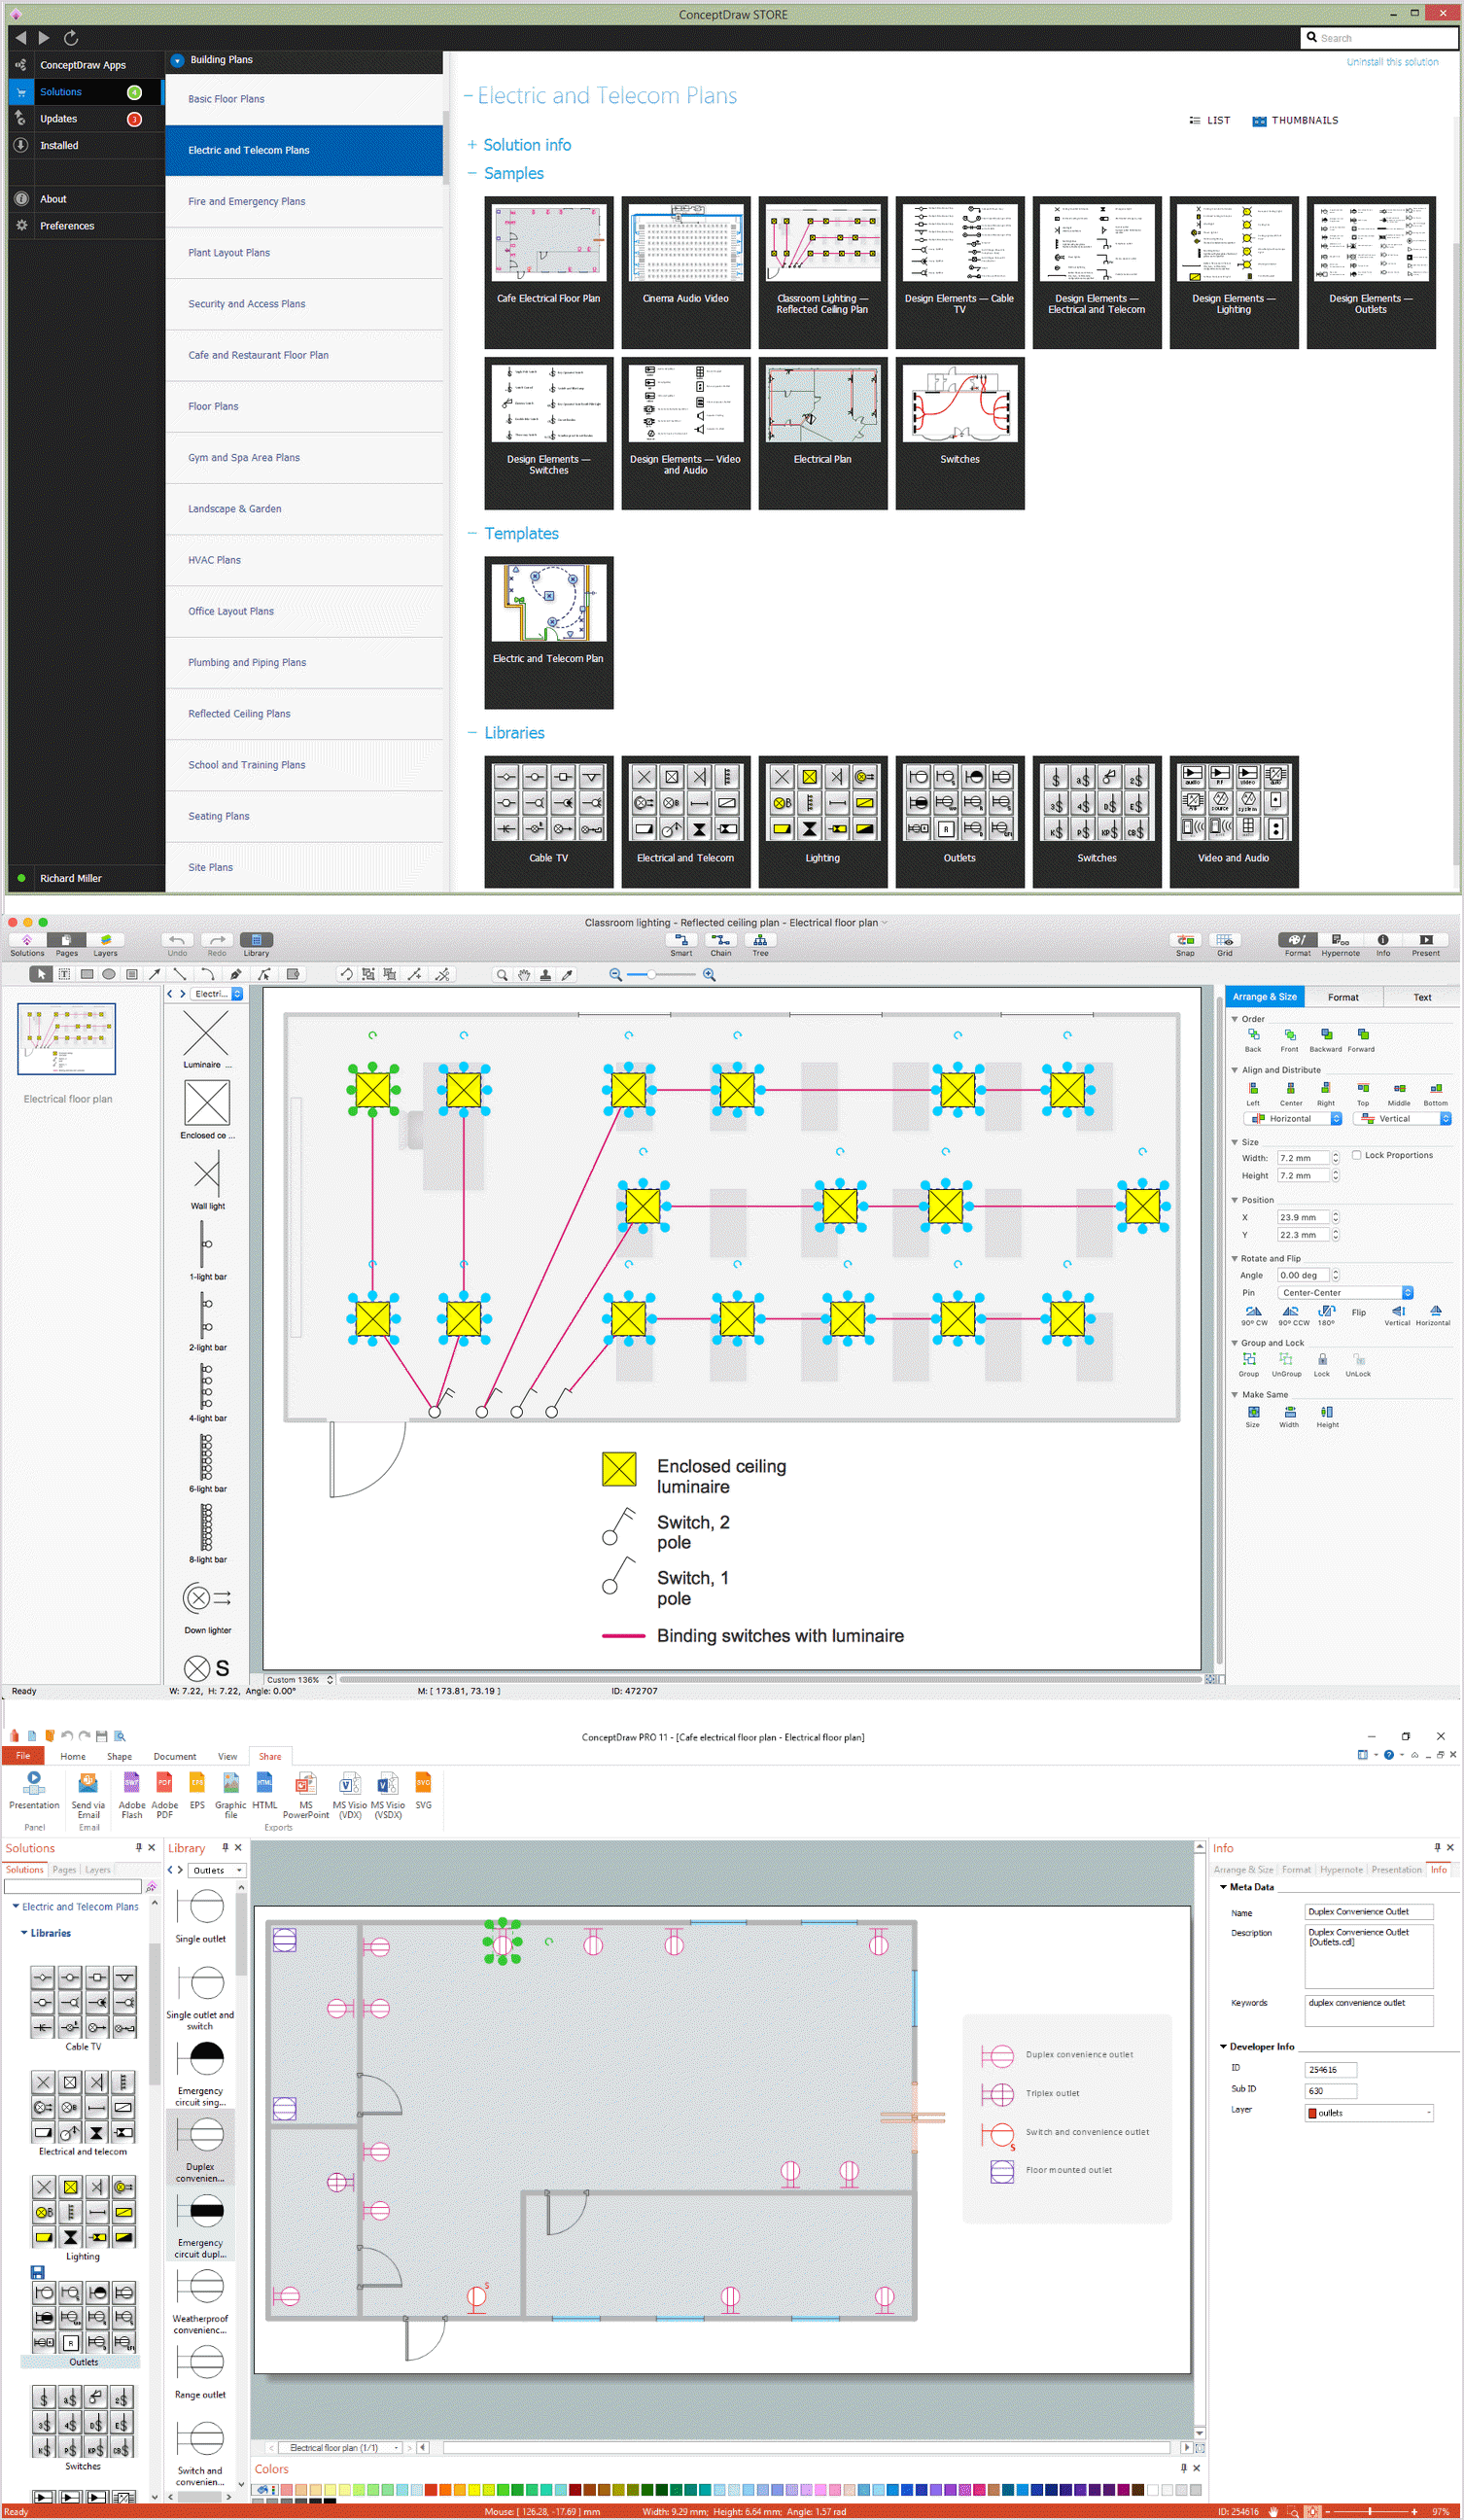
Drawing an electric circuit plan with all the wiring might seem very complex. If you ever felt afraid to ask how to use electrical and telecom plan software, then it’s time to actually start from altering the templates from the Solution Park. You won’t even notice the moment when you would become an experienced user.
This electrical and telecommunication floor plan plan presents electrical and telecommunication devices located in a country house floor plan. Each electrical or telecom device on this plan is indicated with the particular symbol. Using standard Electrical and Telecommunication symbols makes this floor plan clear for anybody who will be involved into construction process. All the electrical and telecom symbols used in the current floor plan are placed to a legend. This electrical and telecom floor plan can be included as a separate piece into a package of building documentation.
Picture: How To use Electrical and Telecom Plan Software
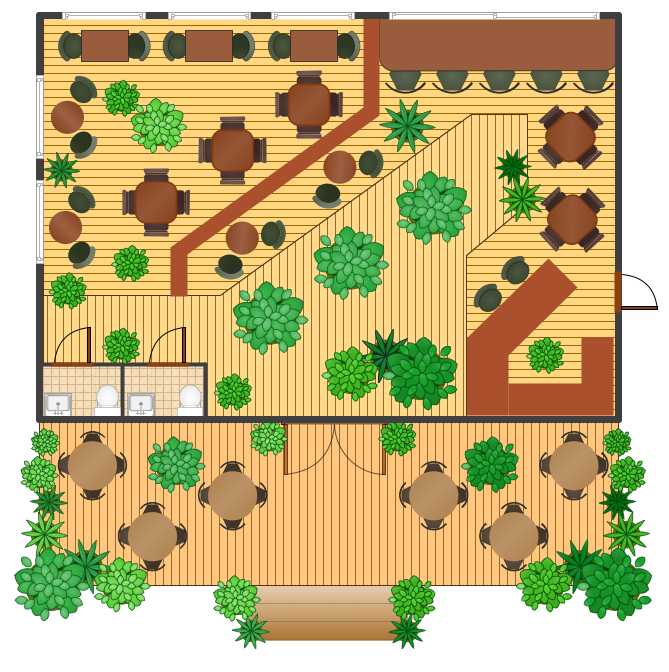
Cafes and restaurants are the places for relax and recreation, so the most important is their design and atmosphere of comfort, harmony, and uniqueness. So Cafe Design requires great creativity and efforts from the designers. ConceptDraw DIAGRAM software extended with Cafe and Restaurant Floor Plan solution from the Building Plans area of ConceptDraw Solution Park is the most simple way of displaying your Cafe Design ideas and plans first on the computer screen, and then on the paper.
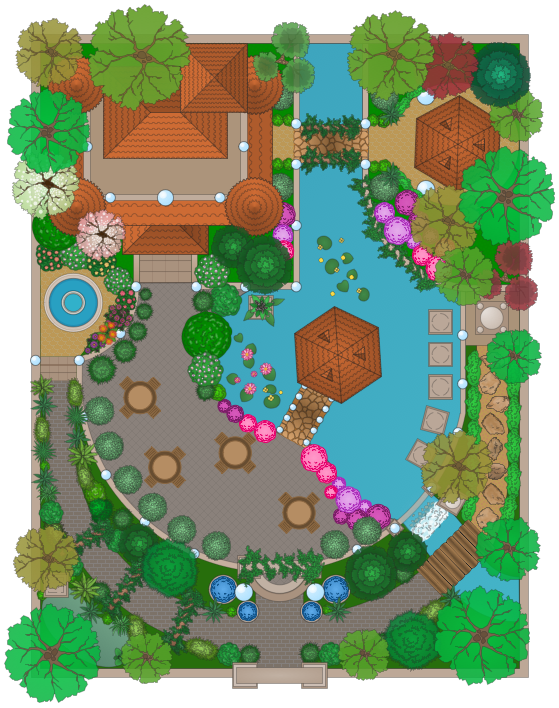
The modern garden design is a full complex of works for design, decorating and gardening. Landscape design offers a large number of styles for the modern garden design, their origins go back centuries. But do not forget that the modern garden design is first of all an individual project for a specific landscape and specific owner of the land, and sometimes it is appropriate to apply the combination of styles.
ConceptDraw DIAGRAM diagramming and vector drawing software offers the unique Landscape & Garden Solution from the Building Plans area for effective development the modern garden design.