
Pic 3. How to Draw Pictorial Chart
Pictorial Infographics solution provides also large quantity of sample infographics, sample pictorial chart and templates allowing anyone design pictorial infographics of any complexity in a few minutes.
How to Use Infograms
How to use infograms? Everyone loves infograms. It is a simple and understandable way for representing complex information and data in a visual graphical form. Infograms are very popular and widely used almost in any sphere of life activity, particularly in:
- education
- statistics
- business
- geography
- medicine
- journalism, etc.

Pic 4. How to Use Infograms
This sample pictorial chart was created in ConceptDraw DIAGRAM using the Computer Pictograms, Ecology Pictograms, and People Pictograms Libraries from the Pictorial Infographics Solution and illustrates the statistics of computer and internet use in the United States.
Solution Pictorial Infographics from ConceptDraw Solution Park extends ConceptDraw DIAGRAM ector diagramming and business graphics software with easy-to-use design pictorial infographics drawing tools.
Use Pictorial Infographics solution for quickly and easy design pictorial infographics documents and then successfully use them for your needs.
TEN RELATED HOW TO's:
ConceptDraw has several examples that help you to start using software for designing UML Use Case Diagrams.
Picture: UML Use Case Diagrams
The Event-driven Process Chain ( EPC ) Diagrams allows users to present business process models in terms of work flows.
The EPC diagram can shows various vayes how to reach positive company performance.
Picture: EPC - Business Processes in Terms of Work Flows
Related Solution:
If you need to describe some process, diagramming is a perfect tool for almost any imaginable purpose. The set of the most commonly used flow charts symbols is quite wide and includes symbols for operations, processes, data inputs and outputs. You can see the full list of all the symbols used for flowcharting in Flowcharts solution from Diagrams area in ConceptDraw Solution Park.
A flow chart is often used for visual representation of a sequential process flow. The flowchart approach to any process is to divide it into some sequential actions. What makes a flow chart so popular and clear to make out is the set of standard flowchart symbols that has the same reading independently from processes described with their applying. The current drawing represents the vector library containing the pack of standard flowchart symbols. This library is supplied with ConceptDraw Flowcharts solution.
Picture: Flow Chart Symbols
Related Solution:
You need design the Functional Block Diagram and dream to find the useful tools to draw it easier, quickly and effectively? ConceptDraw DIAGRAM offers the Block Diagrams Solution from the Diagrams Area which will help you!
Picture: Functional Block Diagram
Related Solution:
Apply Electrical Engineering solution for ConceptDraw DIAGRAM and numerous electric circuit symbols to 🔸 develop and illustrate all types of electrical circuits as ✔️ electrical circuit diagrams, ✔️ electrical schematics, ✔️ electrical diagram drawings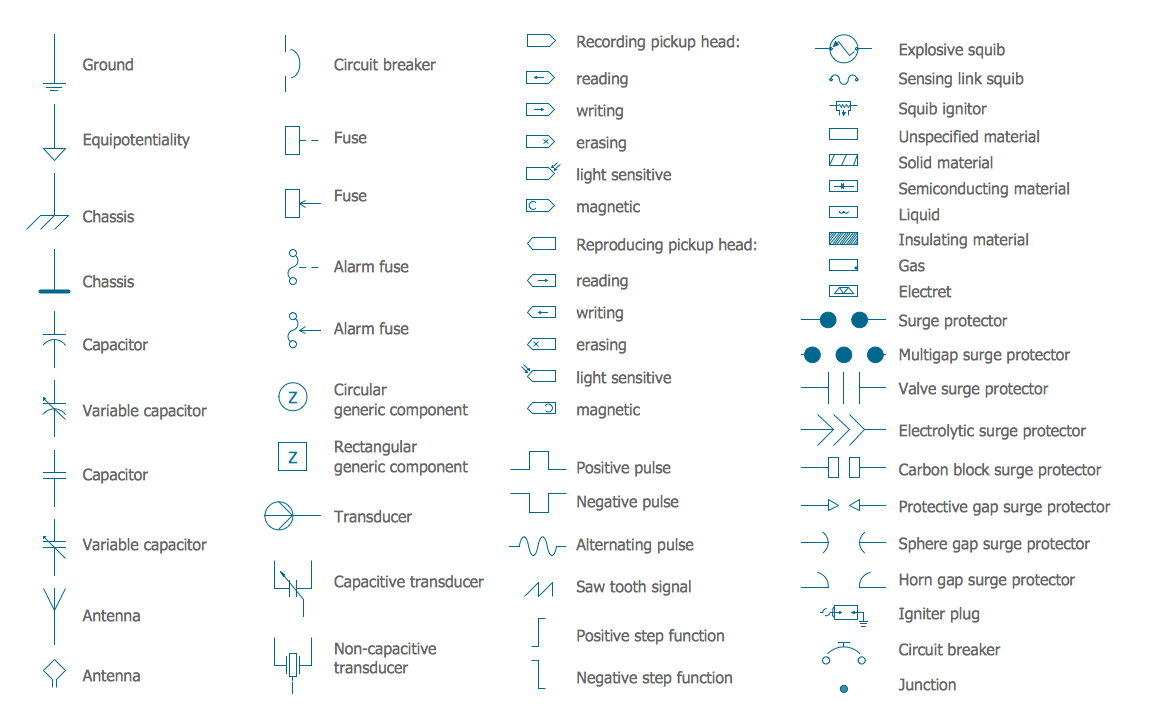
Picture: Electrical Circuits — Electrical Symbols
Related Solution:
Any information system receives data flows from external sources. In order to visualize them there is a list of data flow diagram symbols that describes how the system components cooperate. If you want to create a data flow diagram, ConceptDraw DIAGRAM Solution Park has DFD Library that contains both Yourdon and Gane-Sarson notations.
This figure shows the content of vector libraries, delivered with ConceptDraw solution for data flow diagram (DFD). There are three libraries composed from about 50 vector objects used to make data flow diagrams.
They include a complete set of objects utilized by Yourdon-Coad and Gane-Sarson notations - two primary notations that are apply for data flow diagramming. Also, one can discover additional "Data flow diagram (DFD)" library that provides a data flow diagram elements for designing level 1 and context-level data flow diagrams.
Picture: Data Flow Diagram Symbols. DFD Library
Related Solution:
Teams working with Scrum methodology use the product backlog items (PBIs), bug work item types (WITs), reports and dashboards. SCRUM Workflow solution for ConceptDraw DIAGRAM software offers collection of samples, variety of predesigned objects, clipart and graphic elements, a set of Scrum process work items and workflow which are developed for agile teams working using Scrum.
Picture: Scrum process work items and workflow
Related Solution:
Tool to draw Metro Map styled inforgraphics. London Tube map sample.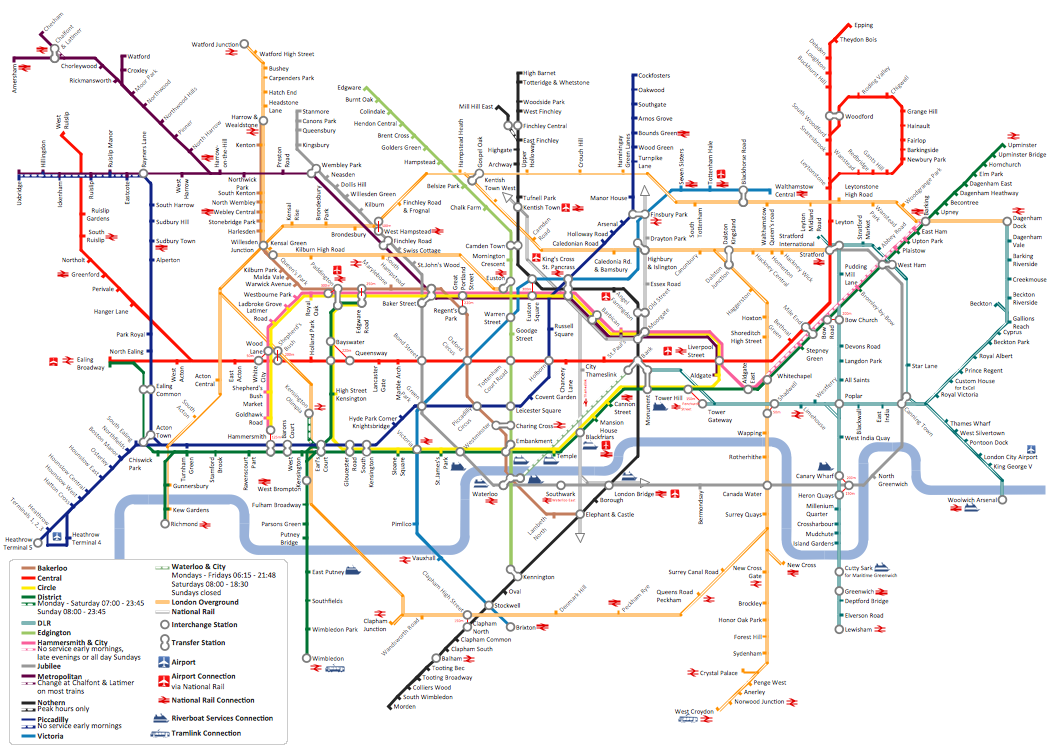
Picture: How to draw Metro Map style infographics? (London)
Related Solution:
An orgchart shows how the responsibilities are divided between departments. It’s enough to have just one look on a proper organizational chart template to understand the idea and how it works. To understand how it’s made you should use a diagramming software.
This organizational diagram illustrates the possibilities of using ConceptDraw DIAGRAM to create orgcharts. This sample represents the common project management company. The chart shows the structure of devisions in the company, and the interaction between them. Communication between departments imply a certain structure affiliation and reporting. At the head of the company - President. This diagram was created using ConceptDraw solution for designing Organizational charts of any structure and complexity.
Picture: Organizational Chart Template
Related Solution:
The network architecture and design specialization will help you gain the technical leadership skills you need to design and implement high-quality networks that support business needs.
Picture: Computer Network Architecture. Computer and Network Examples

