Business People Figures
Business people figures - Vector clipart libraryThe vector stencils library Business people figures is included in the Business and Finance solution from Illustration area of ConceptDraw Solution Park. Use it to quick draw illustrations, diagrams and infographics for your business documents, presentations and websites. The clipart library Business people figures includes 27 design elements:
|
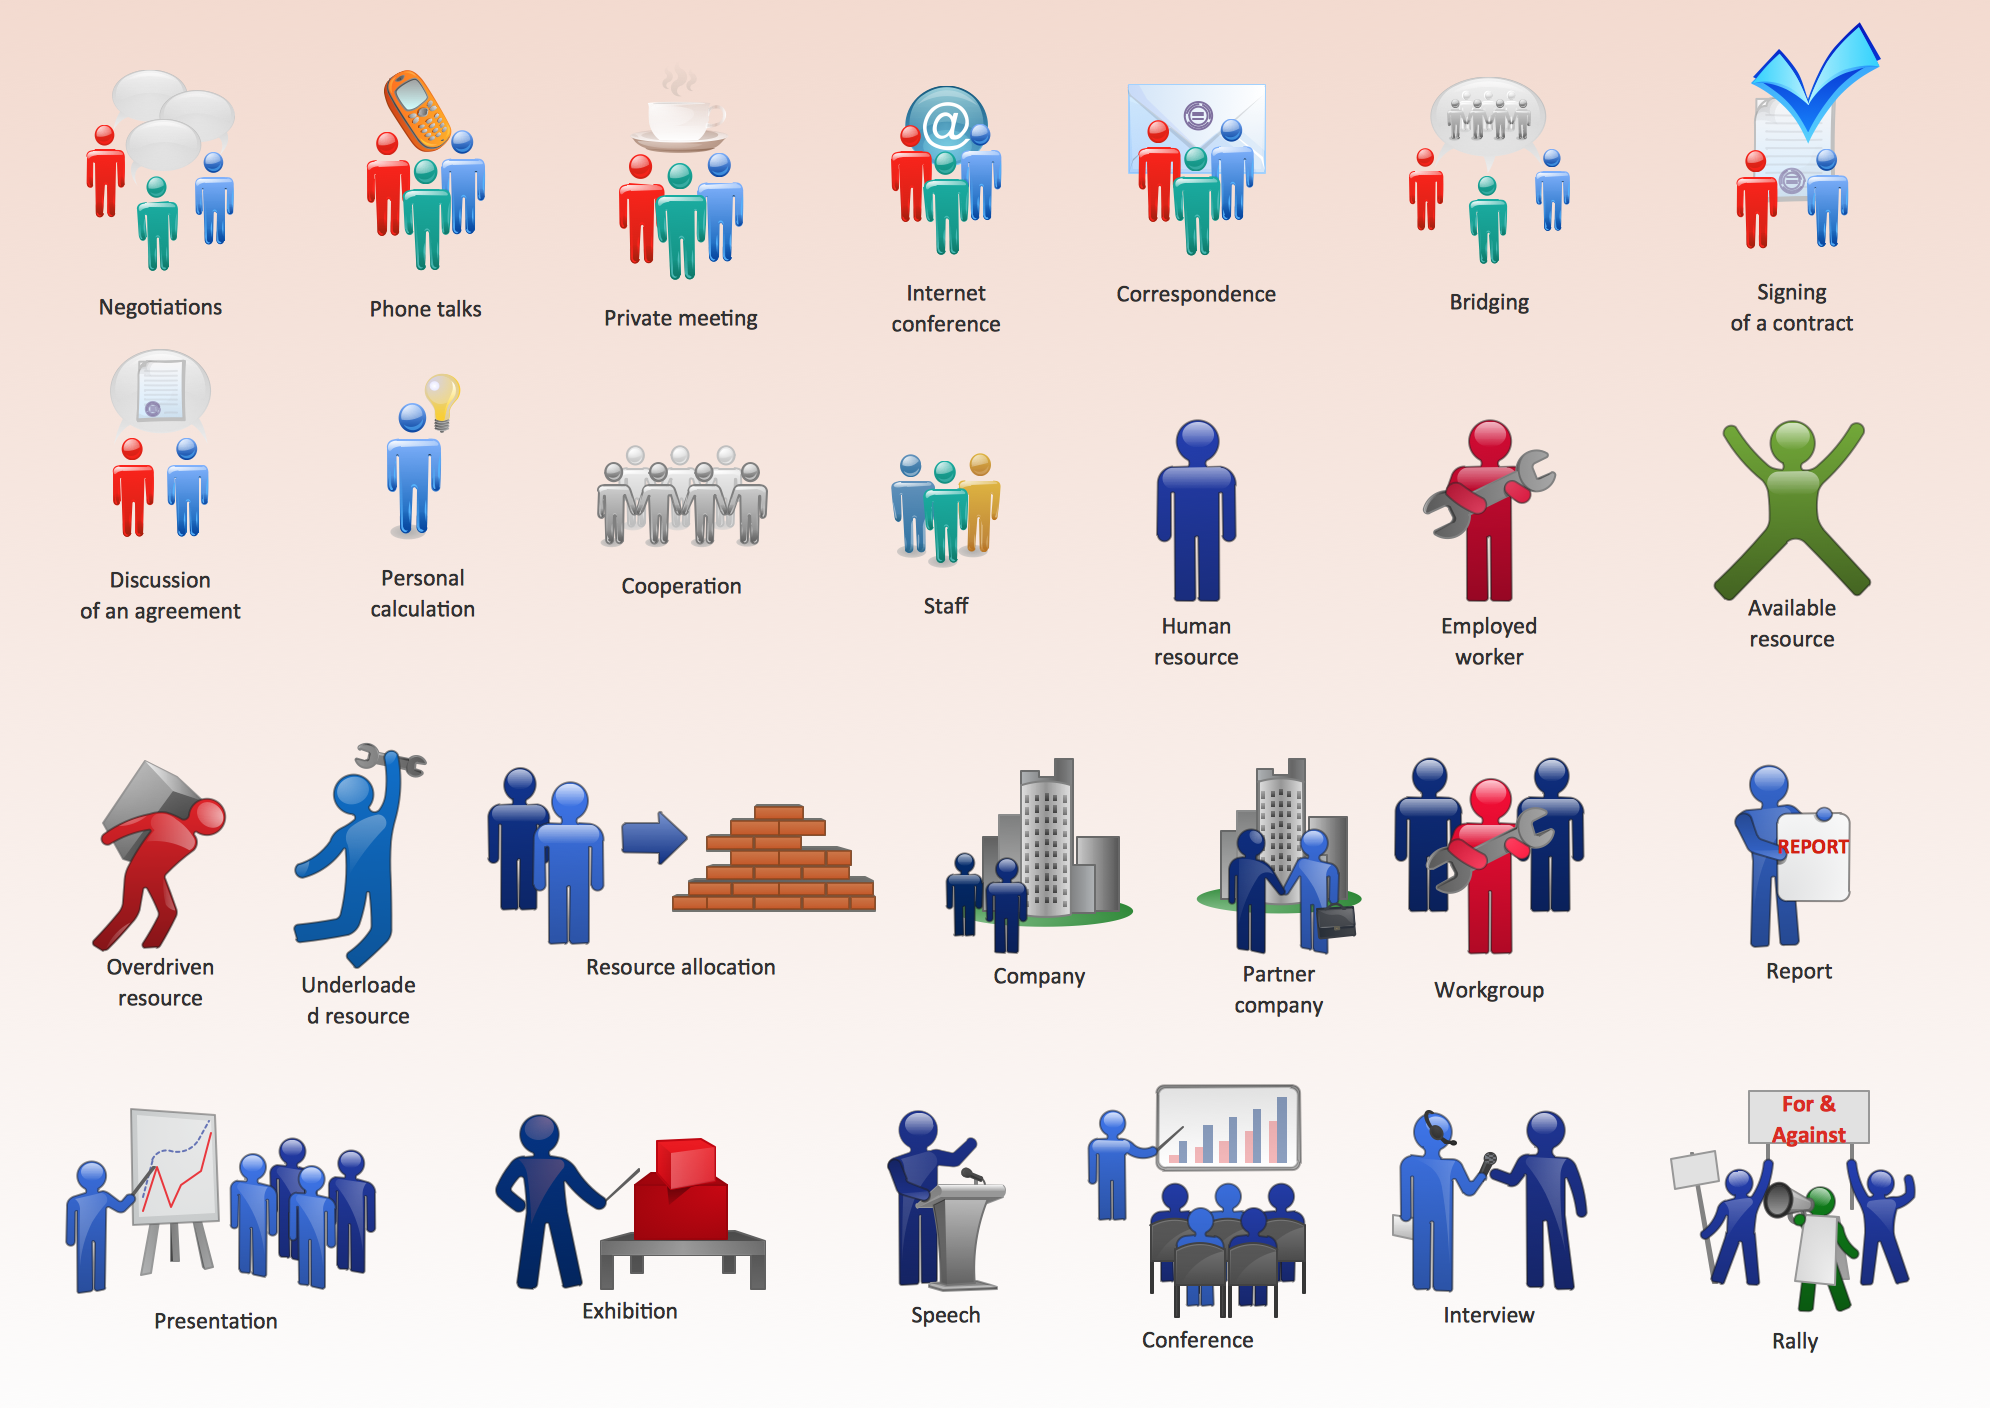
Pic.1 Business People Figures
See also Samples:
- Illustration - Aerospace and Transport
- Illustration - Artwork
- Illustration - Audio, video, media
- Illustration - Business and finance
- Illustration - Computers and communications
- Illustration - Manufacturing
- Illustration - Nature
- Illustration - People
- Illustration - Presentation clipart
- Illustration - Safety and security
- Science & Education — illustrations
TEN RELATED HOW TO's:
Need to draw a diagram, process chart, flowchart, organizational chart, graphic design? ConceptDraw can help you to make professional graphic documents quickly.
Picture: Best Diagramming
Related Solution:
The ConceptDraw vector stencils library Cisco WAN contains equipment symbols for drawing the computer wide area network diagrams.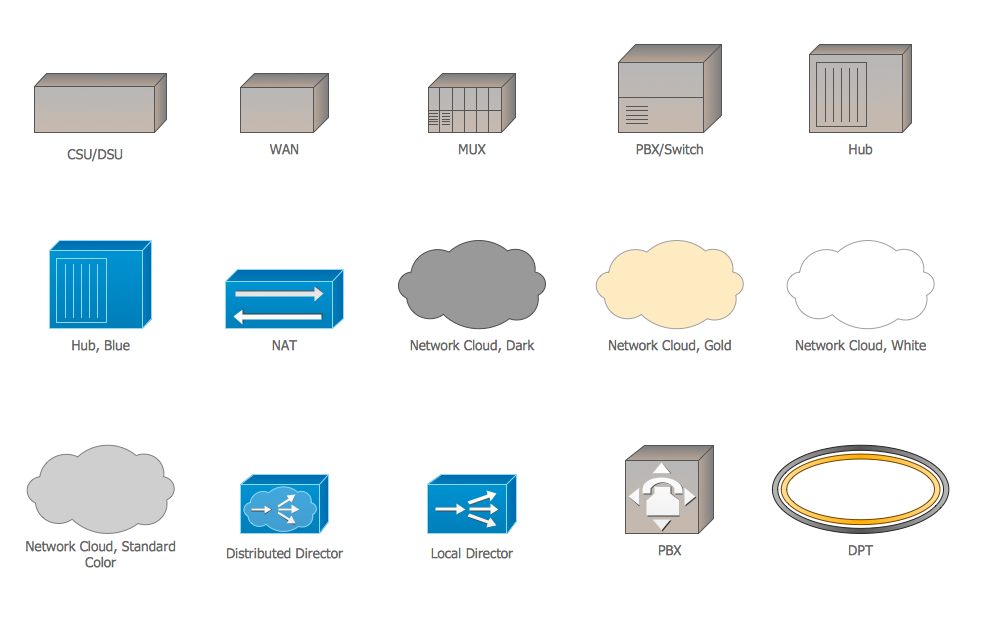
Picture: Cisco WAN. Cisco icons, shapes, stencils and symbols
Related Solution:
Many of us want to be able to create designs efficiently yet quickly. ConceptDraw DIAGRAM will help you to make awesome drawings without having to design all those Time Elements. These elements include graphs, symbols, cliparts, visual data representation and a whole lot of other stuff.
Picture: Time - Design Elements
Related Solution:
Workflow Diagram - workflow process diagram is a visual representation of a organizational process flow. Often it used as the same visual notation as process flow diagram. Visualising business processes using workflow diagram (workflow process diagram) allows estimate business process efficiency, analyse and optimize the process itself. Workflow diagram helps get focusing on each step and relations between workflow steps. ConceptDraw DIAGRAM is software for making workflow diagram. It contains specific designed graphics to draw workflow diagrams effectively. This is workflow diagram maker which do your work process effective.
Picture: Work Flow Process Chart
Related Solution:
The Nature Solution addition to ConceptDraw Solution Park for ConceptDraw DIAGRAM includes new libraries that provide a wide range nature objects and it can be used in many areas.
Picture: Drawing Illustration
This sample shows the Bar Chart of the leverage ratios for two major investment banks. The leverage ratio is the ratio of the total debt to the total equity; it is a measure of the risk taken by the bank. The higher of the leverage ratio denotes the more risk, the greater risks can lead to the subprime crisis.
Picture: Financial Comparison Chart
Related Solution:
ConceptDraw MINDMAP - an excellent tool for exporting mind maps to PowerPoint to visualize and presenting your project. You can simply generate, change, update your mindmap and then make a presentation in PowerPoint.
Picture: How To Do A Mind Map In PowerPoint
Related Solution:
To draw a good diagram of a business workflow you should have a ready-to-use set of pre-designed objects you may drag-and-drop to your document focusing on the workflow structure and meaning, not drawing tools. ConceptDraw DIAGRAM with Workflow Diagrams solution provides complete set of design element you may use to draw a good diagram of a business workflow.
Picture: How to Draw a Good Diagram of a Business Workflow?
Related Solution:
ConceptDraw DIAGRAM is a software for simplу depicting the business processes based on BPMN 2.0.
Business Process Diagrams Cross-Functional-Flowcharts, Workflows, Process Charts, IDEF0 and IDEF2, Timeline, Calendars, Gantt Charts, Business Process Modeling, Audit and Opportunity Flowcharts and Mind Maps (presentations, meeting agendas).
Picture: Business Process Modeling Notation
Related Solution:
ConceptDraw DIAGRAM is a powerful chemistry drawing software that provides the useful tools to help you design all kinds of chemistry drawings and illustrations, chemical schemes and diagrams of formulas, reaction schemes and lab set-ups of any complexity.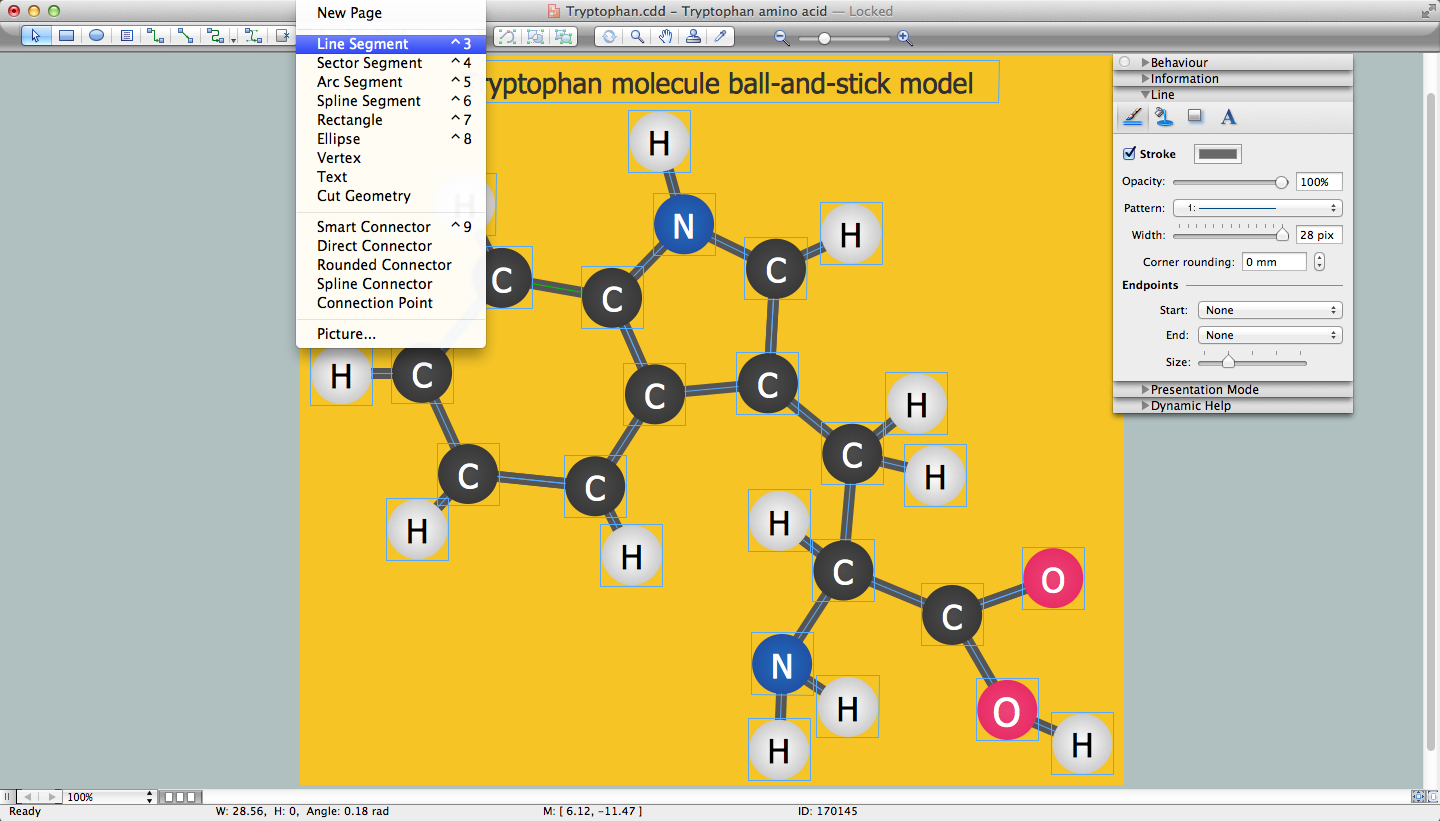
Picture: Chemistry Drawing Software
Related Solution:
ConceptDraw
DIAGRAM 18