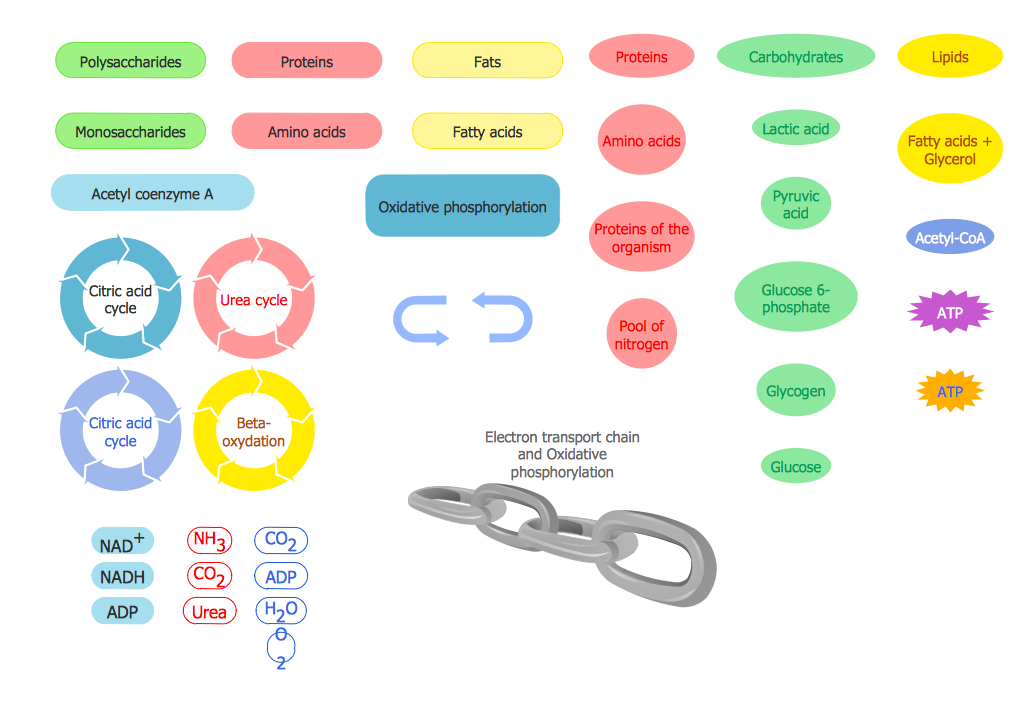
Sample 1. Biology symbols – Biochemistry of Metabolism Library Design Elements
Biochemistry of Metabolism library from the Biology solution contains 46 vector shapes.

Sample 2. Biology symbols – Carbohydrate Metabolism Library Design Elements
Carbohydrate Metabolism Library from the Biology solution contains 25 vector objects.
 Library")
Sample 3. Biology symbols – Citric Acid Cycle (TCA Cycle) Library Design Elements
Citric Acid Cycle (TCA Cycle) Library from the Biology solution contains 26 vector biology symbols.

Sample 4. Biology solution – TCA Cycle
This sample was created in ConceptDraw DIAGRAM using the biology symbols from the libraries of Biology Solution. It shows the TCA Cycle (tricarboxylic acid cycle, or citric acid cycle) – series of chemical reactions for aerobic organisms. An experienced user spent 15 minutes creating this sample.
The biology illustrations and drawings designed with ConceptDraw DIAGRAM are vector graphic documents and are available for reviewing, modifying, converting to a variety of formats (image, HTML, PDF file, MS PowerPoint Presentation, Adobe Flash or MS Visio), printing and send via e-mail in one moment.
NINE RELATED HOW TO's:
ConceptDraw PROJECT is an effective tool for new and experienced users with a fine balance of usability and powerful functionality.
Picture: ConceptDraw PROJECT Software Overview
ConceptDraw DIAGRAM is a powerful diagramming and vector drawing GUI software. Extended with Mac OS User Interface solution from the Software Development area, ConceptDraw DIAGRAM is the best software for designing professional looking user interfaces for new OS X 10.10 Yosemite operating system developed for Macintosh computers. Mac OS User Interface solution offers you large quantity of Mac OS templates, samples and user interface design examples.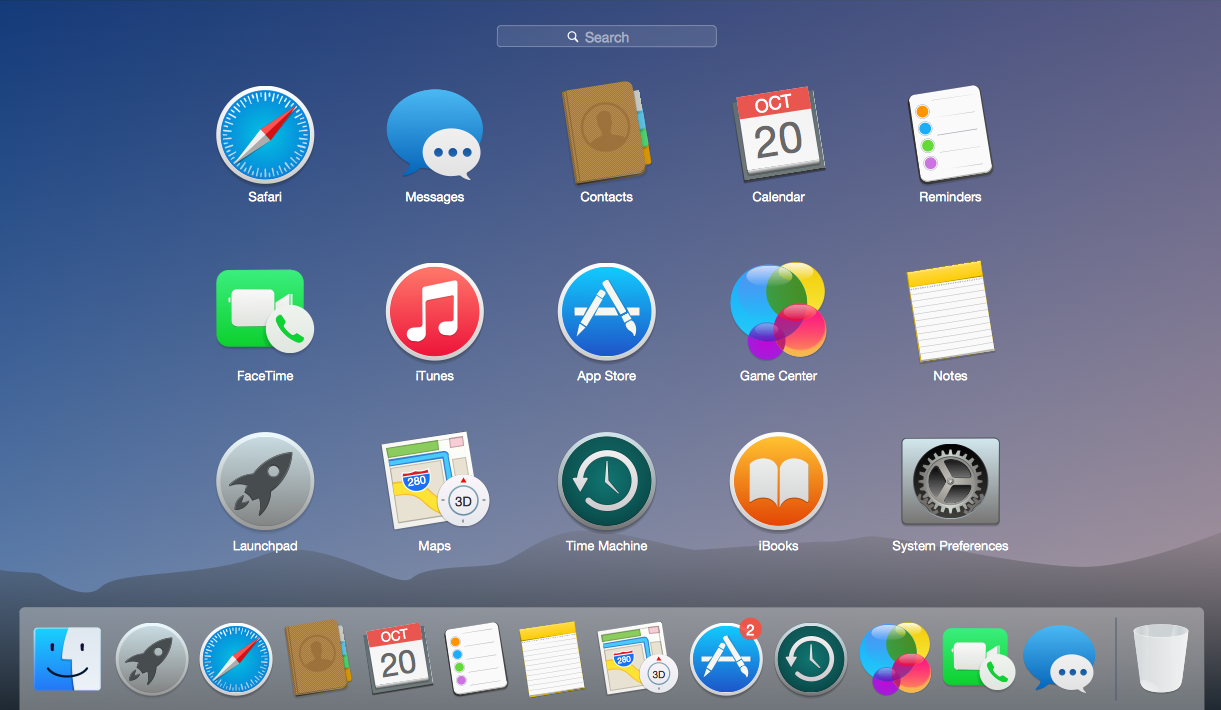
Picture: Mac OS User Interface Design Examples
Related Solution:
Nodes of any computer network are somehow organized in a hierarchy or a layout. Some of the common layouts like star network topology are more reliable and some like ring topology withstand high loads better. It is also important to distinguish logical topologies from physical.
This diagram represents a typical view of the star network topology. The star network topology is one of the most frequently used network topologies in the majority of office and home networks. It is very popular because of its low cost and the easy maintenance. The plus of the star network topology is that if one computer on the local network is downed, this means that only the failed computer can not send or receive data. The other part of the network works normally. The minus of using star network topology is that all computers are connected to a single point-switch, or hub. Thus, if this equipment goes down, the whole local network comes down.
Picture: Star Network Topology
Related Solution:
Describing a workflow or approval process can take hours and be too complicated, especially since there are options to do it quickly and vividly. Diagrams called flowcharts replace long paragraphs of boring text and represent information in a graphic way. You can draw one on paper or you can use flowchart software to do it quickly and scalable. This kind of software is easy to use and you don’t need any special skills to start using it. In addition, there are a lot examples and predesigned templates on the Internet.
Flowcharts are a best tool for staking out a huge and complex process into some small readable parts. Surely, flowcharts can be drawn manually but the use of standard symbols that make it clear for a wide audience makes a software tool preferred for this task. The core for a successful flowchart is its simplicity. That is why often before beginning making flowchart through software, people draw the sketch on a piece of paper. Designing an effective flowchart means the combination of the data needed to be shown and the simplicity with which you depict it.
Picture: Flowchart Software: A Comprehensive Guide
Related Solution:
Using the ConceptDraw DIAGRAM software you will find it really simple to design thematic maps.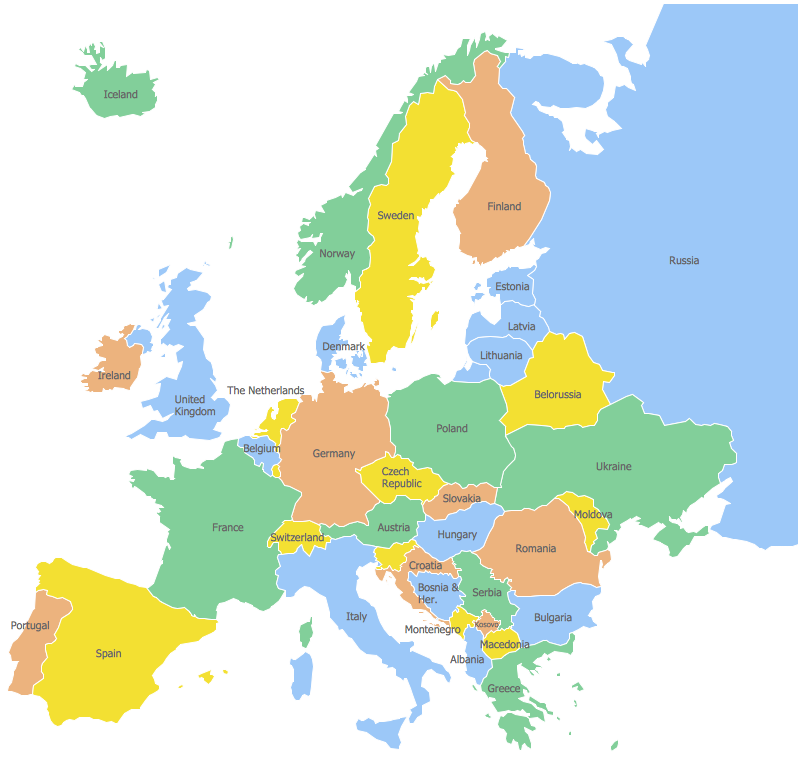
Picture: Geo Map — Europe
Related Solution:
When talking about engineering, one should define all the terms used, so anybody could understand the topic. Typical network glossary contains definitions of numerous network appliances, types of networks and cable systems. The understanding of basic is crucial for server management, network administration and investigating problems.
The network glossary defines terms related to networking and communications. The most of glossary items has their visual representation in ConceptDraw DIAGRAM libraries of the Computer Network Diagrams solution. This illustration presents a local area network (LAN) diagram. It designed to show the way the interaction of network devices in a local network. The diagram uses a library containing symbols of network equipment, connections and the end-point devices such as network printer, hubs, server, modem and finally computers (PC, mac, laptop). This diagram depicts a physical LAN topology.
Picture: Network Glossary Definition
Related Solution:
How to draw pictorial chart quick, easy and effective? ConceptDraw DIAGRAM offers the unique Pictorial Infographics Solution that will help you!
Pictorial Infographics solution contains large number of libraries with variety of predesigned vector pictograms that allows you design infographics in minutes. There are available 10 libraries with 197 vector pictograms.
Picture: How to Draw Pictorial Chart. How to Use Infograms
Related Solution:
It is impossible to imagine mechanical engineering without drawings which represent various mechanical schemes and designs. ConceptDraw DIAGRAM diagramming and vector drawing software supplied with Mechanical Engineering solution from the Engineering area of ConceptDraw Solution Park offers the set of useful tools which make it a powerful Mechanical Drawing Software.
Picture: Mechanical Drawing Software
Related Solution:
SWOT analysis is an effective method of business planning, the question is how to do it. The most obvious way is to make a SWOT analysis in a Word document, which is not very convenient. Luckily, you can use software like ConceptDraw DIAGRAM that has features and templates made especially for SWOT analyzing.
A SWOT Analysis is a manager's means of the strategic planning. It is used to define and classify considerable internal moments (strengths and weaknesses) and external forces (opportunities and threats) a business faces. You can use ConceptDraw MINDMAP to determine and organize factors utilized for SWOT analysis, and represent them in the SWOT matrix using ConceptDraw DIAGRAM. Using mind maps empowers you to explore and rank a lot of data engaged for SWOT analysis as well as recognize the relations between various pieces of information.
Picture: How to Make SWOT Analysis in a Word Document
Related Solution:

 Library")
