Management - Design Elements
Management - Vector clipart libraryThe vector stencils library Management is included in the Business and Finance solution from Illustration area of ConceptDraw Solution Park. Use it to quick draw illustrations, diagrams and infographics for your management and business documents, presentations and websites. The clipart library Management includes 22 concept and metaphor images:
|
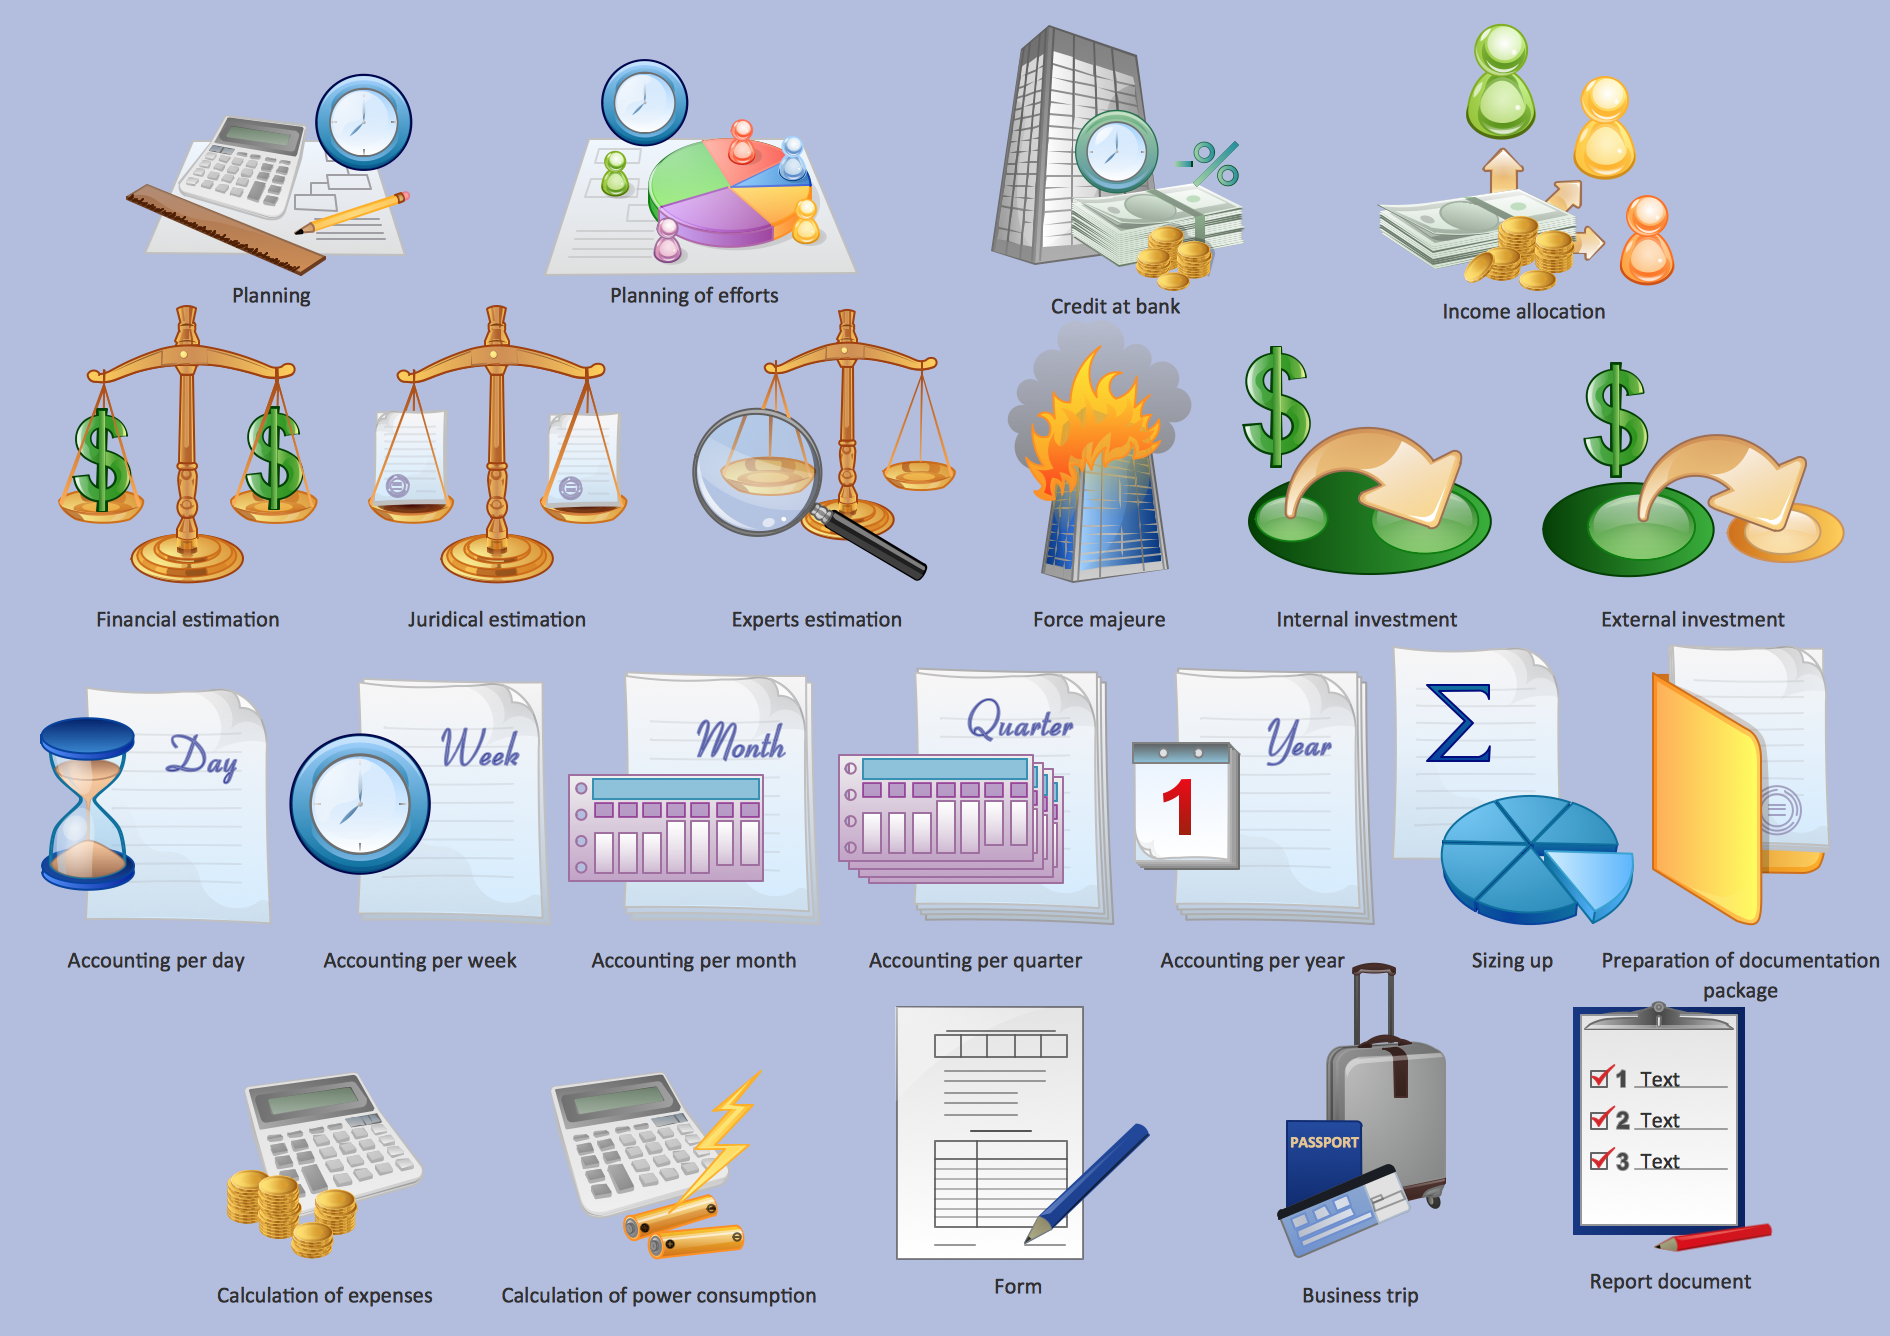
Pic.1 Management - Design Elements
See also Samples:
- Illustration - Aerospace and Transport
- Illustration - Artwork
- Illustration - Audio, video, media
- Illustration - Business and finance
- Illustration - Computers and communications
- Illustration - Manufacturing
- Illustration - Nature
- Illustration - People
- Illustration - Presentation clipart
- Illustration - Safety and security
- Science & Education — illustrations
TEN RELATED HOW TO's:
When it comes to system construction, a class diagram is the most widely used diagram. UML Class Diagrams is a type of static structure diagram that is used for general conceptual modeling of the systematics of the application. Such a diagram would illustrate the object-oriented view of a system. The object orientation of a system is indicated by a class diagram. It describes the structure of a system by showing the general issues,classes of a system, attributes, operations, interfaces, inheritance, and the relationships between them.
Picture: UML Class Diagram Notation
Related Solution:
When thinking about the process of decision making, it's easy to imagine it as a pyramid. We will look at a three level pyramid model as an example. Operational decisions are first that come to mind, and it's the first level. Tactical and strategic decisions are the second and the third levels.
Pyramid (triangle) diagrams are used to show some hierarchical data. Because to the pyramid form of diagram, each diagram slice has a different width. The width of each segment depends on its hierarchical level.
The current image illustrates the model of information system types. Most graphically the model can be represented as a three level pyramid. The first level shows a system of transaction processing It is concentrated on operational tasks. The second level is devoted to tactical solutions of the information system management. And at least, the third level addresses strategy and represents the executive information system. This three level pyramid sample is supplied with the ConceptDraw Pyramid Diagrams solution from Marketing area of ConceptDraw Solution Park.
Picture: Pyramid Diagram
Related Solutions:
The Time-Money-Quality Triangle illustrates an advertising truism, that you can't have all three.
Picture: Pyramid Diagram
Related Solutions:
The recruitment process often requires design and use of various HR flowcharts, diagrams, attractive illustrations.
Picture: Recruitment
Related Solution:
A transistor is a semiconductor device used to amplify or switch electronic signals and electrical power. It is composed of semiconductor material usually with at least three terminals for connection to an external circuit. A voltage or current applied to one pair of the transistor's terminals changes the current through another pair of terminals. Because the controlled (output) power can be higher than the controlling (input) power, a transistor can amplify a signal. Today, some transistors are packaged individually, but many more are found embedded in integrated circuits.
26 libraries of the Electrical Engineering Solution of ConceptDraw DIAGRAM make your electrical diagramming simple, efficient, and effective. You can simply and quickly drop the ready-to-use objects from libraries into your document to create the electrical diagram.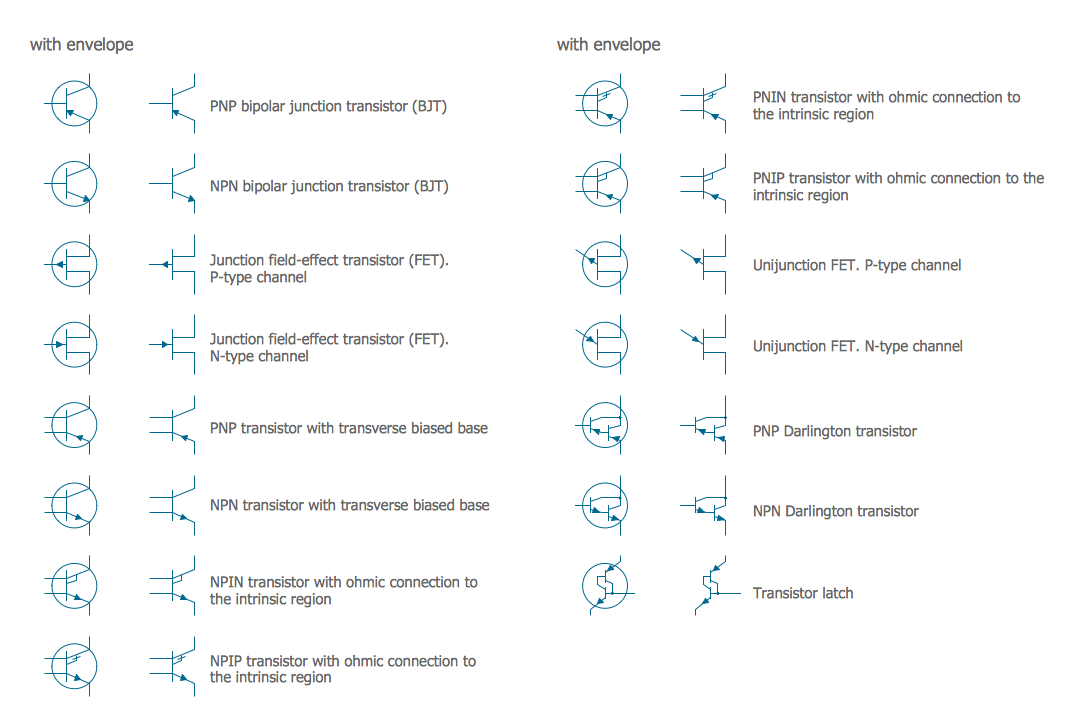
Picture: Electrical Symbols — Transistors
Related Solution:
ConceptDraw Business Finance Illustration examples and libraries contain vector clip art for drawing different Business and Finance Illustrations. You may find Advertising example, Project Management example, Business Model example and many more.
Picture: Business and Finance Illustrations Example
Related Solution:
The digital communication is a physical transfer of the data over a point-to-point or point-to-multipoint communication channel. Channels can be copper wires, optical fibres, wireless communication channels, etc. The data are realized as electromagnetic signals (radiowave, microwave, electrical voltage, etc.).
This example was created in ConceptDraw DIAGRAM using the Computer and Networks Area of ConceptDraw Solution Park and shows the Digital Communication Network diagram.
Picture: Digital Communications Network. Computer and Network Examples
Related Solution:
Purchasing Workflow Chart as a methods for documenting accounting information systems. Symbols and Methods for designing Accounting System.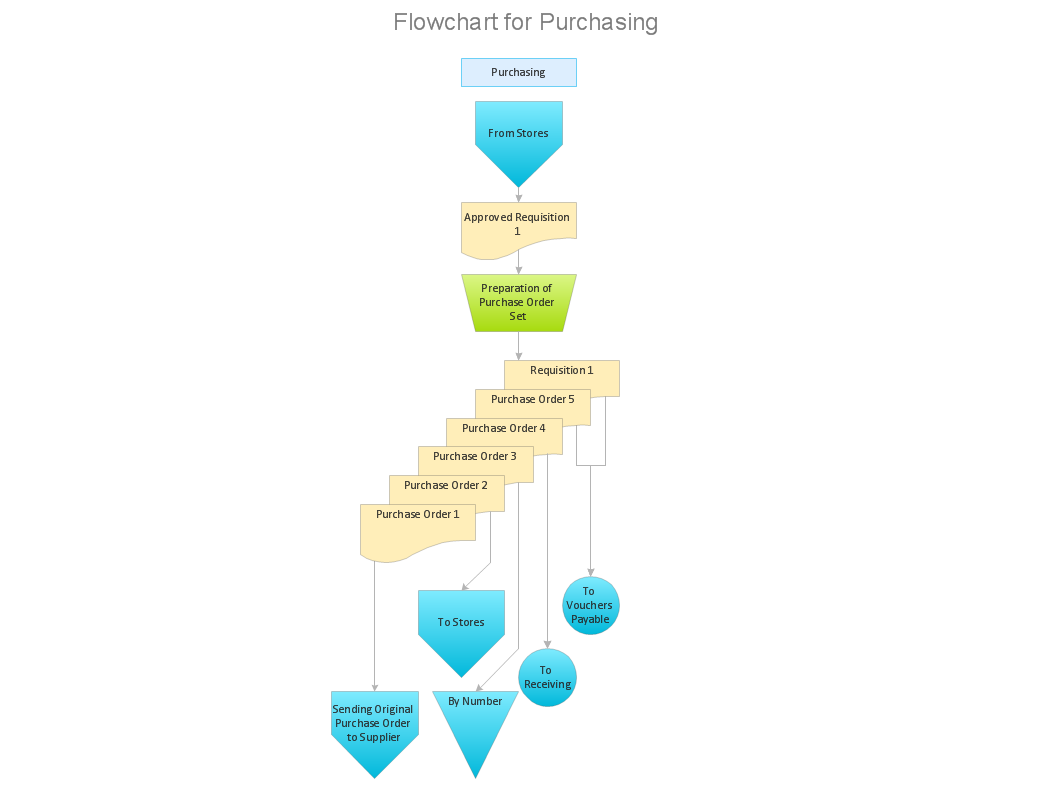
Picture: Workflow to Make a Purchase.Accounting Flowchart Example
Related Solution:
Learn what a workflow diagram is, how it works, when to use it, and how to create one. See examples, handoffs, approval flows, and workflow diagram best practices.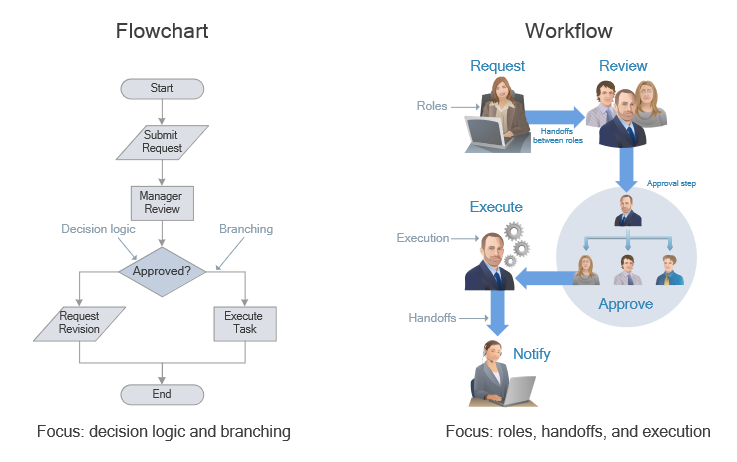
Picture: Workflow Diagram: Definition, Examples, and How to Create
Related Solution:
The ConceptDraw DIAGRAM is a good flow chart app for Mac. Numerous vector stencils, samples and templates created by designers allows you to draw any type of flowchart.
Picture: Good Flow Chart app for Mac
Related Solution:
ConceptDraw
DIAGRAM 18