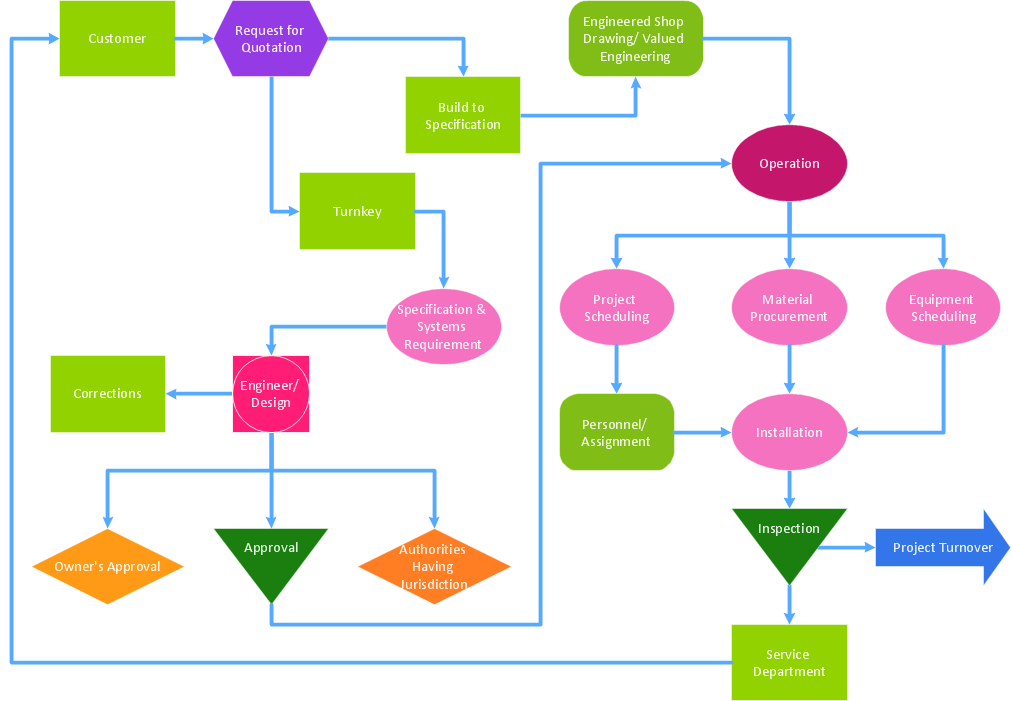
Pic.1 TQM diagram: Business process.
This diagram was created in ConceptDraw DIAGRAM using the TQM library from the Total Quality Management (TQM) Diagrams solution. An experienced user spent 5 minutes creating this sample.
Using ConceptDraw DIAGRAM connectors to create TQM diagram is an intuitive and time-saving solution. This example shows a business process diagram that can be then analyzed for ways to improve the process effectiveness and diagnose quality issues that require resolution.
See also Samples:
TEN RELATED HOW TO's:
ConceptDraw DIAGRAM extended with Typography Infographics Solution from the “Infographics” Area is the best Infographic Generator. Make sure in it right now!
Typography Infographics Solution offers you the best numerous collection of predesigned infographics examples and 9 libraries with large quantity of ready-to-use vector stencils that will help you design your own Typography Infographics of any complexity in minutes..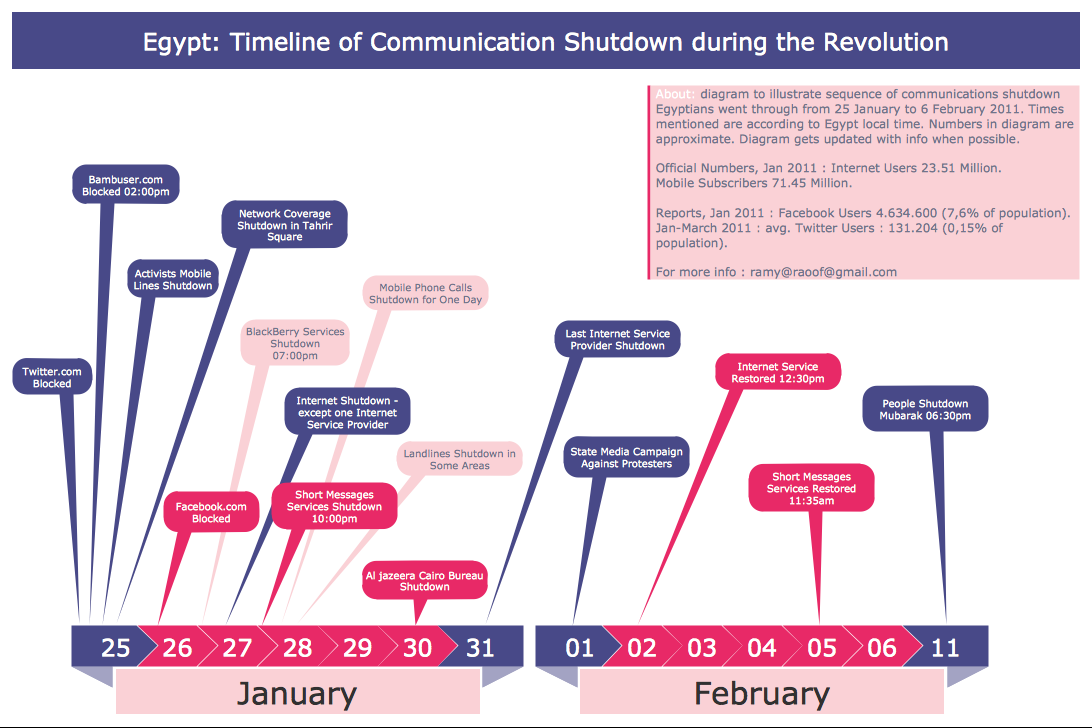
Picture: Infographic Generator
Related Solution:
Don't let your first glance fool you. ConceptDraw is a lot easier to use than it looks. Use its cross-functional templates and library as basics to get started.
All you need to know are a few basic steps and terms.
ConceptDraw Arrows10 Technology is a new age in drawing software. Use it for process flows and its new rapid draw feature enables to draw an impressive charts in a seconds.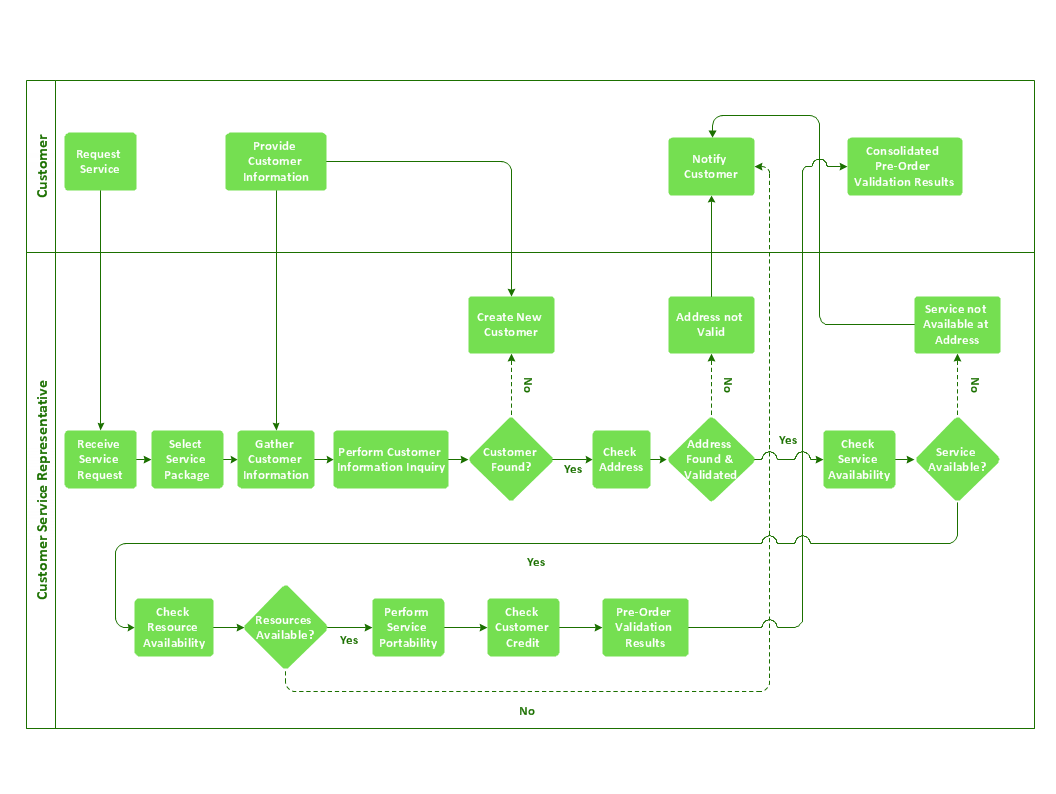
Picture: Cross-Functional Flowchart Basics
The Value Stream Mapping solution extends ConceptDraw DIAGRAM software with a new library that contain vector objects, samples and templates.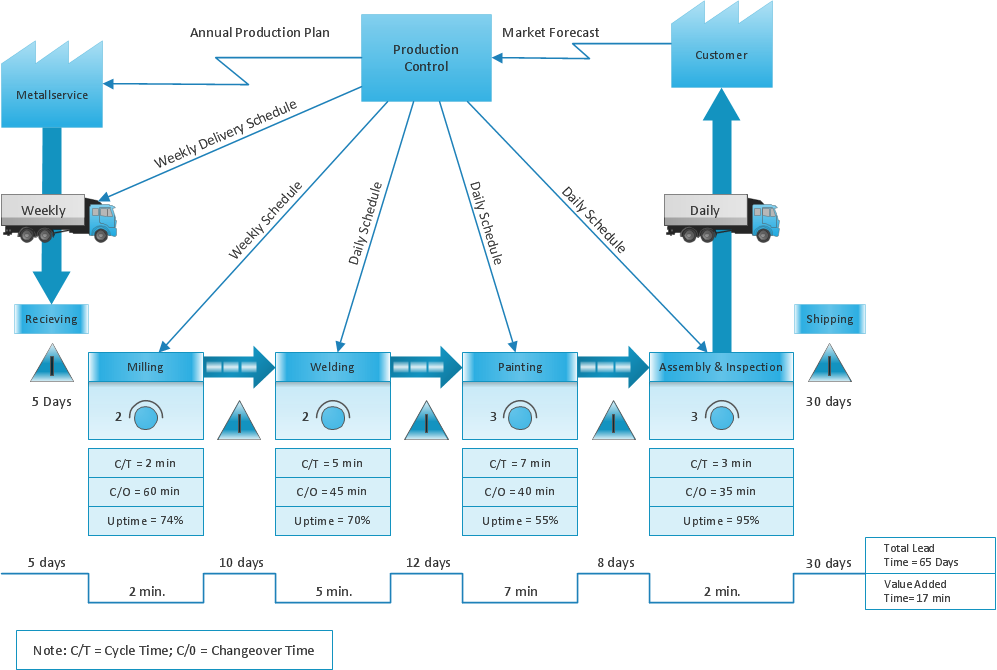
Picture: Sections of the Value Stream Map
Related Solution:
The Flowcharts are widely used in engineering, architecture, science, analytics, government, politics, business, marketing, manufacturing, administration, etc.
Picture:
Flowchart of Products
Flowchart Examples
Related Solution:
ConceptDraw the easy flowchart software that gives users the ability to draw any type of flowcharts. Fast visualization of the structured data with the vector stencils from object libraries by using RapidDraw technology.
Picture: Easy Flowchart Software
Related Solution:
ConceptDraw DIAGRAM software supplied with HR Flowcharts Solution can effectively help in labour-intensive process of human resource development.
Picture: Human Resource Development
Related Solution:
You can describe your own quality processes, brainstorm, and structure quality issues; then you can easily and quickly present it to your team.
Quality Management Mind Maps - Presentations, Meeting Agendas, Problem will be solved.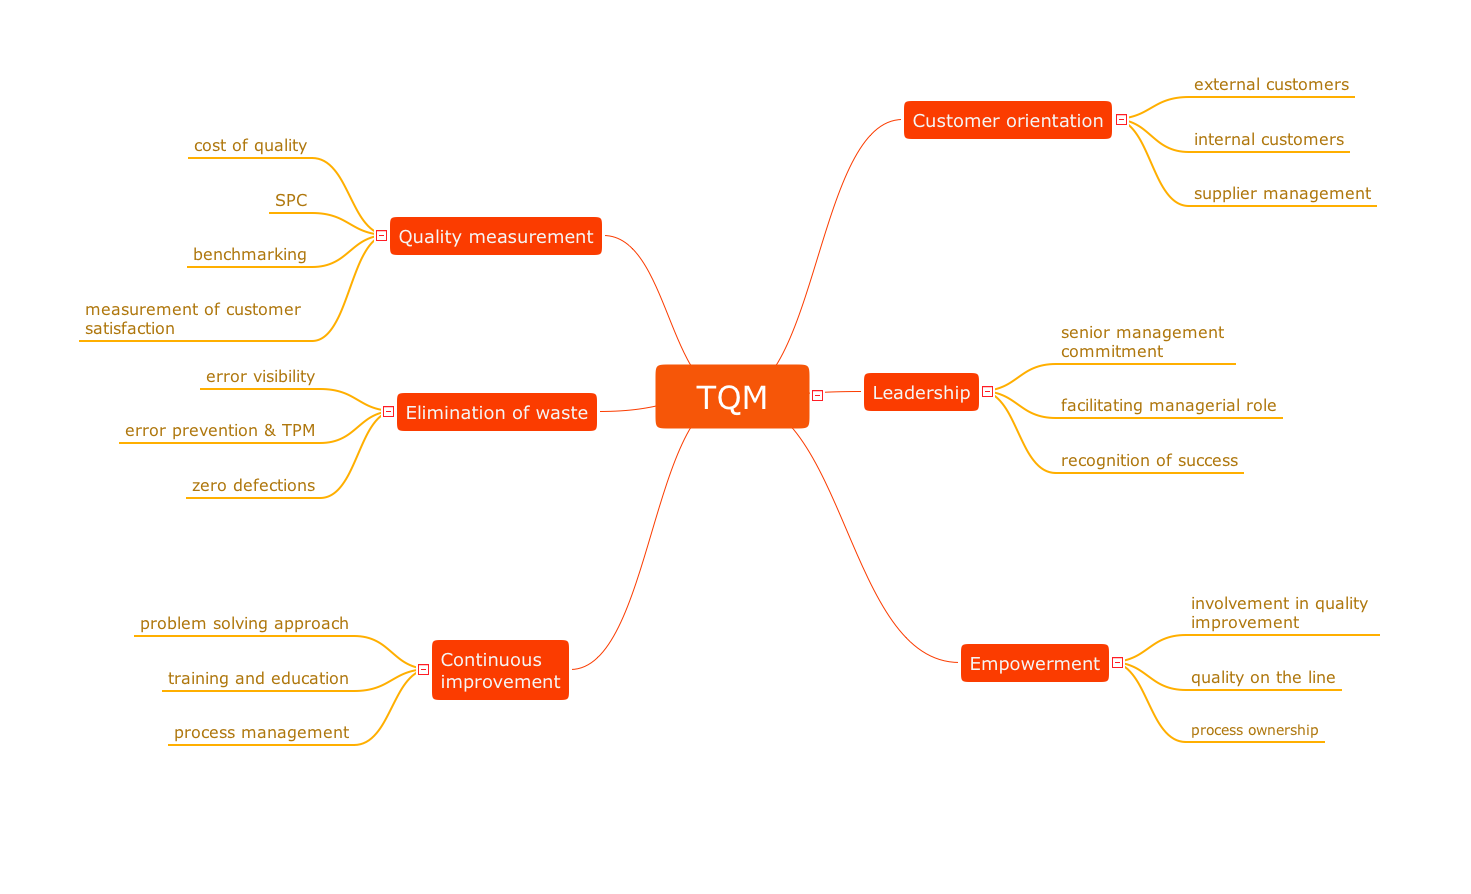
Picture: Why do you need the quality management for the organization
Related Solution:
Successful quality management implemented in a company of any size is a critical component of a company’s organization.
You can use mind maps for a complete quality process analysis, giving more visibility to the focal points that you need to get clear.
Picture: Successful Quality Management
Related Solution:
This sample was created in ConceptDraw DIAGRAM diagramming and vector drawing software using the Bar Graphs Solution from Graphs and Charts area of ConceptDraw Solution Park. It is Bar Graphs example, Sales Growth example, Column Chart Example - Sales Report.
Picture: Sales Growth. Bar Graphs Example
Related Solution:
Electrical Engineering Solution used together with ConceptDraw DIAGRAM drawing facilities makes short a work of drawing various electrical and electronic circuit schemes. A library of vector objects composed from symbols of Analog and Digital Logic elements of electric circuit includes 40 symbolic images of logic gates, bistable switches of bi-stable electric current, circuit controllers, amplifiers, regulators, generators, etc. All of them can be applied in electronic circuit schemes for showing both analog and digital elements of the circuit.
Electrical Engineering Solution used together with ConceptDraw DIAGRAM drawing facilities makes short a work of drawing various electrical and electronic circuit schemes. A library of vector objects composed from symbols of Analog and Digital Logic elements of electric circuit includes 40 symbolic images of logic gates, bistable switches of bi-stable electric current, circuit controllers, amplifiers, regulators, generators, etc. All of them can be applied in electronic circuit schemes for showing both analog and digital elements of the circuit.
Picture:
Electrical Diagram Symbols F.A.Q.
How to Use Electrical ConceptDraw Diagram Software
Related Solution: