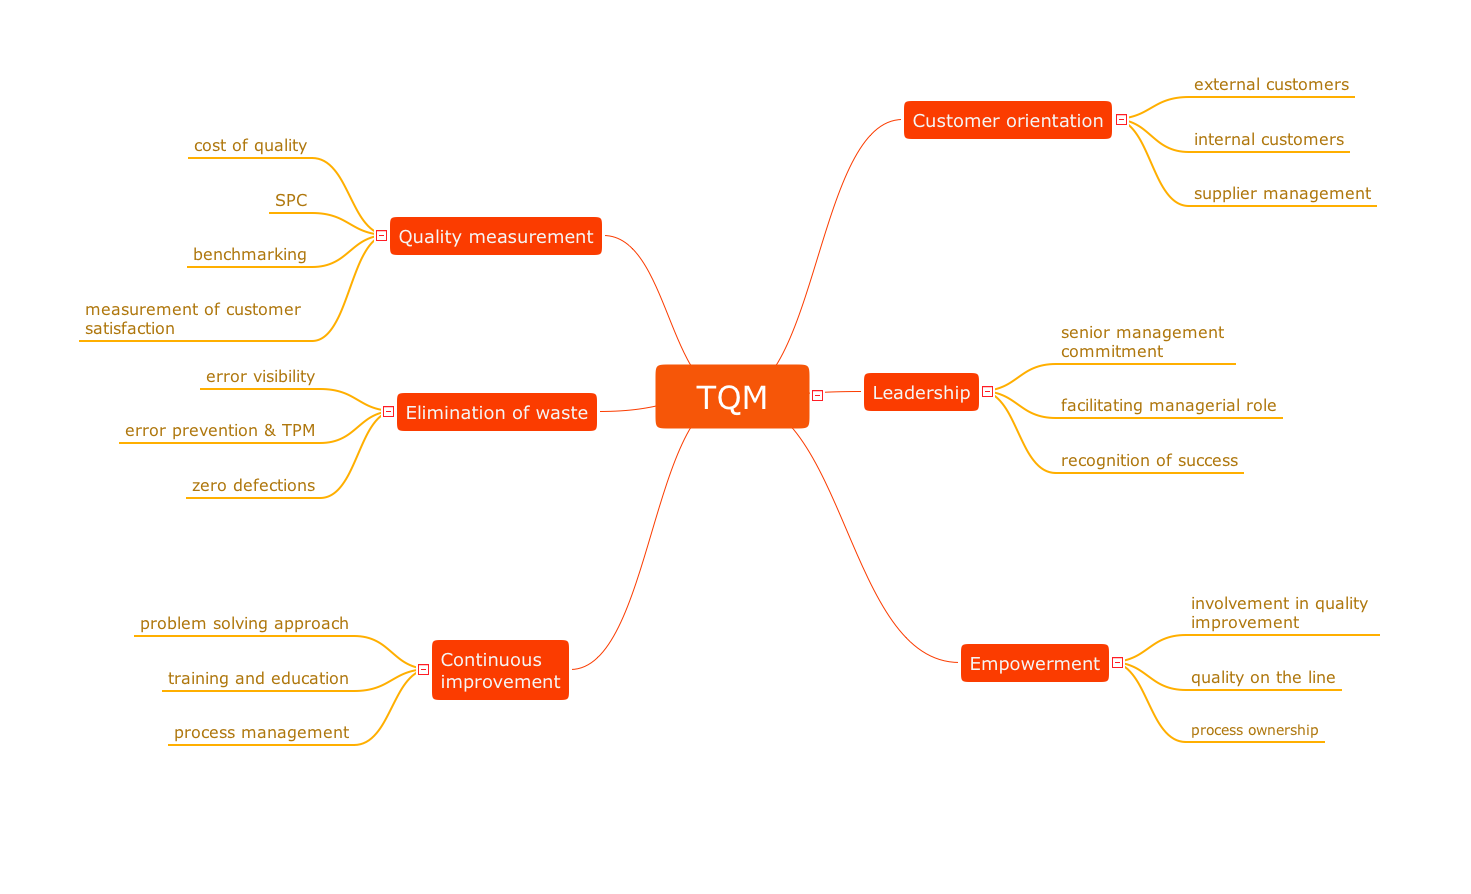
This mind map was created in ConceptDraw MINDMAP and it is available as a part of the Quality Mind Map Solution.
This mind map demonstrates how well-known Total Quality Management (TQM) methodology can be represented in a mind map. Using mind mapping for quality management is a creative approach that allows one to structure all key quality points on the one page.
TEN RELATED HOW TO's:
The Total Quality Management Diagram solution helps your organization visualize business and industrial processes. Create Total Quality Management diagrams for business process with ConceptDraw software.
Picture: Definition TQM Diagram
Related Solution:
The Total Quality Management Diagram solution helps your organization visualize business and industrial processes. Create Total Quality Management diagrams for business process with ConceptDraw software.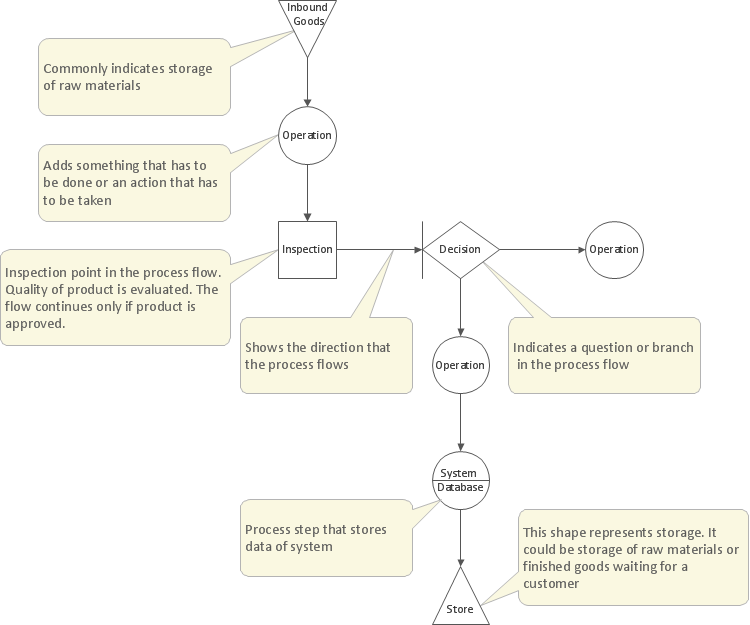
Picture: Create TQM Flowcharts for Mac
Related Solution:
ConceptDraw Value Stream Mapping solution extends software with templates, samples and vector shapes for drawing Value Stream Maps (VSM).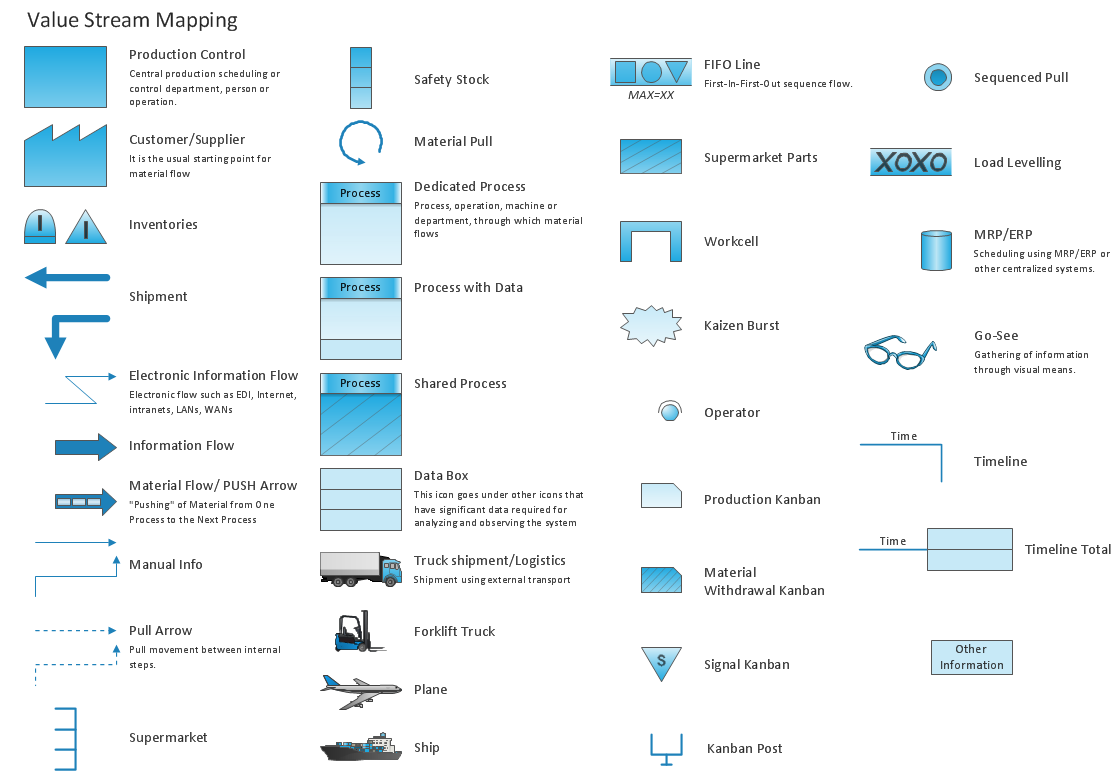
Picture: Standard Shapes for Value Stream Mapping
Related Solution:
Using Skype for Business will let you control teams and deliver information worldwide in a real-time. This is an important tool for everyday work.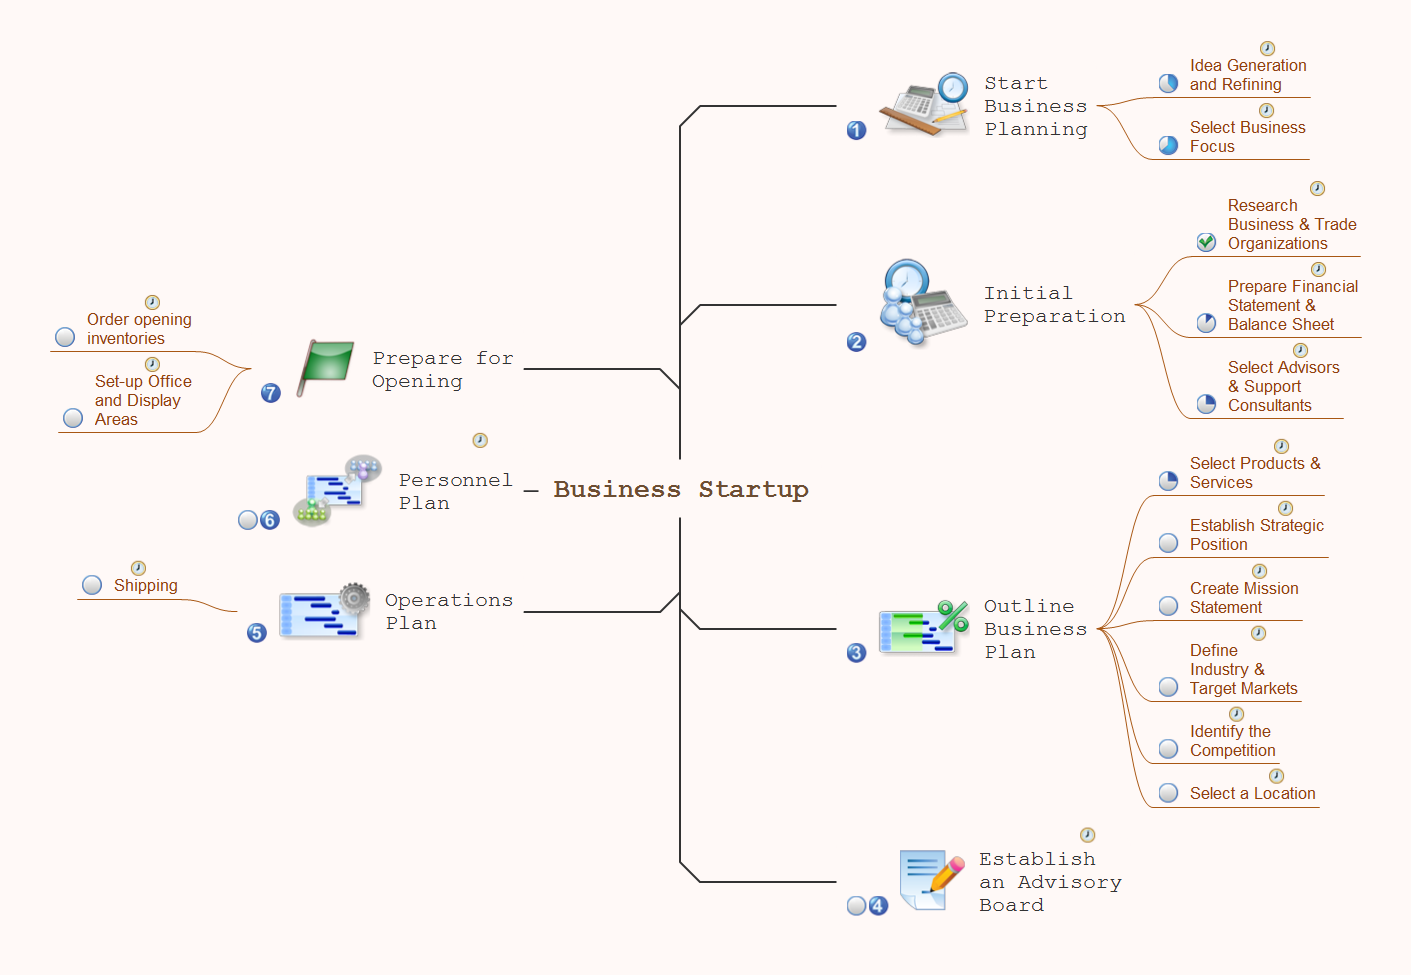
Picture: How To Use Skype for Business
Related Solution:
ConceptDraw DIAGRAM diagramming and vector drawing software extended with Seven Basic Tools of Quality solution from the Quality area of ConceptDraw Solution Park provides effective tools for quality control and helps design any types of quality-related diagrams.
Picture: Seven Basic Tools of Quality — Quality Control
Related Solution:
Quality Management Mind Maps - Presentations, Meeting Agendas, Problem will be solved.
The visual form of mind maps is helpful in all stages of quality management, from describing problem to describing and documenting a decision.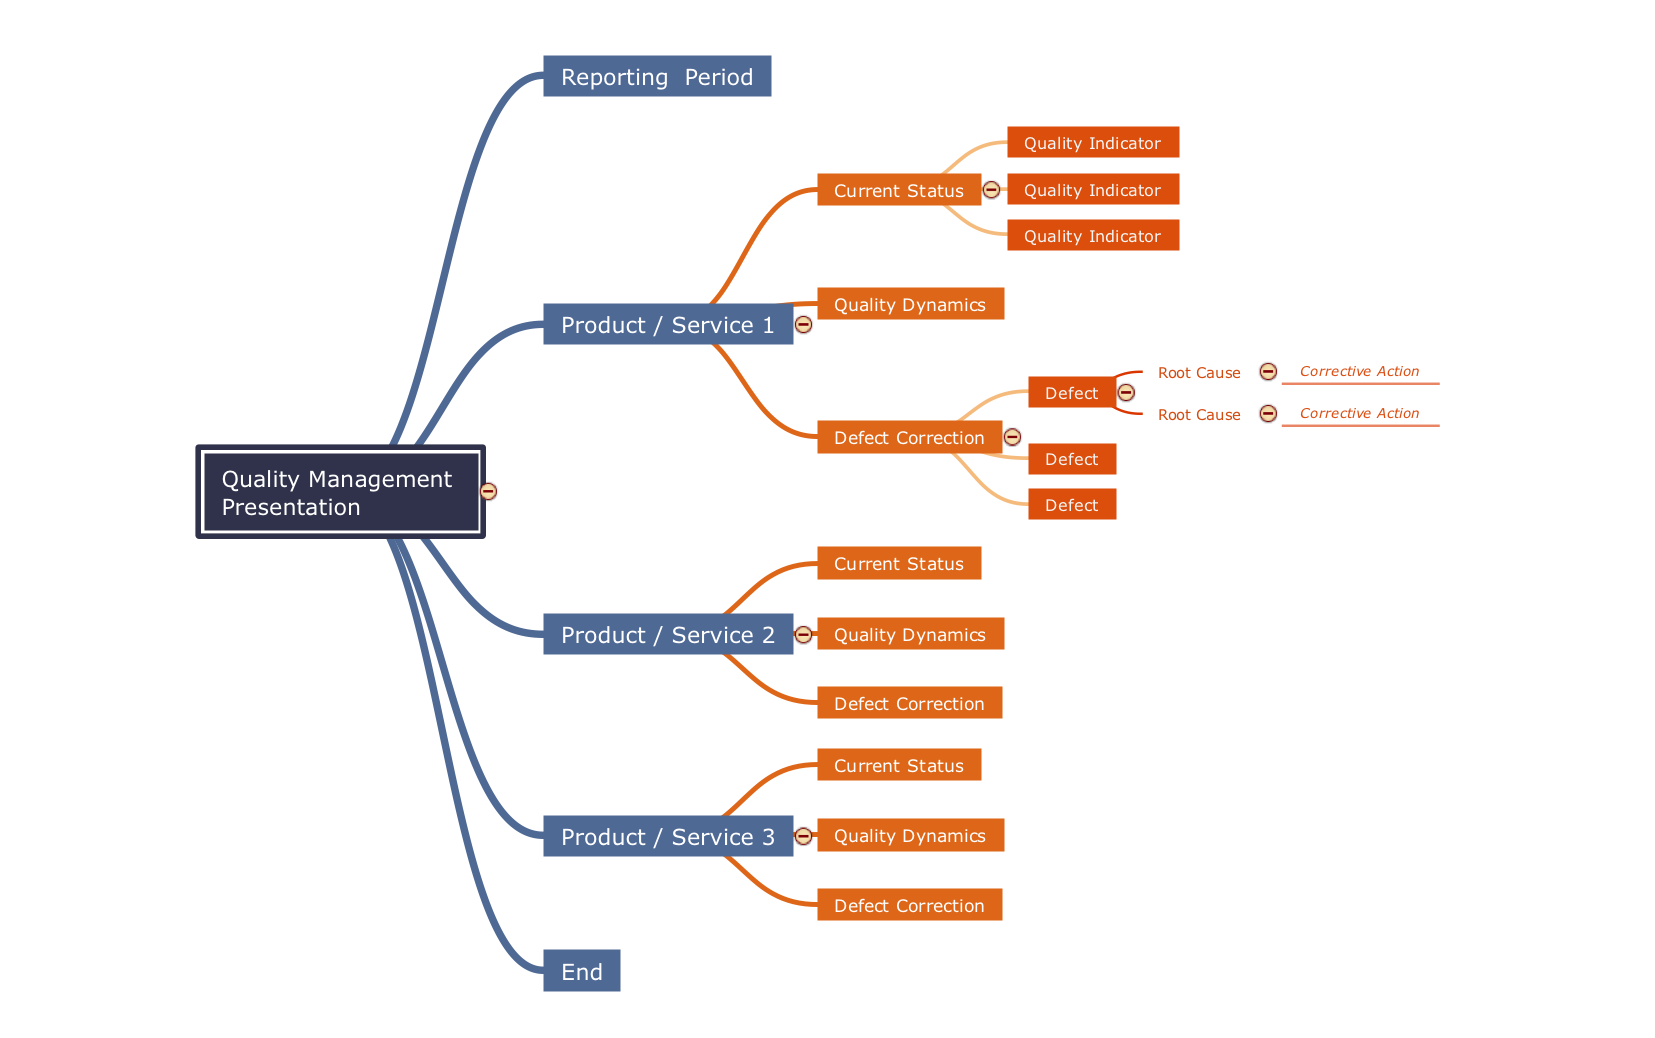
Picture: Quality Criteria MindMap
Related Solution:
This mind map shows how Six Sigma methodology be represented as a mind map. Six Sigma is a quality management methodology allows reducing the number of defects to 3.4 defects per million.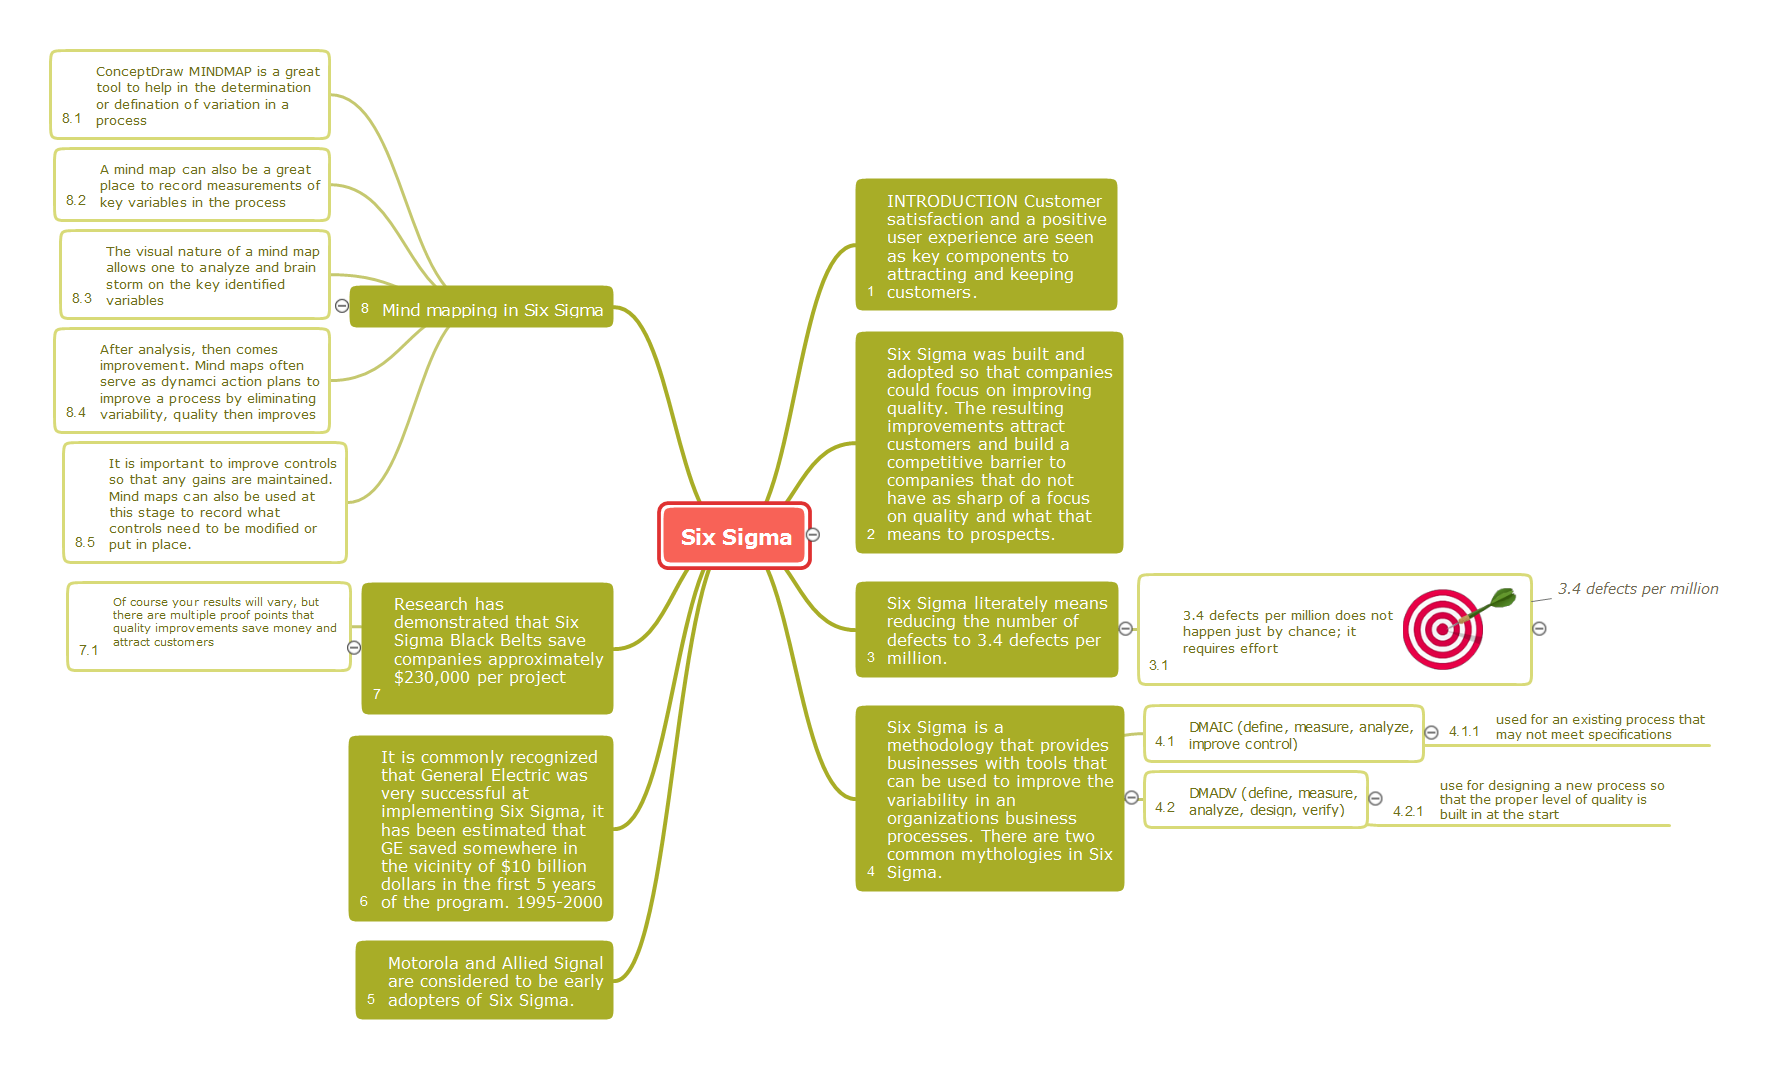
Picture: 6 sigma
Related Solution:
Many people who use mind mapping software for personal organizing find ConceptDraw MINDMAP sufficiently useful mind mapping tool in their business and daily life. Especially many positive responses receive ConceptDraw MINDMAP as cross platform tool to mind maps for Macintosh and Windows.
Picture: Think and act effectively
ConceptDraw MINDMAP is a powerful business and personal productivity software application that provides visual organization and access to information for individuals and organizations.
Picture: ConceptDraw MINDMAP :Brainstorming, Mind Mapping for macOS and Windows
There are numerous articles about the advantages of flowcharting, creating business graphics and developing different charts. Nevertheless, these articles are almost useless without the main component - the examples of flowcharts, org charts and without a fine example, it is difficult to get all the conveniences of creating diagrams. You can find tons of templates and vivid examples on Solution Park.
This illustration shows a variety of business diagrams that can be created using ConceptDraw DIAGRAM. It comprises a different fields of business activities: management, marketing, networking, software and database development along with design of infographics and business illustrations. ConceptDraw DIAGRAM provides a huge set of sample drawings including business process modeling diagrams,, network diagrams, UML diagrams, orgcharts, DFD, flowcharts, ERD, geographical maps and more.
Picture: Examples of Flowcharts, Org Charts and More
Related Solution: