Why is it important to have a
formal purchasing process?
Flowchart
It is important to know how purchasing processes work and how each operation is done. The Accounting Flowcharts Solution allows to document and present visually purchasing processes. ConceptDraw DIAGRAM is a software for drawing flowcharts and it gives the ability to draw flowcharts that accurately represent purchasing processes in the organization.
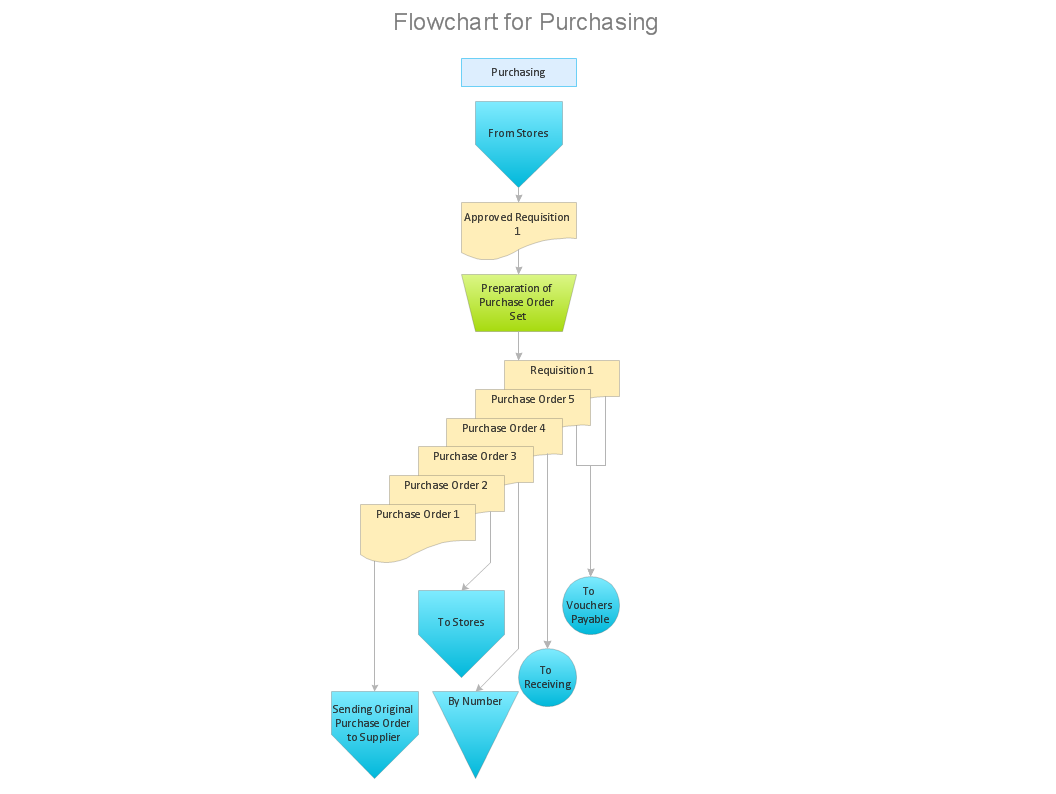
Sample 1. Purchasing process flowchart.
Accounting Flowcharts solution from ConceptDraw Solution Park provides templates, samples and library of vector shapes for drawing the accounting process flow charts.
Use ConceptDraw DIAGRAM with Accounting Flowcharts solution to document and communicate visually how accounting processes work, and how each operation is done.
TEN RELATED HOW TO's:
You need design the seating chart? The simple way is to use the specialized software. ConceptDraw DIAGRAM diagramming and vector drawing software extended with Seating Plans solution from the Building Plans area with powerful drawing tools, samples, seating chart template free will be ideal for you.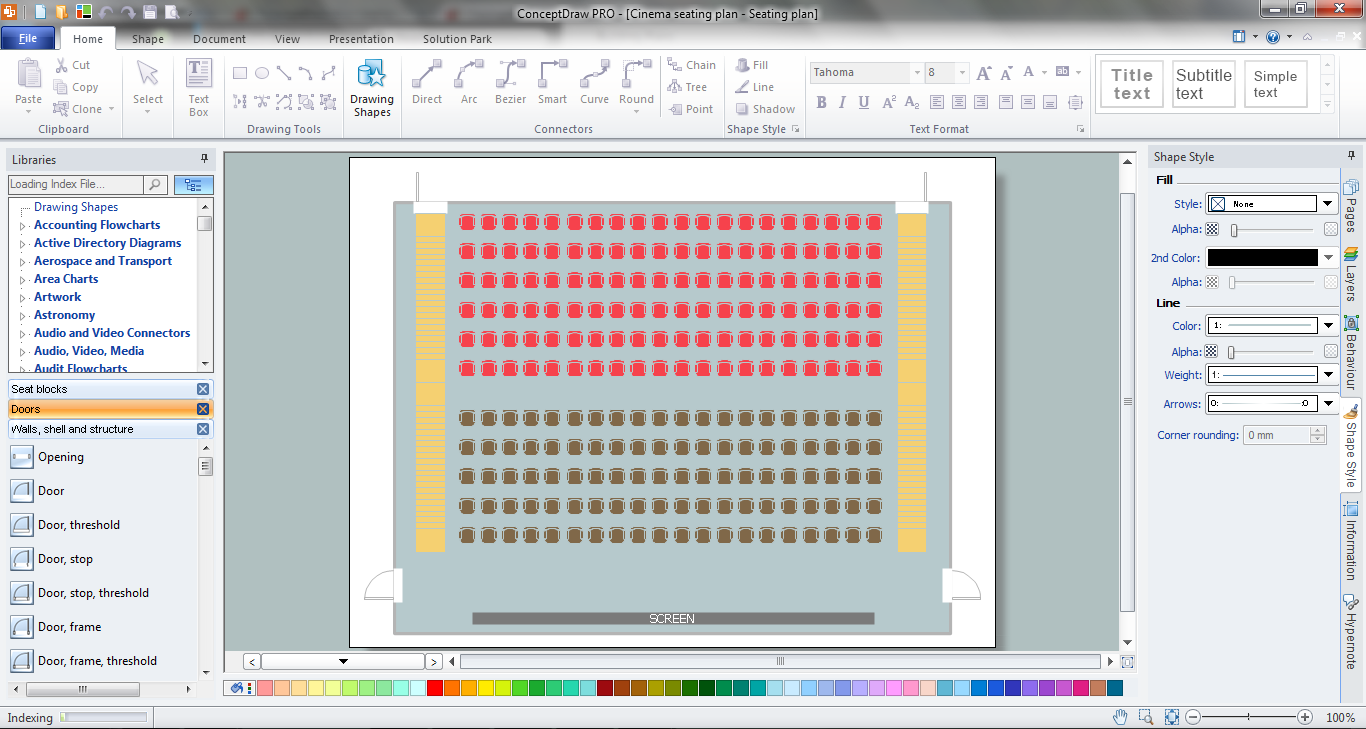
Picture: Seating Chart Template Free
Related Solution:
ConceptDraw DIAGRAM is workflow diagram software enhanced by numerous extentions from ConceptDraw Solution Park. It inludes many professional workflow diagrams, examples and ready to use workflow diagram and workflow symbols. Workflow symbol collections include symbols for Processes, Planning, Scheduling, Flow Control, In-Transit Process Visibility.
The best workflow diagram software you may find is ConceptDraw DIAGRAM. ConceptDraw DIAGRAM is world-known diagramming software that works for both Windows and Mac OS X platforms. The software contains complete set of features allows to draw diagrams faster. ConceptDraw DIAGRAM extended with the Workflow Diagram solution provides additional libraries, templates and samples for drawing professional workflow diagrams.
Picture: Workflow Diagram Software
Related Solution:
Create your own flow charts of computer or network system account processing using the ConceptDraw DIAGRAM.
Picture:
Account Flowchart
Flowchart ExamplesRelated Solution:
ConceptDraw DIAGRAM diagramming and vector drawing software extended with Specification and Description Language (SDL) Solution from the Industrial Engineering Area of ConceptDraw Solution Park provides powerful drawing tools for quick and easy creating well-designed FSM diagrams.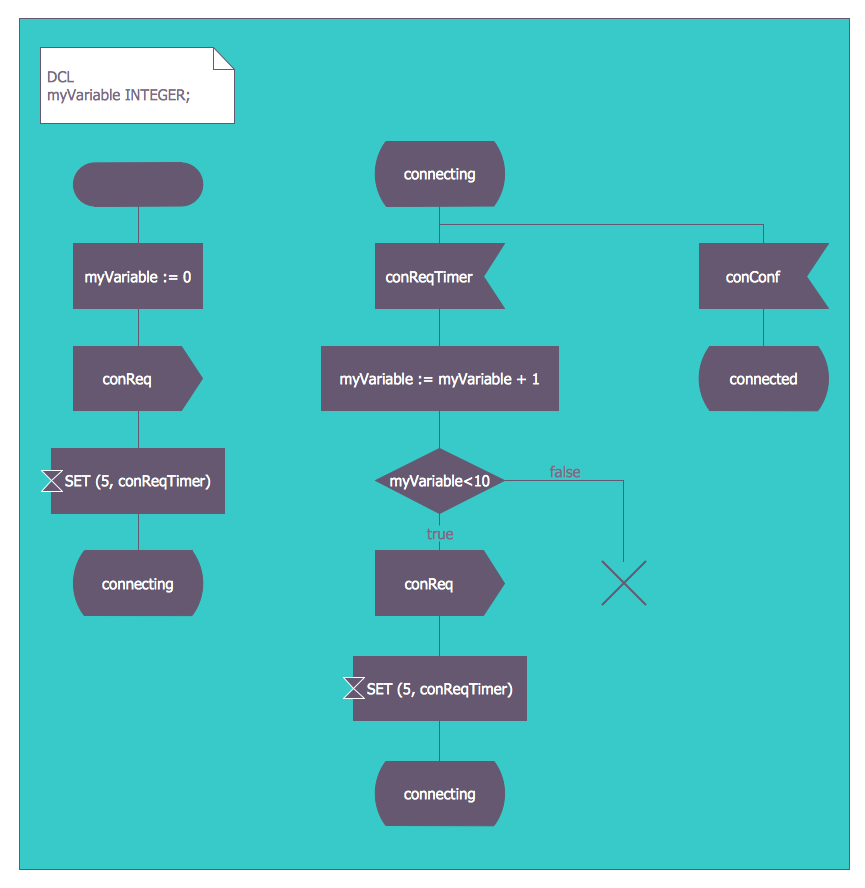
Picture: FSM — Finite-state Machine
Related Solution:
The Accounting flowchart shows how information flows from source documents through the accounting records. The are based on the accounting procedures or processes.
Picture: What process should be essentially adopted.Accounting Flowchart Example
Related Solution:
Functional modeling allows to make complex business processes simple. One of the basic methods is IDEF0 and one of the most effective also. To create a business model, use flowchart symbols.
The IDEF0 library, supplied with ConceptDraw IDEF0 Diagrams solution contains 18 IDEF0 basic notation symbols. All symbols are the vector graphic images what means, that one can customize their size preserving the stable quality. Another library of IDEF0 symbols can be find out in the the Business Process Diagrams solution, included to the Business Processes section of ConceptDraw Solution Park. These libraries composed from just vector objects and are totally compatible. You can apply the IDEF0 symbols from both libraries at your flowcharts, if needed.
Picture: IDEF0 Flowchart Symbols
Related Solution:
Four lessons explaining how to manage your task list in a Gantt chart. You will learn how to adjust your Gantt chart view, how to add/delete tasks or subtasks, how to change tasks hierarchy, how to show/hide subtasks.
Picture: Managing the task list
The Rapid UML Solution for ConceptDraw DIAGRAM provides templates, samples and libraries with predesigned objects for each of 13 types of UML diagrams that will help you to create the professional looking UML Diagrams quick and easy.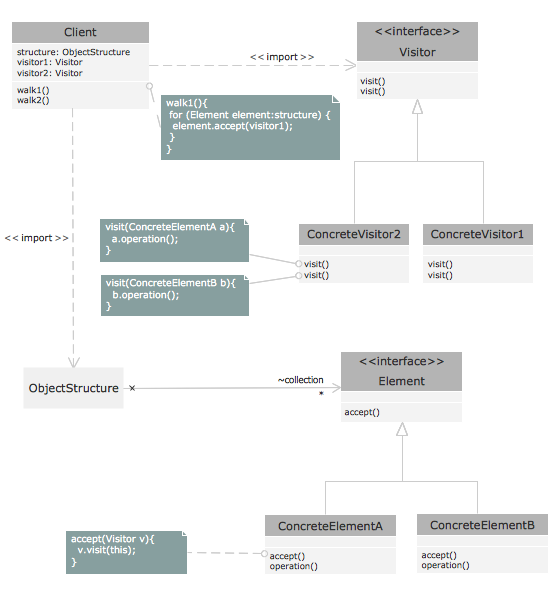
Picture: Programming with UML
Related Solution:
This sample was created in ConceptDraw DIAGRAM drawing software using the Flowcharts solution.
Picture: Horizontal Flowchart
Related Solution:
If you want to use effective methods for your business, you may need a tool which may let you represent your ideas and goals in graphic way.
Software with different flowchart templates for each type of business will be your lifesaver. ConceptDraw DIAGRAM with its business samples, libraries and design elements is a point to start.
Picture: Graphics Software for Business
ConceptDraw
DIAGRAM 18