Business Process Flowchart Symbols
Business process modeling (BPM) and Business process flowcharts and maps are widely used in the corporate world as an excellent tool which can speak, lets visually represent and explain complex business processes of an enterprise, and showcase decisions on a single piece of paper.
The business process flowchart symbols used for business process mapping are predefined by Business Process Modeling Notation (BPMN) and actually have their roots in the data processing diagrams and programming flow charts. The BPMN standard notation serves as a common language for business process design and implementation. Thanks to it your Business Process Maps and Flowcharts are easy understandable by all business analysts who create and refine the processes, technical developers who implement them, and also business managers who monitor and manage them.
The ability to create professionally designed Business Process flowcharts, maps and diagrams, clearly define the business processes in terms of inputs and outputs, generate attractive SIPOC diagrams is provided by powerful ConceptDraw's Business Process Mapping solution.
Pay special attention for 3 libraries developed and included in Business Process Mapping solution. A wide selection of ready-to-use predesigned vector stencils included to them let effectively evaluate and manage quality in a work process chain, placing the main emphasis on corporate performance and optimization:
- Business Process Flowcharts library contains 22 process flow symbols
- SIPOC Diagrams library contains 19 stencils
- Swim Lanes library contains 12 cross-functional flowchart symbols

Example 1. Business Process Flowchart Symbols
According to the type of diagram you want to draw, use the objects from the corresponding library. Add the elements to the diagram by dragging them from the library to the document page.

Example 2. SIPOC Diagrams Symbols
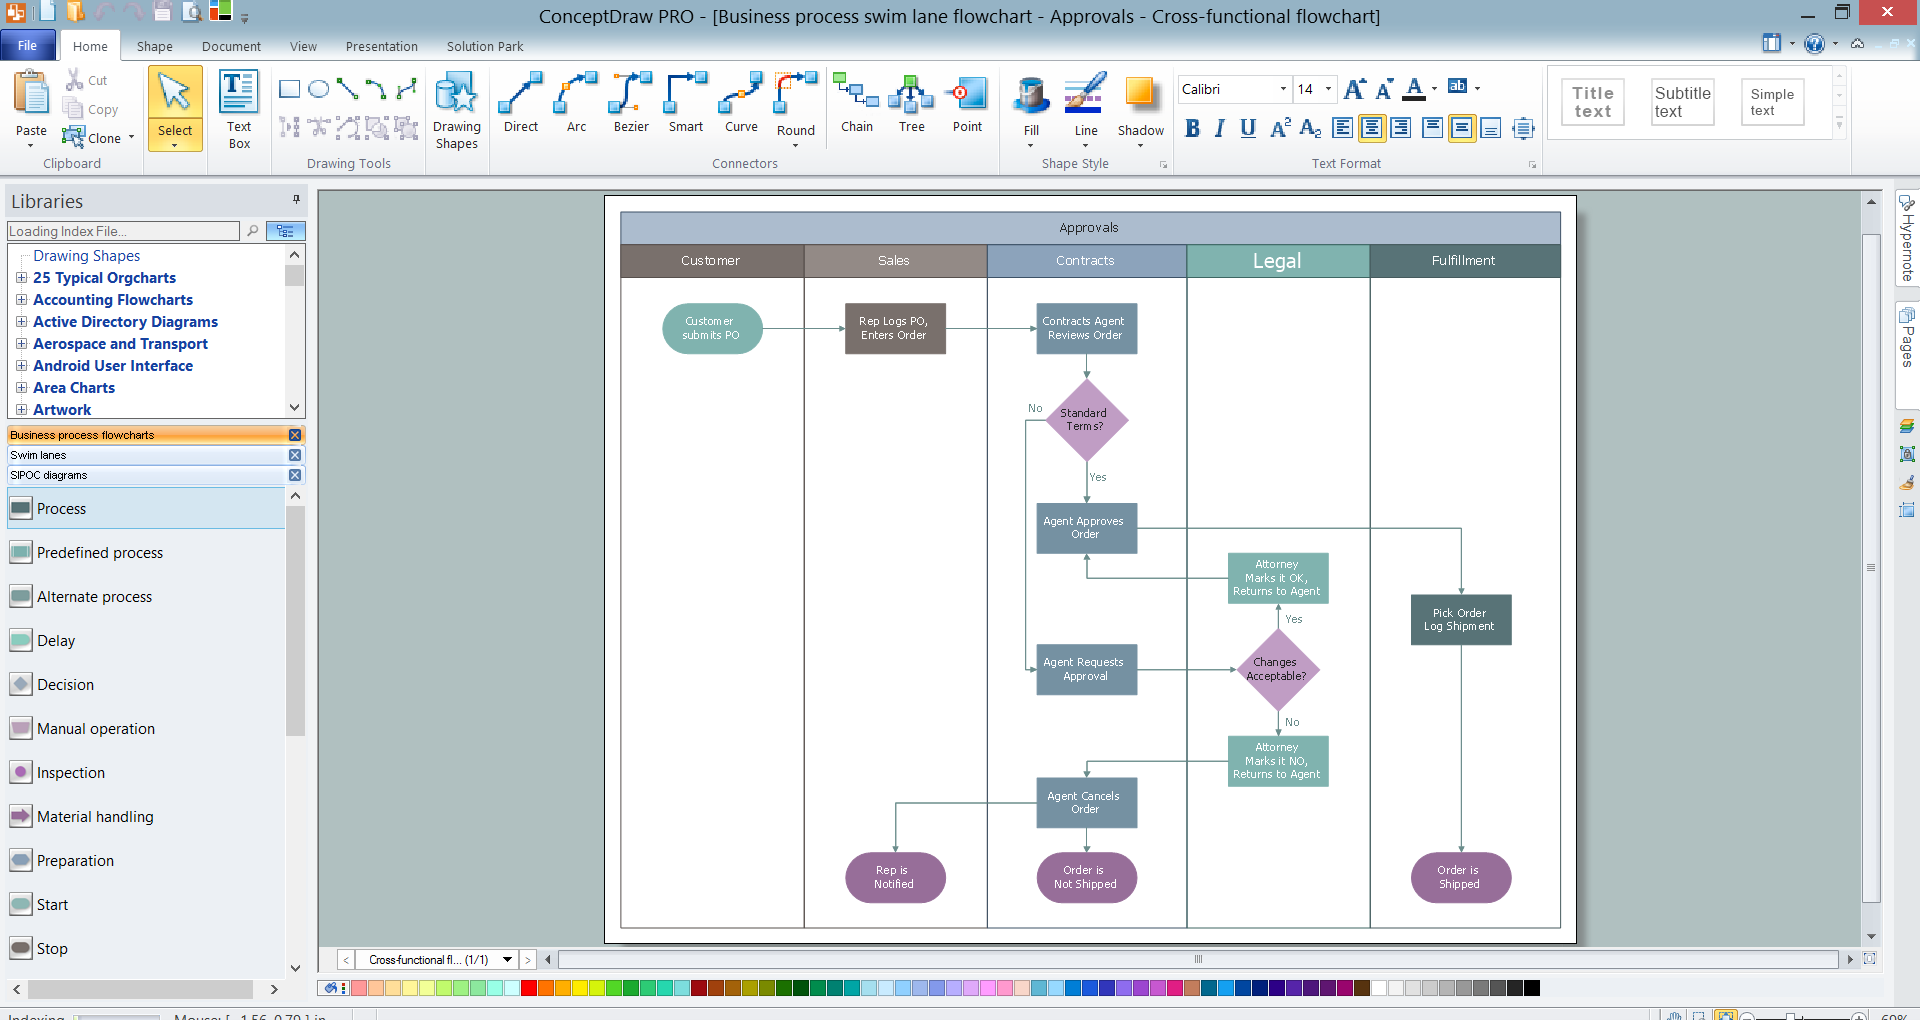
Start drawing SIPOC Diagrams and Business Process Swim Lanes Flowcharts with ready-to-use Sipoc matrix object and Swim lanes objects from the corresponding libraries.

Example 3. Swim Lanes Stencils
The flowchart symbol names in parentheses are common alternates for a given shape. Sometimes a flowchart shape can have more than one meaning, as with the Circle shape, which depicts a jump node in flow charts and inspection point in business process mapping. Other times, there are just multiple names for the same flow chart symbol — such as Terminator and Terminal Point.
| Symbol | Shape Name | Symbol Description |
| Process / Operation Symbols | ||
 |
Process | Show a Process or action step. This is the most common symbol in both process flowcharts and business process maps |
 |
Predefined Process | A Predefined Process symbol is a marker for another process step or series of process flow steps that are formally defined elsewhere. This shape commonly depicts sub-processes (or subroutines in programming flowcharts). If the sub-process is considered “known” but not actually defined in a process procedure, work instruction, or some other process flowchart or documentation, then it is best not to use this symbol since it implies a formally defined process |
 |
Alternate Process | Outside Sources As the shape name suggests, this flowchart symbol is used when the process flow step is an alternate to the normal process step. Flow lines into an alternate process flow step are typically dashed |
 |
Delay | The Delay flowchart symbol depicts any waiting period that is part of a process. Delay shapes are common in process mapping |
 |
Preparation | As the names states, any process step that is a Preparation process flow step, such as a set-up operation |
 |
Manual Operation | Manual Operations flowchart shapes show which process steps are not automated. In data processing flowcharts, this data flow shape indicates a looping operation along with a loop limit symbol |
| Branching and Control of Flow Symbols | ||
 |
Flow Line (Arrow, Connector) | Flow line connectors show the direction that the process flows |
 |
Decision | Indicates a question or branch in the process flow. Typically, a Decision flowchart shape is used when there are 2 options (Yes/No, No/No-Go, etc.) |
 |
Connector (Inspection) | Flowchart: In flowcharts, this symbol is typically small and is used as a Connector to show a jump from one point in the process flow to another. Connectors are usually labeled with capital letters (A, B, AA) to show matching jump points. They are handy for avoiding flow lines that cross other shapes and flow lines. They are also handy for jumping to and from a sub-processes defined in a separate area than the main flowchart Process Mapping: In process maps, this symbol is full sized and shows an Inspection point in the process flow |
 |
Merge (Storage) | Flowchart: Shows the merging of multiple processes or information into one.
Process Mapping: commonly indicates storage of raw materials |
 |
Extract (Measurement) | Flowchart: Shows when a process splits into parallel paths. Also commonly indicates a Measurement, with a capital ‘M’ inside the symbol. Process Mapping: commonly indicates storage of finished goods |
 |
Or | The logical Or symbol shows when a process diverges - usually for more than 2 branches. When using this symbol, it is important to label the out-going flow lines to indicate the criteria to follow each branch |
| Input and Output Symbols | ||
 |
Data (I/O) | The Data flowchart shape indicates inputs to and outputs from a process. As such, the shape is more often referred to as an I/O shape than a Data shape |
 |
Document | Pretty self explanatory - the Document flowchart symbol is for a process step that produces a document |
 |
Multi-Document | Same as Document, except, well, multiple documents. This shape is not as commonly used as the Document flowchart shape, even when multiple documents are implied |
 |
Display | Indicates a process step where information is displayed to a person (e.g., PC user, machine operator) |
 |
Manual Input | Manual Input flowchart shapes show process steps where the operator/ user is prompted for information that must be manually input into a system |
| File and Information Storage Symbols | ||
 |
Stored Data | A general Data Storage flowchart shape used for any process step that stores data |
") |
Magnetic Disk (Database) | The most universally recognizable symbol for a data storage location, this flowchart shape depicts a database |
Take also benefit from the ConceptDraw's RapidDraw technology and Action feature, they allow to simplify the laborious process of business modeling and give you ability to focus on your objectives, and help create your Business Process flowcharts and maps as quickly as possible.
To activate the RapidDraw mode, use the Rapid Draw button on the Shape toolbar and add the next objects using the RapidDraw arrows, which pop up when you bring the mouse cursor over the object.

Example 4. Use of RapidDraw Mode
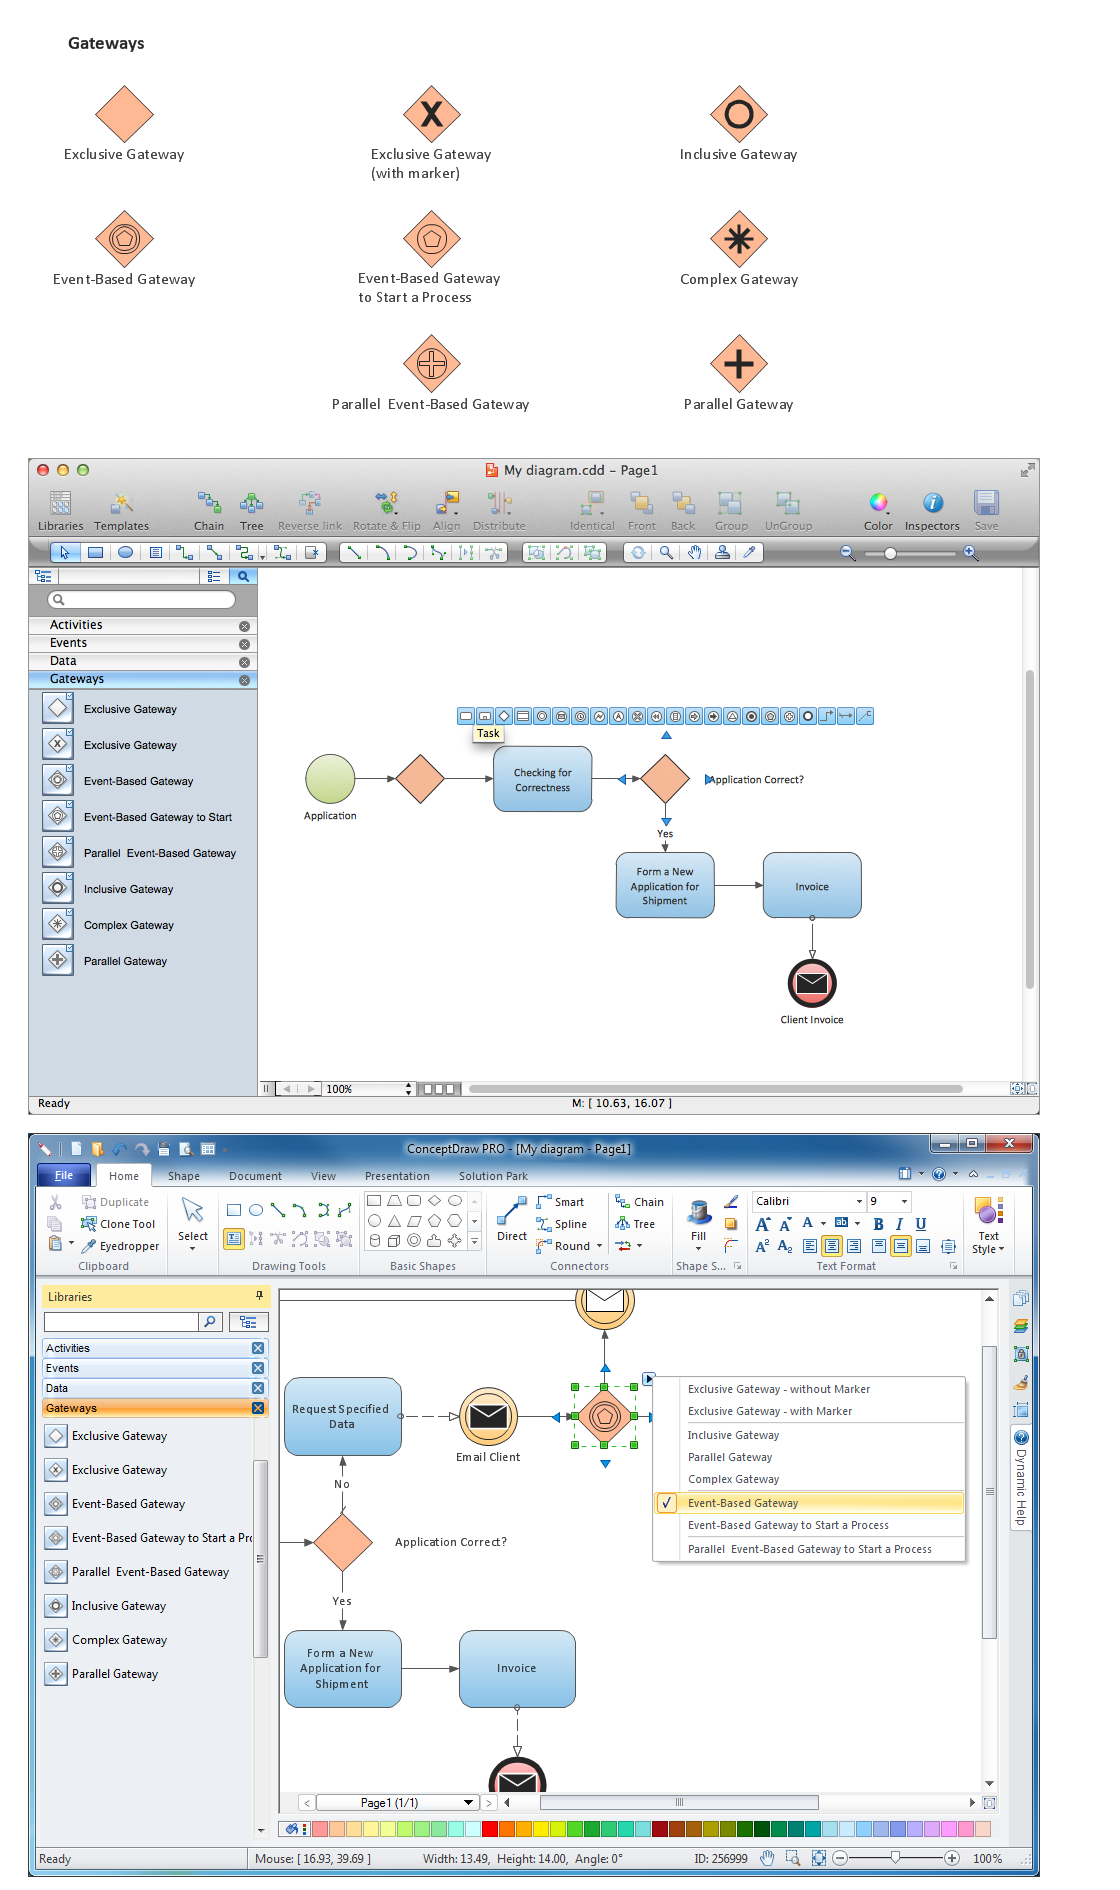
To modify the selected object using its action's menu, click the Action button in its upper right corner and apply the suitable commands.

Example 5. Vertical Swim Lanes Object's Action Menu
It is convenient to start drawing Business Process Flowcharts with predesigned templates and eye-catching inspiring samples developed by professionals, which you can find in ConceptDraw STORE.

Example 6. Business Process Flowchart Solution
Use this variety of business process flowchart symbols from the libraries of Business Process Mapping Solution for ConceptDraw DIAGRAM Business Mapping Software and also collection of Business Process Maps, Flowcharts, Swim Lanes Diagrams and SIPOC Diagrams, and template from ConceptDraw STORE to create your own professional looking diagrams of any complexity quick, easy and effective.