
Example 1. Check Order Process Flowchart
This example was redesigned from the Wikimedia Commons file [commons.wikimedia.org]
This sample shows the Flowchart of the printing the elements of the binary search tree. They are printed in the order from lowest to greatest. On this diagram you can see the rectangles that represent the steps and decision points that are represented as diamonds with questions. It is necessary to make the decision that will determine the next step.
Using the ready-to-use predesigned objects, samples and templates from the Flowcharts Solution for ConceptDraw DIAGRAM you can create your own professional looking Flowchart Diagrams quick and easy.
The Flowcharts produced with ConceptDraw DIAGRAM are vector graphic documents and are available for reviewing, modifying, and converting to a variety of formats (image, HTML, PDF file, MS PowerPoint Presentation, Adobe Flash or MS Visio).
TEN RELATED HOW TO's:
In any unclear situation create a workflow diagram. Workflow diagrams help to understand processes, find bottlenecks and fix the process. When you create workflow diagram using ConceptDraw DIAGRAM software you are able to focus on thinking, not drawing, that makes you as effective as possible.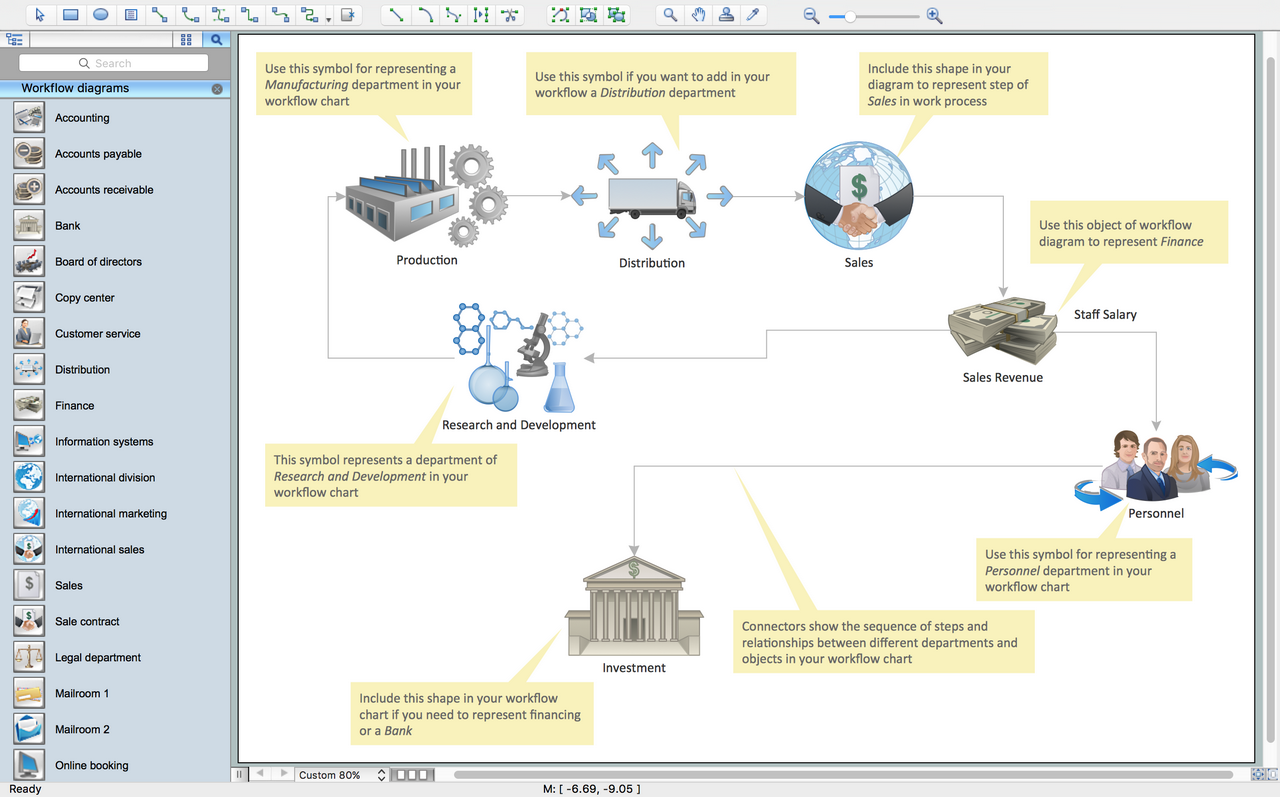
Picture: Create Workflow Diagram
Related Solution:
ConceptDraw DIAGRAM is a powerful intelligent vector graphics tool for drawing flowcharts.
Picture: Basic Diagramming Flowchart Software
Related Solution:
Now it’s easy to share your visual documents with other people in a form most convenient for them.
ConceptDraw DIAGRAM can save your drawings and diagrams in a number of highly useful formats, including graphic files. You can save your drawing as a.PNG,.JPG, or other graphic format file.
Picture: Export from ConceptDraw DIAGRAM Document to a Graphic File
Each business is created, exists and develops according to its type of business structure. Creating new business or developing existing, you may need a powerful software for representing its business structure. In this case ConceptDraw DIAGRAM diagramming and vector drawing software extended with 25 Typical Orgcharts solution from the Management area is exactly what you need.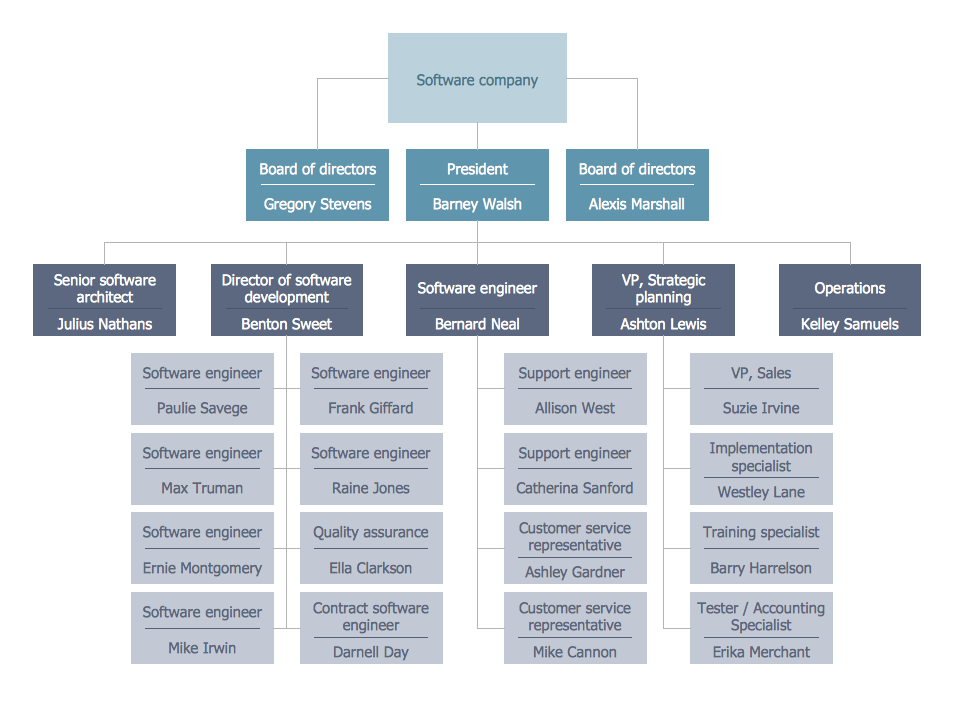
Picture: Business Structure
Related Solution:
ConceptDraw DIAGRAM software extended with unique HR Flowcharts Solution is the best for designing various flowcharts and diagrams in the field of human resources management.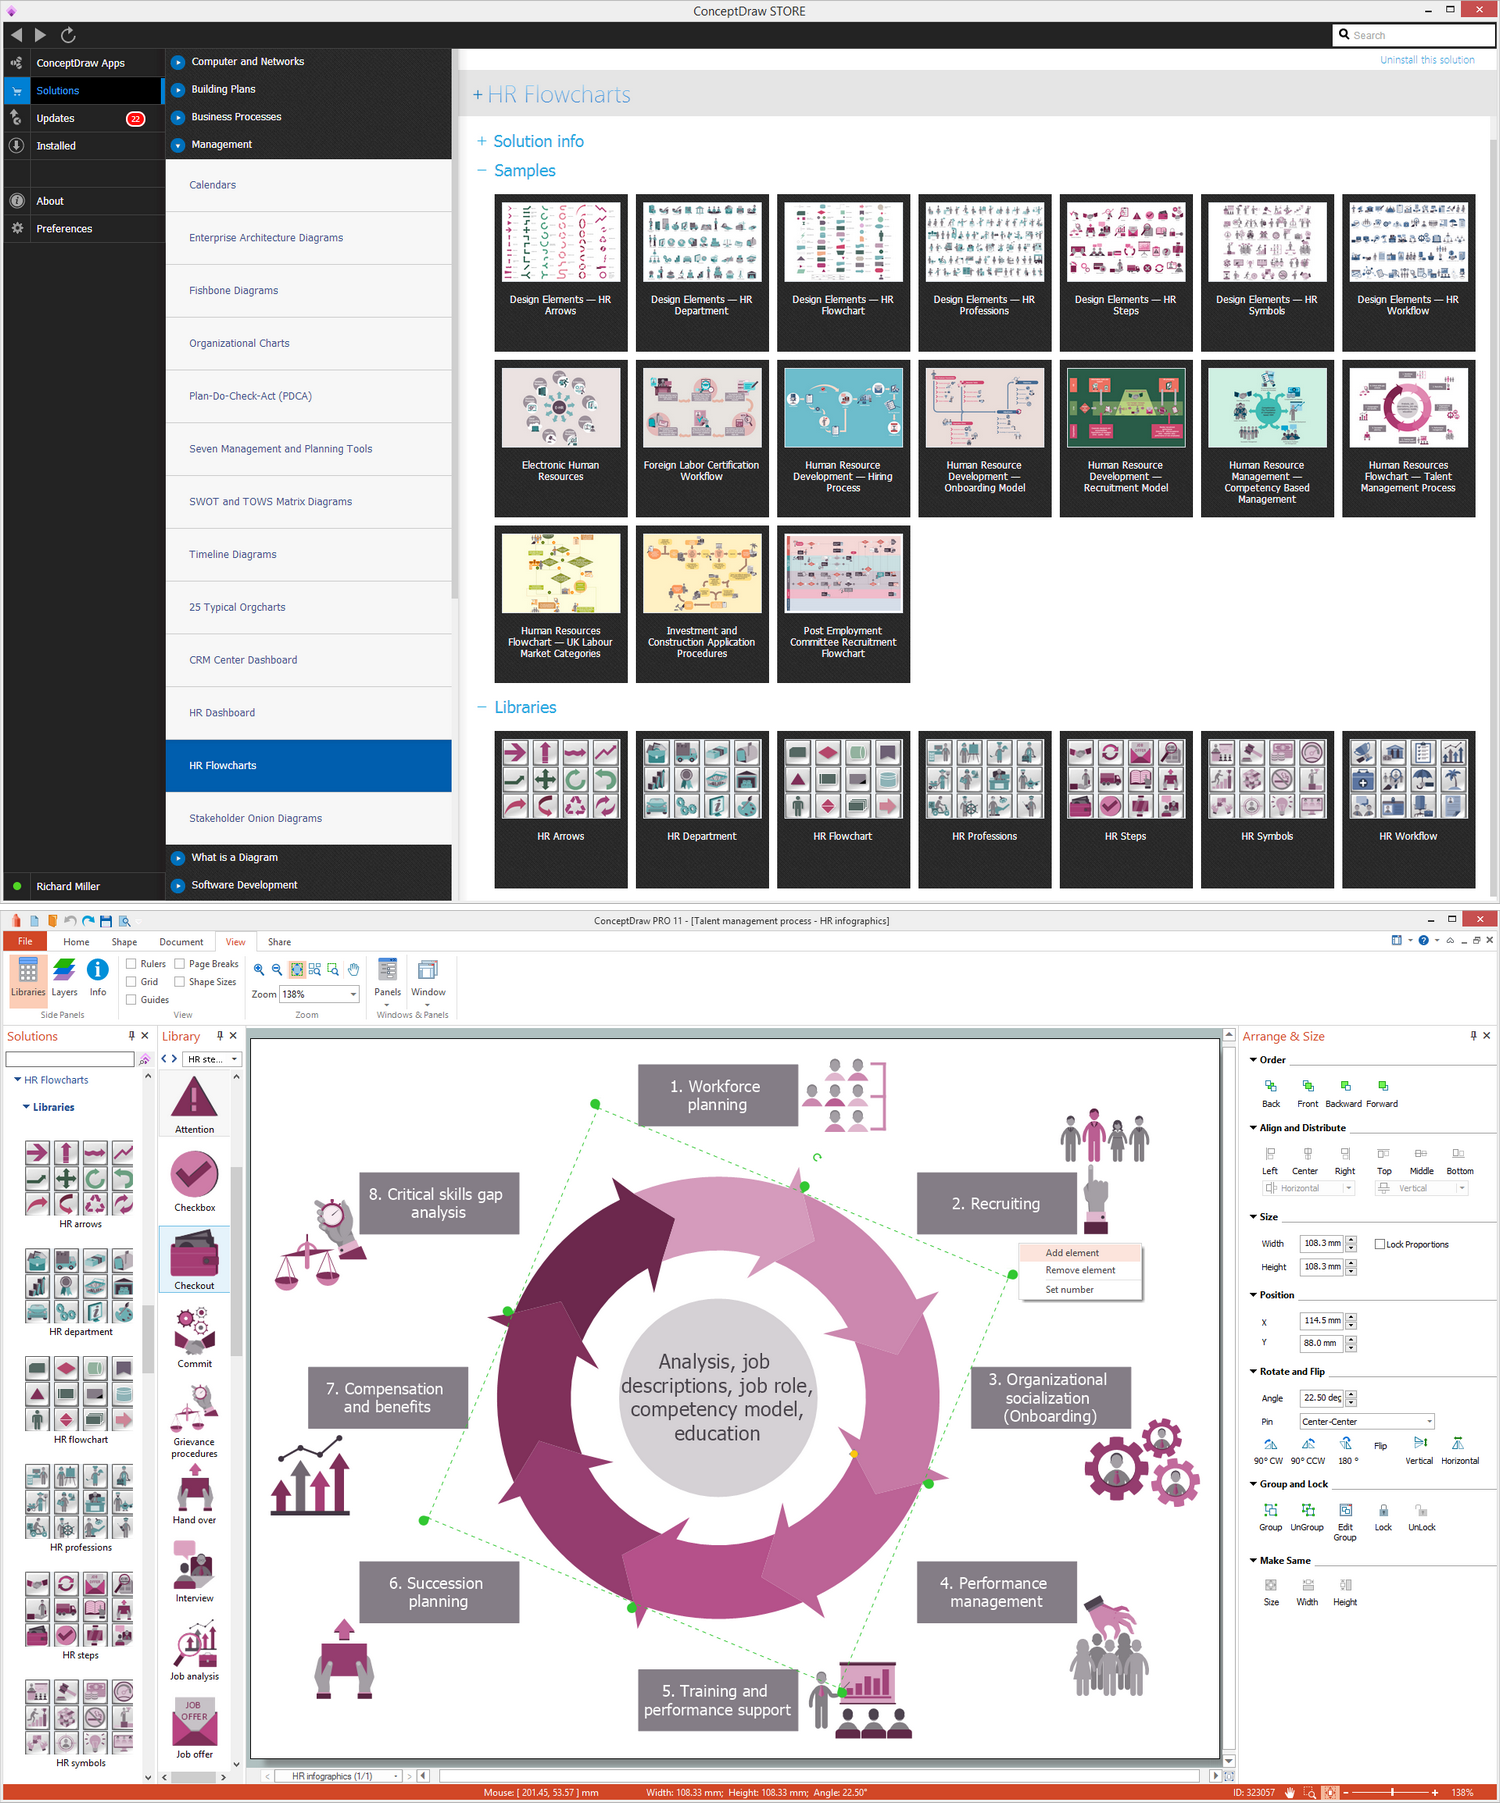
Picture: Human Resources
Related Solution:
ConceptDraw DIAGRAM is the beautiful design software that provides many vector stencils, examples and templates for drawing different types of illustrations and diagrams.
Mathematics Solution from the Science and Education area of ConceptDraw Solution Park includes a few shape libraries of plane, solid geometric figures, trigonometrical functions and greek letters to help you create different professional looking mathematic illustrations for science and education.

Picture: Scientific Symbols Chart
Related Solution:
A key point of conference success is the ability to see slides in real time, and hold documented discussions during the meeting. Remote Presentation for Skype is a new solution allows real-time presenting that benefits work groups who need collaborate by web meetings.
Picture: How To Make the Right Decision in Projects
Related Solution:
ConceptDraw DIAGRAM is a powerful tool that helps you create professional looking cross-functional flowcharts with the well-designed objects. ConceptDraw DIAGRAM - Drawing Software for Vertical Cross Functional Flowchart. ConceptDraw allows you to focus on work, not the drawing process. ConceptDraw Arrows10 Technology allows to draw connectors with smart behavior that gives flexibility to you during work process.
Picture: Vertical Cross Functional Flowchart
Create flowcharts, organizational charts, bar charts, line graphs, and more with ConceptDraw DIAGRAM.
Picture: Basic Diagramming
Related Solution:
Data processing can be very complex sometimes. If you are interested in facilitating your work with data, it’s time to learn how to draw flowcharts with special software or using just a piece of paper. The list of flowchart basic symbols includes rectangles, diamond, ellipses etc. and is used to represent processes, actions, decisions or data processing.
A well-done flowchart bring the clearness of the sequence of a process stages. There are number of symbols that can be used in flow charts to show various sorts of steps. The basic flowchart can be created using a few of them: Process, Decision, Start/Finish. A basic element of a flowchart represents a simple action and looks like a box, that contains a description of the action. The depicting of actions sequence is made with arrows between corresponding action boxes, as you can see on the sample diagram. Also it shows the symbols for flowchart start and finish steps. ConceptDraw Flowcharts solution provides the ability to build basic flow charts as well as the ones of any size and complexity with a minimum of actions.
Picture: How to Draw a Flowchart: Step-by-Step Guide
Related Solution: