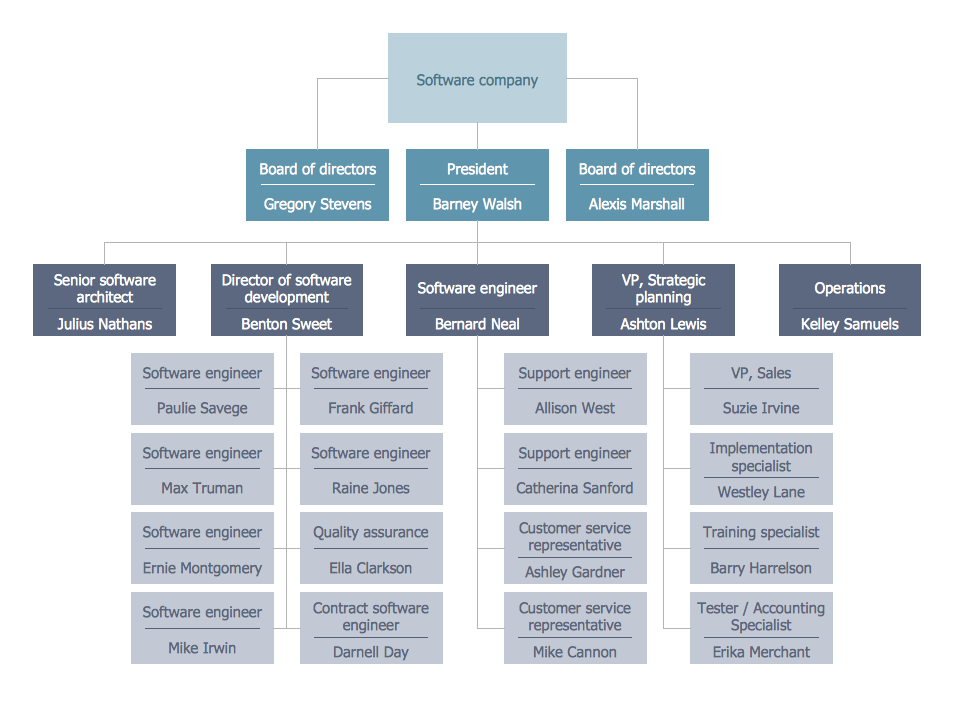
Example 1. Business Structure - Software Company Org Chart
25 Typical Orgcharts Solution includes 25 templates:
- Flat Org Chart templates,
- Hierarchical Org Chart templates,
- Matrix Org Chart templates.
Not depending which business structure you have, you will surely find among them a suitable template to depict it.

Example 2. Organizational Chart Library - Design Elements
25 Typical Orgcharts Solution provides also 2 libraries with ready-to-use 40 vector graphics and icons:
- Organizational Chart library
- Organizational Chart (people) library
 Library - Design Elements")
Example 3. Organizational Chart (people) Library - Design Elements
Use all these tools for developing, design and realization the Business Structure of any complexity without efforts!

Example 4. Hierarchical Org Chart Template
This template is one of 25 templates included in paid add-on 25 Typical Orgcharts Solution for ConceptDraw DIAGRAM Solution Park. It is convenient for using as the base for Business Structure Chart design.
Use the 25 Typical Orgcharts Solution for ConceptDraw DIAGRAM software to create your own professional looking Business Organization Chart of any complexity quick, easy and effective.
All source documents are vector graphic documents. They are available for reviewing, modifying, or converting to a variety of formats (PDF file, MS PowerPoint, MS Visio, and many other graphic formats) from the ConceptDraw STORE. The 25 Typical Orgcharts Solution is available for all ConceptDraw DIAGRAM users.
TEN RELATED HOW TO's:
An organizational chart is a diagram that shows the structure of an organization and the relationships of its parts. ConceptDraw DIAGRAM extended with Organizational Charts Solution from the Management Area is powerful Organizational Chart Software.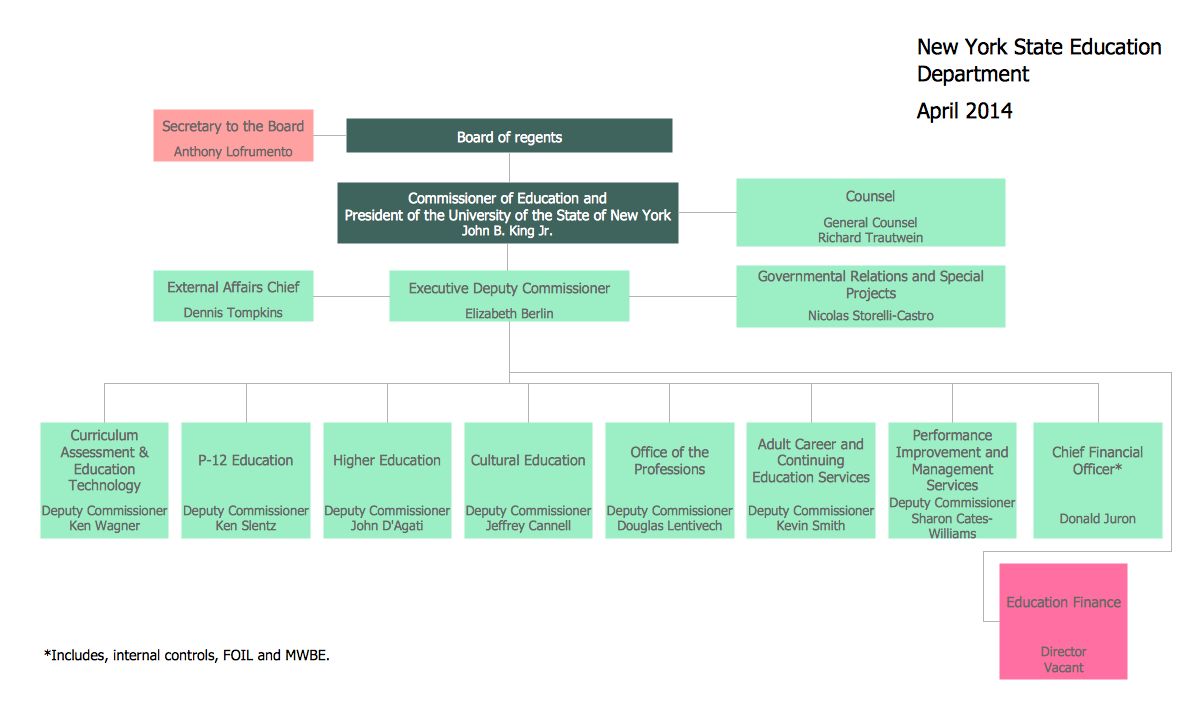
Picture: Organizational Chart
Related Solution:
Any business process consists from a number of tasks carrying out the certain business goal. It is useful to diagram business processes to ensure that they are as foolproof, logical and sequential as possible. This business process diagram describes a typical booking process flow by the example of a cab booking process. It can be used as a roadmap for any booking system implementation. Diagramming a business process allows you to look at the entire project and take into account all types of possible scenarios. Business process diagram helps you investigate and clarify the process thoroughly so that you can find out how it can be improved. Business process diagram supports team communications by ensuring that each process element is clear and everyone in the team is on the same page.
Sometimes your company brings you less profit than you expect it to be, and it’s difficult to reveal the causes. Maybe it’s time to learn new technologies, because business diagram are easily developed by means of special software, so you won’t make any extra effort. In return, you will increase your productivity and get more done in a less time.
Picture: Business Diagram Software
Related Solutions:
My friend works as a marketologist. Once he asked me about Marketing and Sales Organization chart, as it was new for him. Luckily, ConceptDraw Solution Park has tons of examples to show to an unexperienced user.
This organizational chart was designed with ConceptDraw DIAGRAM and its Organizational Charts solution, that can be find in the Management section of Solution Park. This solution offers a vector objects library and a set of samples and templates. The vector library contains symbols and icons that provide you with possibility to show the organizational structure of your organization at a glance. It allows to depict the interrelations of authority and responsibility between positions in an organization. Organizational charts provide both employers and employees a clear view of the sale and marketing departments structure, reporting system, management levels.
Picture: Marketing and Sales Organization chart.Organization chart Example
Related Solution:
It can be tough to get straight into business papers and processes.Otherwise, you can learn how to create flowcharts for an accounting information system and visualize these documents. Accounting diagrams are clear and easy to understand for all the participants of the process.
There are symbols used for creating accounting flowcharts using ConceptDraw DIAGRAM and its Accounting Flowcharts solution. Accounting flow charts are a special kind of flow charts. Actually a variety of flowcharts are often used to facilitate many aspects of a workflow of accounting department. Accounting flowcharts are utilized to support creating accounting documentation, to depict positions responsible for fulfillment of each phase of accounting workflow.
Picture:
How to Create Flowcharts for an
Accounting Information System
Related Solution:
Understanding the connections between an organization department might take some time. If you are a newcomer to a company, an orgchart would help you if don’t know who to call when questions appear. This scheme usually is printed on one of the walls in the office.
This template of orgchart is supplied with the ConceptDraw add-on containing solutions for making organizational charts. You can use it to depict an organizational structure of your company. The only you need is - open this template and alter it to cover an organizational features of your business. It is easy to rearrange the orgchart structure by dragging the elements by mouse. Finally fill the template with particular positions of your company's staffing table.
Picture: Orgchart
Related Solution:
Working with information can be quite tedious, furthermore, some data can be quite difficult to perceive without any graphic representation. So, to facilitate your work, you can use business diagrams, such as simple flowcharts or Gantt charts for project management and orgcharts for clarifying your company structure. You can use a proper software, like ConceptDraw Pro, draw them on paper, or use whiteboards, but it is more convenient to use a digital tool.
This diagram shows a cross-functional flowchart that was made fore telecom service provider. A workflow of a common telecommunication service provider has a rather branched structure. Thus, it is useful to have a flow chart to visualize the sequences and interrelations of the work flow steps. Business process flowchart contains 17 processes and 4 decision points,that are distributed through 2 lines depicting the participants involved. Also there are connectors that show the data flow within processes. This flowchart displays a detailed model of the telecom service trading process, as well as all participants in the process and how they interact with each other.
Picture: Business diagrams & Org Charts with ConceptDraw DIAGRAM
The strategic balance is a combination of factors that can both positively and negatively affect the activity of the company. To know the factors that influence the organization success, managers should use SWOT matrix template that will define the potential inner strengths and weaknesses and potential external opportunities and threats. This matrix does not contain a ready solution, but allows to streamline all the available information.
This is a handy template of a SWOT matrix. It can serves as a visual guide for management students. To simplify the task, on the left and on the right we have added hints with examples of external and internal factors. This template one can found among numerous templates of SWOT and TOWS matrices that are included in the the eponymous solution by ConceptDraw Solution Park.
Picture: SWOT Matrix Template
ConceptDraw - Organigram software allows quickly create Organigrams and much more. ConceptDraw DIAGRAM is an ideal tool for Administrative staff to clearly demonstrate the company orgchart professional.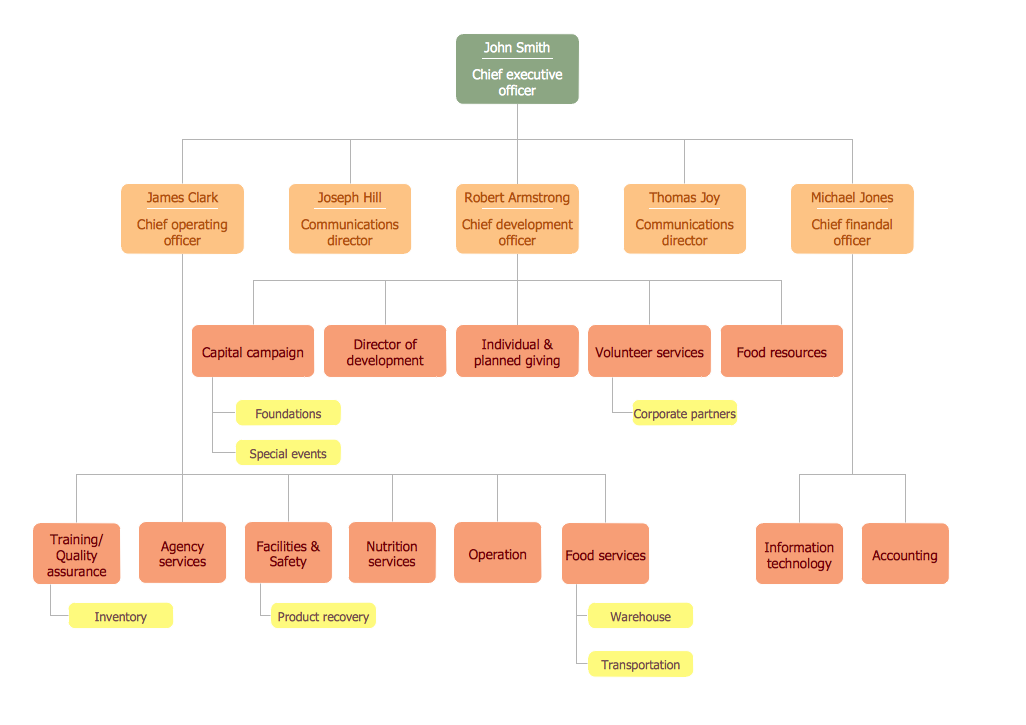
Picture: Organigrams with ConceptDraw DIAGRAM
Related Solution:
Creating a detailed network plan can cause a lot of headache to an unexperienced user. And it is worth mentioning that ConceptDraw DIAGRAM is a decent tool for creating a network diagram, a tool that is easy-to-use. To get an accurate diagram use the vector shapes from the special libraries that represent workstations, network appliances, wiring systems and connect them with smart-connectors, just as simple as that.
This communication network diagram displays the way different components of a computer network communicate with each other. When representing network information, such as depicting all the equipment in a large network, it is helpful to make visual representation. Network diagram provides an easy way to show the way the connections between an equipment in a large network. This diagram of a communication network depicts a network composed of three sub-networks. It uses a network equipment symbols to represent the different devices that make up a network communication including routers, Ethernet devices and end-point equipment.
Picture: ConceptDraw DIAGRAM Network Diagram Tool
Related Solution:
The Wireless Network solution helps users to quickly transition from an idea to the implementation of a wireless computer network.
ConceptDraw DIAGRAM is well placed to provide experienced and comprehensive assistance in the workplace.
The vector stencils, examples, and templates included to solution is a strong toolset for network engineer.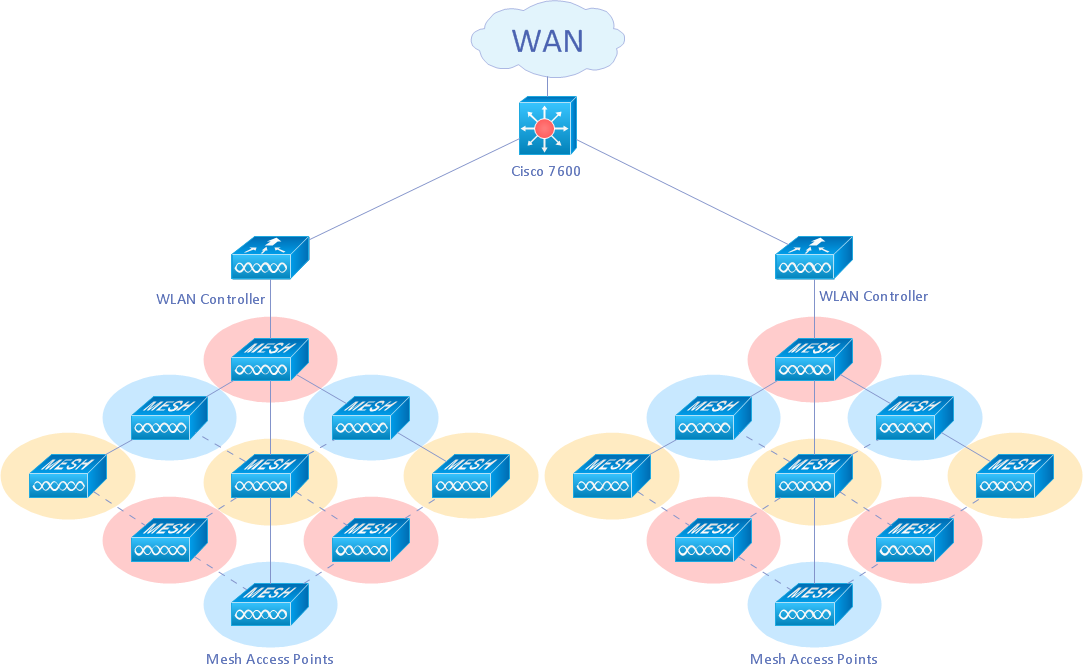
Picture: Wireless Network Drawing
Related Solution:

 Library - Design Elements")
