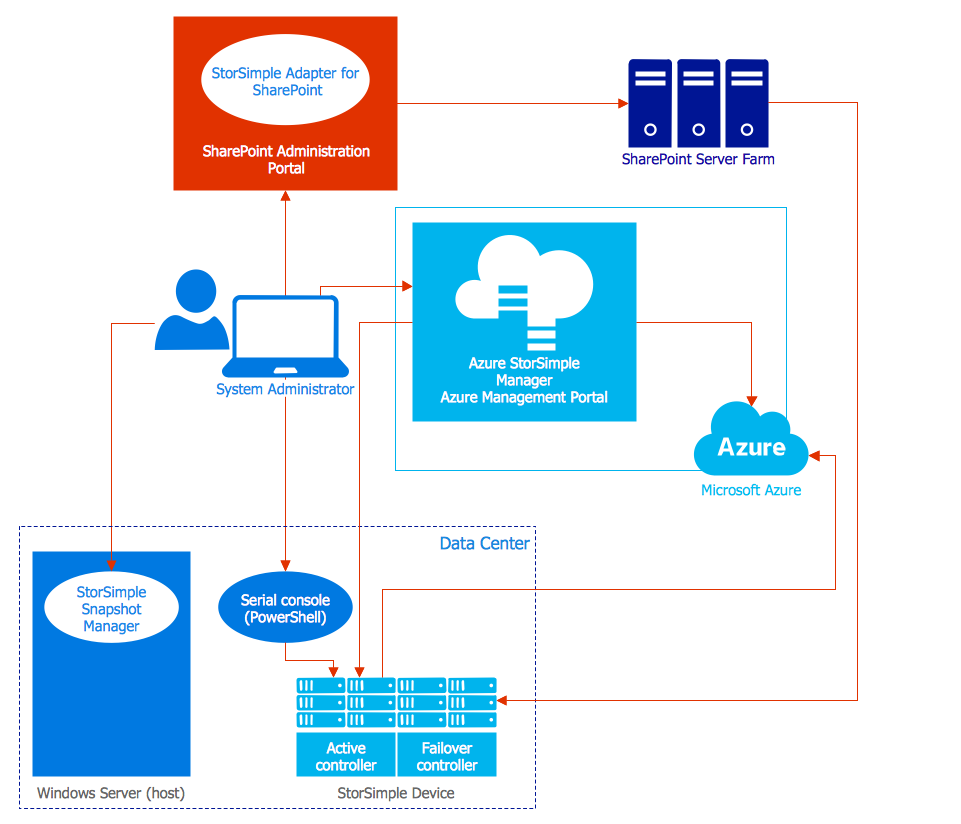
Example 1. Azure Management
Azure Architecture Solution provides 6 libraries with 242 vector objects:
- Azure Architecture - Cloud
- Azure Architecture - Deprecated
- Azure Architecture - Enterprise
- Azure Architecture - Microsoft Products
- Azure Architecture - Symbols
- Azure Architecture - Virtual Machines
Thanks to the predesigned icons and objects from these libraries, you can create new ConceptDraw document and design the Azure management illustration in mere minutes.

Example 2. Azure Architecture Solution in ConceptDraw STORE
But the easiest way of drawing any Azure management or Azure architecture diagram is to fill ready template. From ConceptDraw STORE you can observe 5 templates, choose the desired and use it as the base.

Example 3. External Configuration Store Pattern Template
The sample and template you see on this page were created in ConceptDraw DIAGRAM using the shapes from the libraries of Azure Architecture Solution for ConceptDraw Solution Park. An experienced user spent 10 minutes creating this Azure management sample.
Use the Azure Architecture Solution for ConceptDraw DIAGRAM software to create your own professional looking Windows Azure management illustrations quick, easy and effective, and then successfully use them in your work activity.
All source documents are vector graphic documents. They are available for reviewing, modifying, or converting to a variety of formats (PDF file, MS PowerPoint, MS Visio, and many other graphic formats) from the ConceptDraw STORE. The Azure Architecture Solution is available for all ConceptDraw DIAGRAM or later users.
NINE RELATED HOW TO's:
ConceptDraw MindMap benefits comparing to Mindjet Mindmanager:
Economical. (Lower license price, support is no charge maintenance is an optional one-time fee that delivers to you the next major release) ConceptDraw products are structured to save you money from the date of purchase for the life of the product. When you compare ConceptDraw MINDMAP to Mindjet Mindmanager the cost savings will be obvious.
Flexible Licensing. ConceptDraw is licensed per-named-user. Want ConceptDraw on 2 PCs, 2 Macs, or a PC and a Mac? Straightforward licensing makes this easy.
Picture: Looking at ConceptDraw MINDMAP as a Replacement for Mindjet Mindmanager
Related Solutions:
ConceptDraw DIAGRAM extended with IDEF0 Diagrams solution from the Software Development area of ConceptDraw Solution Park is a powerful diagramming and vector drawing IDEF0 software. All IDEF0 diagrams created in ConceptDraw DIAGRAM are vector graphic documents and can be reviewed, modified and converted to MS Visio XML format. To obtain the IDEF0 Visio documents from ConceptDraw DIAGRAM documents use the wide export possibilities of ConceptDraw DIAGRAM.
Picture: IDEF0 Visio
Related Solution:
A voltage source is a two terminal device which can maintain a fixed voltage. An ideal voltage source can maintain the fixed voltage independent of the load resistance or the output current. However, a real-world voltage source cannot supply unlimited current. A voltage source is the dual of a current source. Real-world sources of electrical energy, such as batteries, generators, and power systems, can be modeled for analysis purposes as a combination of an ideal voltage source and additional combinations of impedance elements.
26 libraries of the Electrical Engineering Solution of ConceptDraw DIAGRAM make your electrical diagramming simple, efficient, and effective. You can simply and quickly drop the ready-to-use objects from libraries into your document to create the electrical diagram.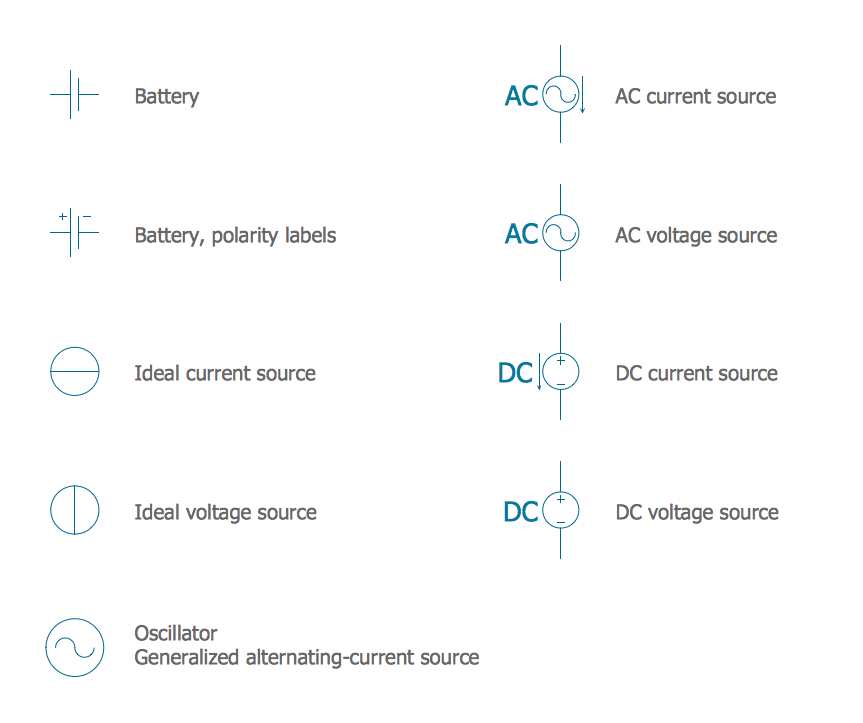
Picture: Electrical Symbols — Power Sources
Related Solution:
ConceptDraw DIAGRAM software extended with Directional Maps Solution from the Maps Area of ConceptDraw Solution Park offers you the set of useful tools for easy drawing map directions, directional maps, road maps, navigation schemes, transit maps of any complexity, etc.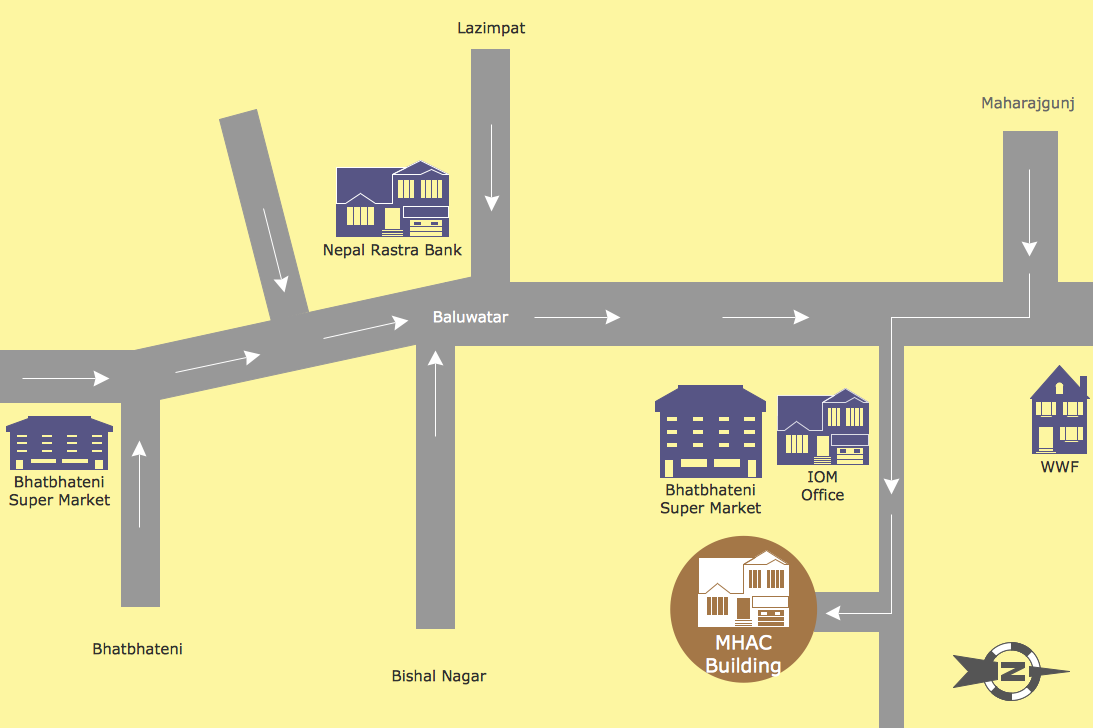
Picture: Map Directions
Related Solution:
Remote Networking - We explain the method most people use to connect to the Internet.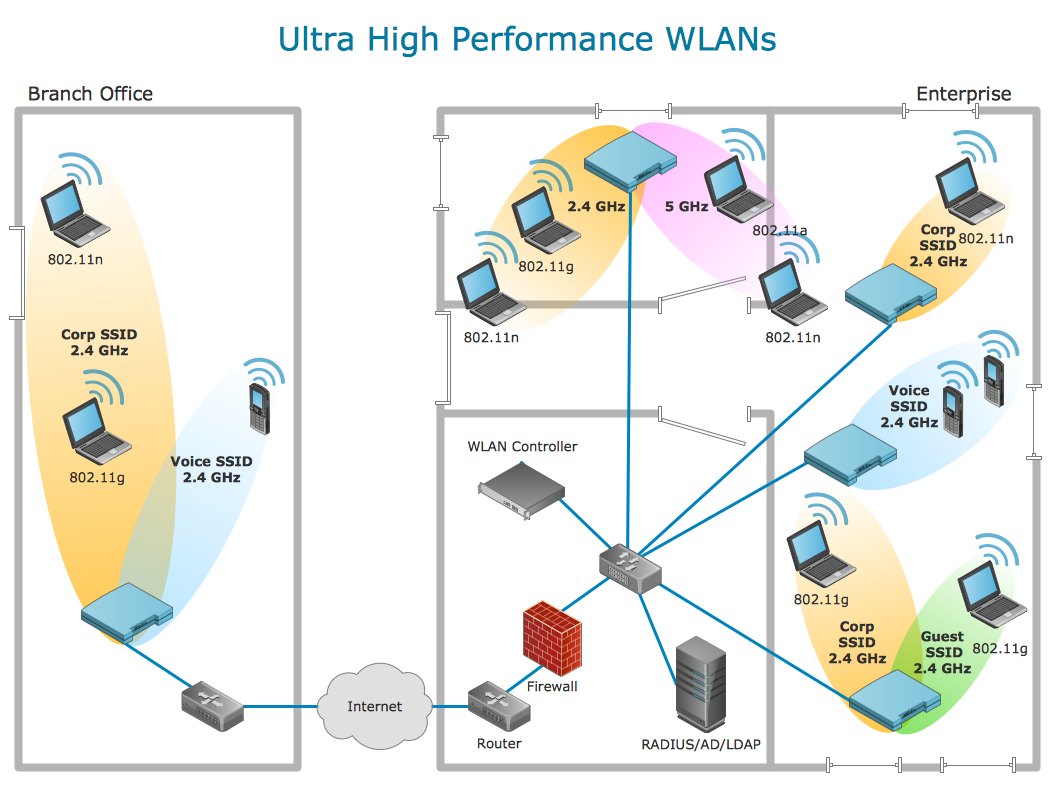
Picture: Using Remote Networking Diagrams
Use Case Diagrams technology. An effective management of changes is significantly facilitated by way of definition and documenting of business-requirements.
Picture: IDEF9 Standard
Drawing workflow diagrams combines both creative and analytic practice. To be the most effective in this process you should find a software that suites this kind of practice. Using ConceptDraw DIAGRAM software for drawing workflow diagrams you get support of features, libraries, templates and samples boosts you creativity and keep you focus on analytic practice, not drawing specifics.
Picture: Drawing Workflow Diagrams
Related Solution:
Succeed in AWS architecture design, communication and collaboration with a team. 🔸 Create detailed and always up-to-date ✔️ AWS diagrams, ✔️ infrastructure based on AWS services, ✔️ auto-scalable architectures, ✔️ AWS-based applications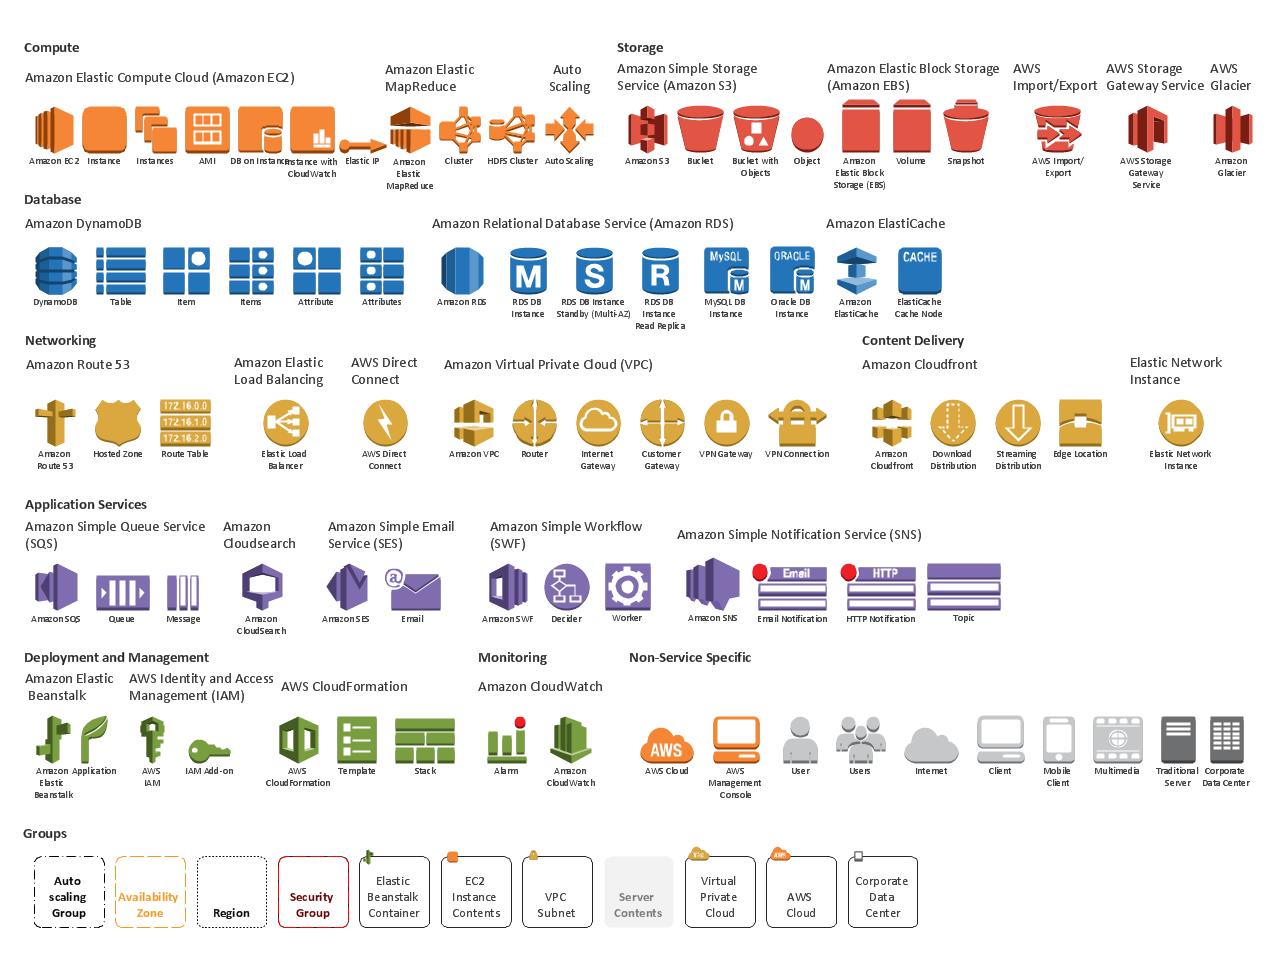
Picture: AWS icons 2.0
The AWS Architecture Diagrams solution includes icons, sample and templates for several Amazon Web Services products and resources, to be used when creating architecture diagrams. The icons are designed to be simple so that you can easily incorporate them in your diagrams and put them in your whitepapers, presentations, datasheets, posters or any technical material you like.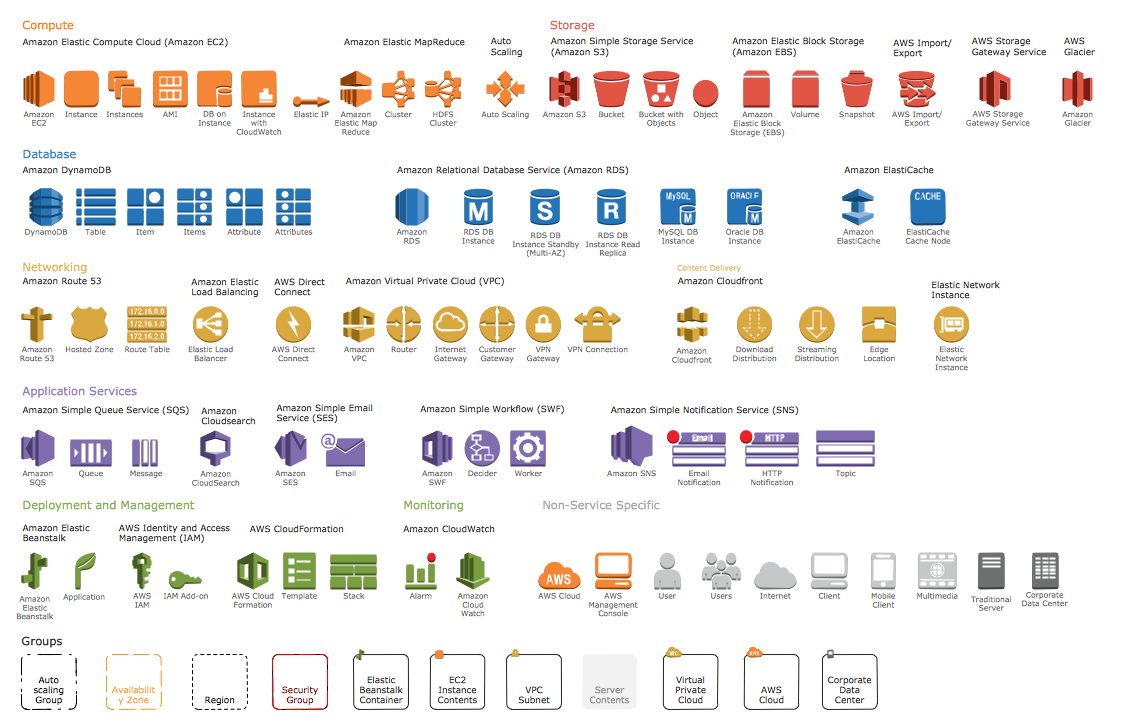
Picture: AWS Simple Icons for Architecture Diagrams

