Recruitment
ConceptDraw DIAGRAM software becomes more and more popular nowadays providing all the necessary tools for creating the smart looking professional drawings, such as diagrams and charts, flowcharts and schemes as well as many more other schematics for those who are involved in many different kinds of business, such as recruitment, for example.
Recruitment itself is a core function of any human resource management, being a part of any commercial organization nowadays. Recruitment is known to be the first step of any appointment, referring to the overall process of selecting, appointing and attracting the suitable candidates for jobs. The offered jobs may be either temporary or permanent, depending on the needs of the organization.
The process of the recruitment can be also referred to a process which is involved in choosing the individuals for the unpaid positions: for example, the unpaid trainee roles or the voluntary roles. Human resource generalists, recruitment specialists as well as managers are all in charge for being tasked with carrying out the process of recruitment. At the same time in some cases the so-called “public-sector employment agencies” as well as the commercial recruitment agencies or specialist search consultancies are those who are being used for undertaking the parts of the process of recruitment.
The internet-based technologies are used for supporting all the aspects of the process of recruitment becoming more and more widespread. In the particular situations when there are multiple new jobs are available for the potential candidates who are needed urgently, the special agencies may be involved in the process of the searching the right people.
Those, who are being recruited for the first time, people may have to go through some particular tests in order to be accepted for the certain types of jobs. Thus, to match the job descriptions as well as the job specifications they have to pass the tests they are offered. Occasionally, any company which provides the job descriptions for the existing positions needs someone better, but the amount of money they have for paying to such candidates is limited. That’s why the recruitment specialists always have to make sure that those people who intend to be working for their organization are smart enough to develop their skills and so to make it possible to achieve more complex goals in the future.
As a general rule, before recruiting people the recruiters have to make sure that those people’s specification is finalized. Such term as “sourcing” is very commonly used within the process of recruitment, being used at one or more strategies for attracting or identifying the candidates for filling the job vacancies. The described process may involve both internal and external recruitment advertising in a way of using the appropriate media: national or/and local newspapers, job portals, social media, business media, professional publications, window advertisements, specialist recruitment media, job centres, or other sites on the Internet.
The employers also often use the recruitment agencies or consultancies for finding the needed candidates. Such initial research for candidates is known to be producing the contact information for the potential candidates, whom the recruiter working for some particular organization can then screen and contact. Lots of the psychological tests can be used during the process of recruitment. The assessments of the candidates can be also those for measuring the physical ability of those who intend to work for an organization.
Agencies and recruiters sometimes use the so called “applicant tracking systems” for “filtering” the candidates. From time to time they also use the software tools for the psychometric testing. In order to do the performance-based assessment there are many other tests which are widely used nowadays.
Most of the employers aim to recognize the value of each of the candidates with an ease, especially those, who encompass such skills as team or interpersonal leadership. Many of the modern companies, including different multinational organizations, are often known to be concerned about their candidates wondering if they fit the prevailing company culture or not.
Lots of major corporations are known to be recognizing the need for diversity in hiring people very well in order to complete it successfully in a global economy. Most of them try to show they support the diversity as an essential value for their own and their business success.
The so called “Recruitment Process Outsourcing”, or "RPO", is simply a form of the business process outsourcing where some company tries to engage a third party (a provider) for managing all or only a part of its recruitment processes. The “internal recruitment” term can be referred to the process of the candidate being selected from the existing workforce in order to take up a new job in the same organization.
Such well-known terms as “promotion” and “career development opportunity” become more and more popular nowadays as companies try to keep the best workers to continue working developing their business by stimulating the employees with grants and new, higher, positions.
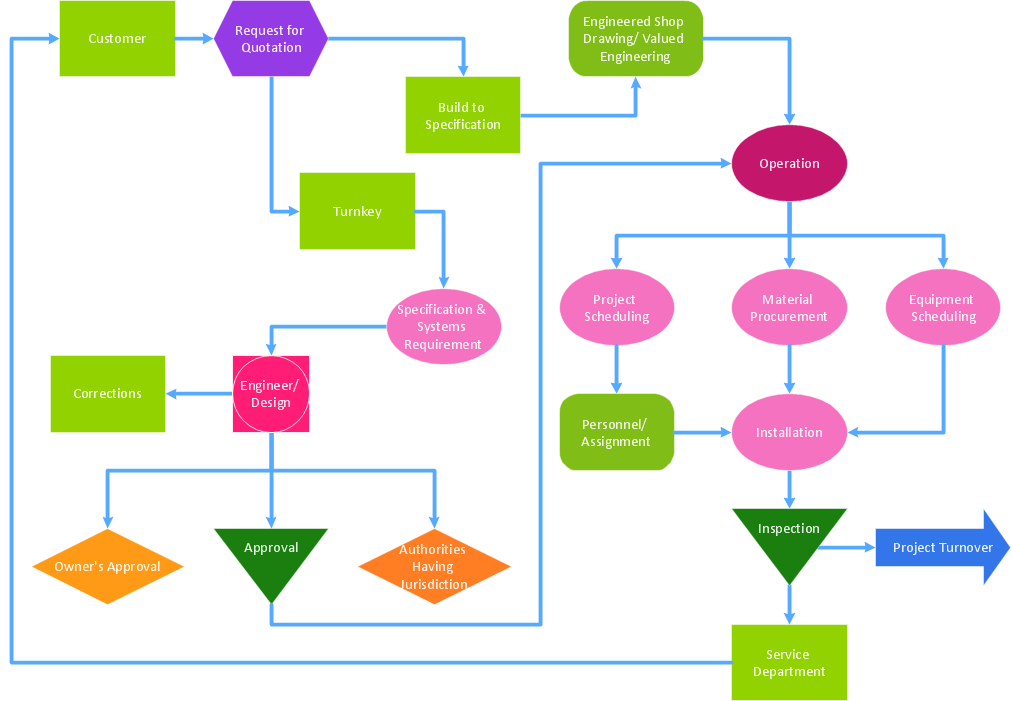
Example 1. Recruitment Model
The most important and useful that includes the HR Flowcharts Solution is extensive set of libraries — 7 libraries with 387 predesigned human resources themed images, icons and connectors specially developed for ConceptDraw DIAGRAM users.
ConceptDraw DIAGRAM software offers you the choice — you can design your Recruitment HR Flowchart from the beginning using the predesigned objects from the libraries or use as the base the suitable sample from the offered by HR Flowcharts Solution.

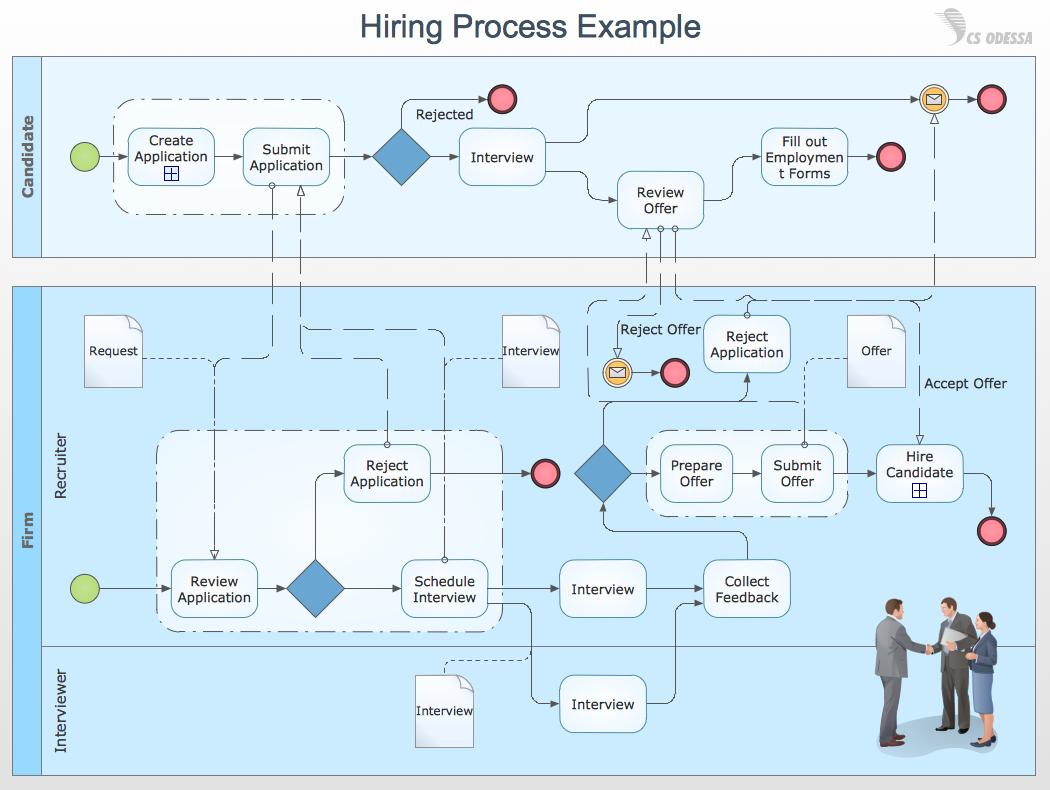
Example 2. Post Employment Committee Recruitment Flowchart
It is always possible to illustrate the process of recruitment with help of such professional software as ConceptDraw DIAGRAM one as it allows to create any needed business related drawing, including flowcharts, diagrams, charts, maps, schemes and many other types of schematics. Having the HR Flowcharts Solution it will become much simpler to create any needed recruitment related drawing, such as Recruitment HR Flowchart within a very short time using the pre-made examples of such flowcharts, which all can be found in the mentioned solution.
TEN RELATED HOW TO's:
When thinking about the process of decision making, it's easy to imagine it as a pyramid. We will look at a three level pyramid model as an example. Operational decisions are first that come to mind, and it's the first level. Tactical and strategic decisions are the second and the third levels.
Pyramid (triangle) diagrams are used to show some hierarchical data. Because to the pyramid form of diagram, each diagram slice has a different width. The width of each segment depends on its hierarchical level.
The current image illustrates the model of information system types. Most graphically the model can be represented as a three level pyramid. The first level shows a system of transaction processing It is concentrated on operational tasks. The second level is devoted to tactical solutions of the information system management. And at least, the third level addresses strategy and represents the executive information system. This three level pyramid sample is supplied with the ConceptDraw Pyramid Diagrams solution from Marketing area of ConceptDraw Solution Park.
Picture: Pyramid Diagram
Related Solutions:
ConceptDraw DIAGRAM software supplied with HR Flowcharts Solution can effectively help in labour-intensive process of human resource development.
Picture: Human Resource Development
Related Solution:
To your mind, deliberation about the profits of creating organizational charts takes more time than actually creating itself. If lack of software is the only thing that stops you, you should know that organizational charts with ConceptDraw DIAGRAM are created within a few minutes. Owing to the great number of ready-to-use templates, you’ll get your chart easily.
Chart is a very handy format for visually depicting official relations of an organization. Usually, an Orgchart (organizational chart) consists from simple geometrical shapes, containing an information on a position, personal data, and the lines that means responsibilities and accountabilities associated with position. ConceptDraw solution designed for making organizational charts enables one to create various org charts effortlessly using special templates and vector libraries.
Picture: Organizational Charts with ConceptDraw DIAGRAM
Related Solution:
For documenting the Cloud Computing Architecture with a goal to facilitate the communication between stakeholders are successfully used the Cloud Computing Architecture diagrams. It is convenient and easy to draw various Cloud Computing Architecture diagrams in ConceptDraw DIAGRAM software with help of tools of the Cloud Computing Diagrams Solution from the Computer and Networks Area of ConceptDraw Solution Park.
Picture: Cloud Computing Architecture Diagrams
Related Solution:
Competitor analysis is a first and obligatory step in elaboration the proper corporate marketing strategy and creating sustainable competitive advantage. Use powerful opportunities of numerous solutions from ConceptDraw Solution Park for designing illustrative diagrams, charts, matrices which are necessary for effective competitor analysis.
Picture: Competitor Analysis
Related Solution:
ConceptDraw DIAGRAM software is the best Mac software for drawing workflow diagrams. Its rich set of samples and templates, and specific features to draw diagrams faster make this software as comfortable as possible for drawing workflow diagrams.
Use the ConceptDraw DIAGRAM professional Mac OS X software for drawing workflow diagram. The Workflow Diagrams solution with its libraries and templates set make the possibility to identify resources that are required for work goal implementation. The process flow diagram identify flow which occurs as network of process dependencies, organizational decisions and interactions between departments. Usually workflow diagrams show business participants actions that carry product or service to the final destination, the consumer.
Picture: Workflow Diagram Software Mac
Related Solution:
You can design the Prioritization Matrix by hand on the paper, but we offer you the most easier way — to use the ConceptDraw DIAGRAM diagramming and vector drawing software extended with Seven Management and Planning Tools Solution from the Management Area.
Picture: Prioritization Matrix
Related Solution:
Data processing can be very complex sometimes. If you are interested in facilitating your work with data, it’s time to learn how to draw flowcharts with special software or using just a piece of paper. The list of flowchart basic symbols includes rectangles, diamond, ellipses etc. and is used to represent processes, actions, decisions or data processing.
A well-done flowchart bring the clearness of the sequence of a process stages. There are number of symbols that can be used in flow charts to show various sorts of steps. The basic flowchart can be created using a few of them: Process, Decision, Start/Finish. A basic element of a flowchart represents a simple action and looks like a box, that contains a description of the action. The depicting of actions sequence is made with arrows between corresponding action boxes, as you can see on the sample diagram. Also it shows the symbols for flowchart start and finish steps. ConceptDraw Flowcharts solution provides the ability to build basic flow charts as well as the ones of any size and complexity with a minimum of actions.
Picture: How to Draw a Flowchart: Step-by-Step Guide
Related Solution:
If we divide computer networks by scale, we get several main categories. The smallest network is PAN, as it connects personal devices themselves, and as the number of users grows, a local area network can be recognized, and campus area networks (CAN) connects several local networks located within some area like a university or a corporation. Computers connected to CAN share public educational materials and list of CAN network examples includes such prestigious universities like Stanford and Carnegie Mellon.
This is an example of a computer network diagram created for a campus area network. It was created using using ConceptDraw solution for the Computer and Network diagramming. The specific of this sample campus network is its distribution. It is rather broad to embrace a big campus territory. This diagram can be applied as a template for designing custom area network topology diagram for a particular educational institution.
Picture: Campus Area Networks (CAN). Computer and Network Examples
Related Solution:
When used in different areas, flowcharts use specific symbols to depict different elements. ConceptDraw DIAGRAM offers libraries of symbols for many areas. One of such libraries is flowchart symbols accounting, which provides symbols for accounting diagrams. Activity-based costing calculates the costs of all products and services based on activities in an organization. A type of accounting flowchart that shows how costs are assigned to products with resources and activities is called Activity-based costing (ABC) flowchart. It can be designed in a digital drawing software such as ConceptDraw DIAGRAM.
Here is an accounting flowchart template and symbols. These flowchart symbols are applied for making accounting flow charts in ConceptDraw DIAGRAM and with its Accounting Flowcharts solution. An accounting flowchart is a specific type of a flow diagram. Practically a number of flowchart-type diagrams commonly utilized to clarify many parts of an accounting department working process. Accounting flowchart assists a process of preparing accounting documentation. It shows who responsible for implementation of each step in the workflow of accounting department.
Picture:
Flowchart Symbols Accounting
Activity-based costing (ABC) flowchart
Related Solution: