Organigram HR
The term "organigram" joins two words "organization" and "diagram" and was first used in 1855 by Scottish railway manager Daniel Craig McCallum. Organigram is a graphic representation, which shows the structure of an organization or its parts, which are organizational units with their specific tasks and functions. The parts of the company include departments, divisions, branches, etc.
Organigrams offer significant advantages for any company. They are informative and visually appealing, easier the understanding of the company's structure, its organizational units, links, communication, exchange of information, tasks, and responsibilities. This makes them useful for leaders and managers of varied levels to oversee the whole company's structure, observe an overview of all organizational units of the company and the relationships between them and between individual employees in the company. Organigram easier communication for staff and management, is useful in any transformations and learning. It is also helpful for new employees, helps them to get settled in the company, understand their positions and learn their coworkers’ positions, identify how the workflow for the company is managed and which relationships between different positions in the company exist.
Organigram shows how cohesively the company works and helps in succession planning. It is incredibly useful to develop your company efficiently, observe the responsibilities and roles of employees, and assign appropriate permissions. Organigram is excellent to visualize the structure of any company's department, including the HR department. HR organigram shows each position of the company's HR department and who reports to whom.
You can use various levels of detail, create a simple overview or depict detailed information on each position in the company, employees, and their skills. Organigram streamlines communication and eliminates much potential confusion around authority as it clears who is the direct supervisor of each employee and controls him.
Organigram HR is useful to promote employees over the career ladder and fill vacant positions. It is an essential tool for any company, provides a good overview as your company scales and grows, helps to develop new positions and create job descriptions. Moreover, once some position opens up, it helps to analyze who is excellent for the promotion: it is necessary to hire a new employee or somebody of the current employees well suits for this position.
There are four basic types of organigrams:
functional — all of the specialties are grouped together in departments;
divisional — separates employees into divisions in the companies with several services or products;
matrix — combines both the functional and divisional model, supposes the cross-training of employees from different divisions; often employees have two different superiors - technical and disciplinary;
flat — has no hierarchy, usually includes only managers and employees; employees work autonomously and don't report to managers or supervisors.
Functional and divisional types are hierarchical structures. These are the most common forms, which show the hierarchy of employees, their basic tasks and responsibilities.
Example 1. Organigram HR Design in ConceptDraw DIAGRAM
One differs also:
single-line systems with one relationship between two units;
multi-line systems where some units are subordinated to other ones and receive from them the working instructions.
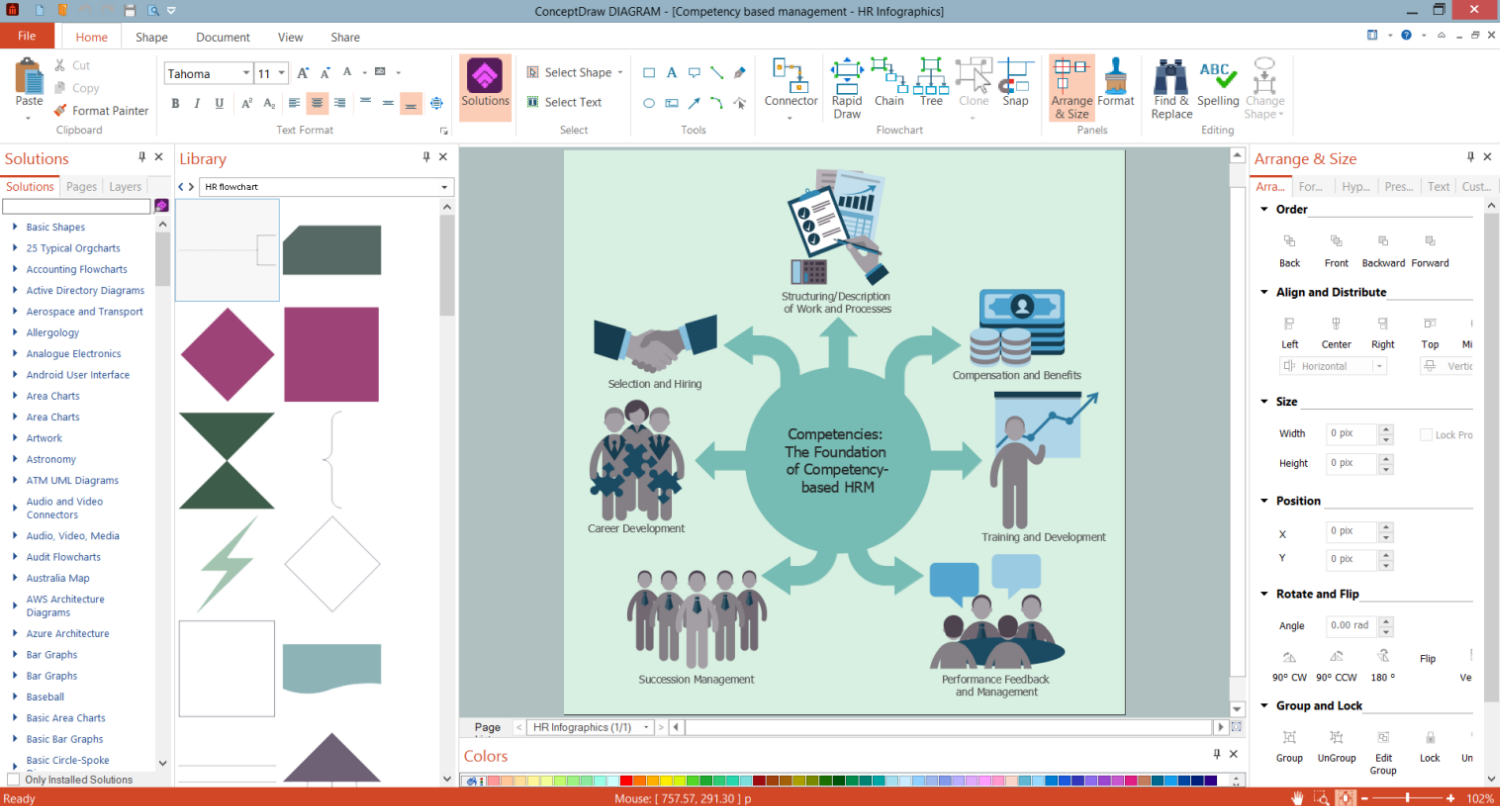
Organigram offers a great volume of information at a glance. Use powerful tools of ConceptDraw DIAGRAM software and HR Flowcharts solution to create the Organigram HR, show how the entire company or HR department is structured, introduce the competency based management, and analyze whether new staff positions are necessary to be created or there are some gaps to be filled.

Example 2. HR Symbols Library Design Elements
Various shapes are used to indicate different roles in the HR department. HR Flowcharts solution offers a wide variety of pre-made vector shapes including rectangles, squares, circles, triangles for different roles, and many more thematic HR symbols, clipart, and pictograms. Indicate differences in authority and responsibility with clipart, different colors, or sizes of objects. Identify links between employees, highlight vacant positions with different colors or dotted lines on your own.
HR Flowcharts Solution offers a variety of vector design objects you may need to create the HR organigram. The elements are grouped into 7 libraries:
- HR Arrows
- HR Flowchart
- HR Workflow
- HR Symbols
- HR Department
- HR Professions
- HR Steps

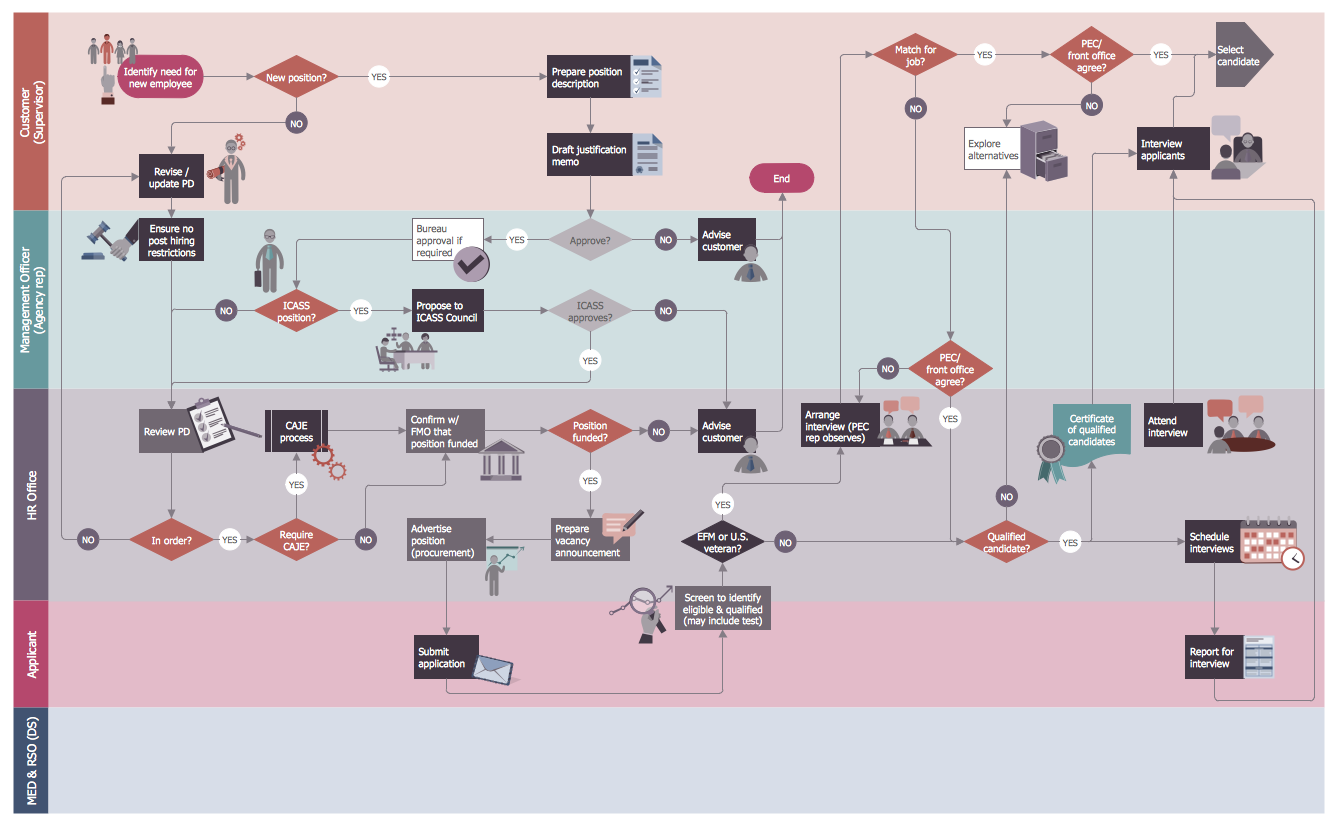
Example 3. Human Resources Flowchart — Recruitment Model
The HR Charts you see on this page were created in ConceptDraw DIAGRAM software using the extensive drawing tools of the HR Flowcharts Solution and visually show hiring process on the HR Flowchart. They successfully demonstrate the solution's capabilities and professional results you can achieve. An experienced user spent 10-15 minutes creating each of these samples.
Use the powerful tools of the HR Flowcharts Solution for ConceptDraw DIAGRAM software for effective hiring process and for quick and easy creating professional-looking HR Flowcharts. Use successfully the created diagrams in your work and personal activity.
All source documents are vector graphic documents. They are available for reviewing, modifying, or converting to a variety of formats (PDF file, MS PowerPoint, MS Visio, and many other graphic formats) from the ConceptDraw STORE. The HR Flowcharts Solution is available for all ConceptDraw DIAGRAM users.