UML Use Case Diagram Example. Registration System
The use case diagram (behavior scenarios, precedents) is the initial conceptual representation of the system during its design and development. This diagram consists of actors, use cases and relationships between them. When constructing a diagram, common notation elements can also be used: notes and extension mechanisms.
The essence of this diagram is as follows: the designed system is represented as a set of actors interacting with the system using the so-called “use cases”. In this case, an actor (acting person, actant, artist) is any object, subject, or system that interacts with a simulated system from the outside. In turn, the “use case” is a specification of the services (functions) that the system provides to the actor. In other words, each “use case” defines a certain set of actions performed by the system when interacting with an actor. At the same time, the model does not reflect in any way how this set of actions will be implemented.
In the structural approach, the analogue of the use case diagram is IDEF0 and DFD diagrams, use-work options (IDEF0) and processes (DFD), and actors — external entities (DFD).
This sample was created in ConceptDraw DIAGRAM diagramming and vector drawing software using the UML Use Case Diagram library of the Rapid UML Solution from the Software Development area of ConceptDraw Solution Park.
This sample shows the types of user’s interactions with the system and is used at the registration and working with the database system.
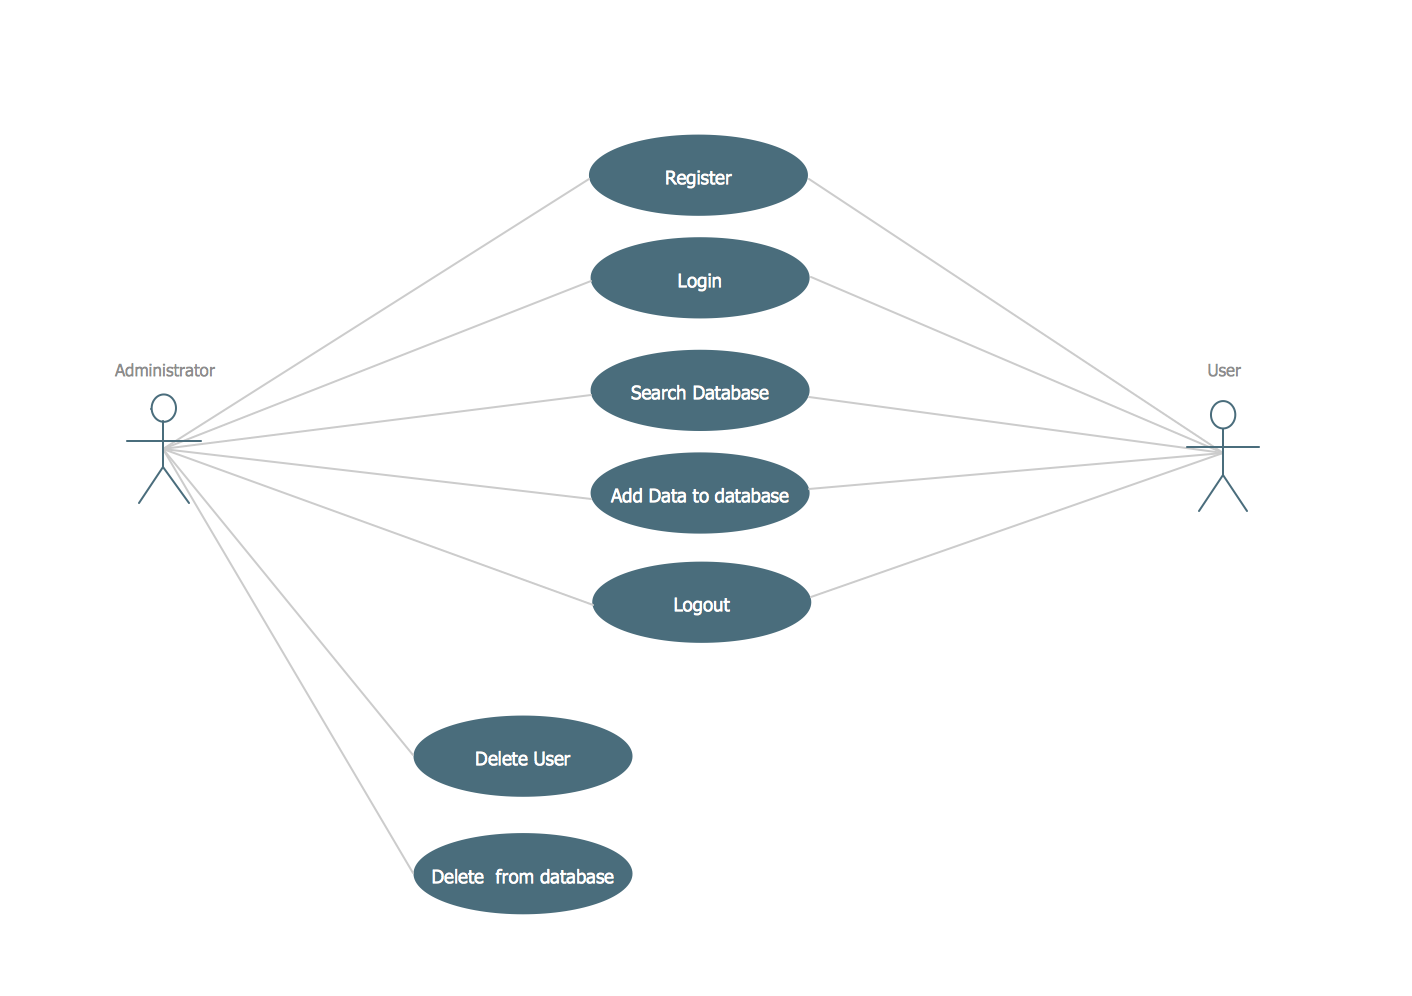
Example 1. Registration System. UML Use Case Diagram
Using the libraries of the Rapid UML Solution for ConceptDraw DIAGRAM you can create your own visual vector UML diagrams quick and easy.
UML Resource:
TEN RELATED HOW TO's:
ConceptDraw DIAGRAM is a professional software for building flowcharts quickly with auto-connect technology.
Picture: Build a Flowchart Quickly With AutoConnect
Related Solution:
When it comes to system construction, a class diagram is the most widely used diagram. UML Class Diagrams is a type of static structure diagram that is used for general conceptual modeling of the systematics of the application. Such a diagram would illustrate the object-oriented view of a system. The object orientation of a system is indicated by a class diagram. It describes the structure of a system by showing the general issues,classes of a system, attributes, operations, interfaces, inheritance, and the relationships between them.
Picture: UML Class Diagram Notation
Related Solution:
The term “cloud” is very popular and widely used now, it is a server, data processing centre, or a network which lets to store the data and software, provides access to them, allows to run applications without installation and gives the possibility to process data hosted remotely via the Internet connection.
For documenting the Cloud Computing Architecture with a goal to facilitate the communication between stakeholders are successfully used the Cloud Computing Architecture diagrams. It is convenient and easy to draw various Cloud Computing Architecture diagrams in ConceptDraw DIAGRAM software with help of tools of the Cloud Computing Diagrams Solution from the Computer and Networks Area of ConceptDraw Solution Park.
Picture: How to Build Cloud Computing DiagramPrincipal Cloud Manufacturing
Related Solution:
The vector stencils library Watercraft contains clipart of ships, boats, yachts, submarines for ConceptDraw DIAGRAM diagramming and vector drawing software.
Use it to draw illustrations of vessels and water transport over a sea, ocean, lake, canal, river.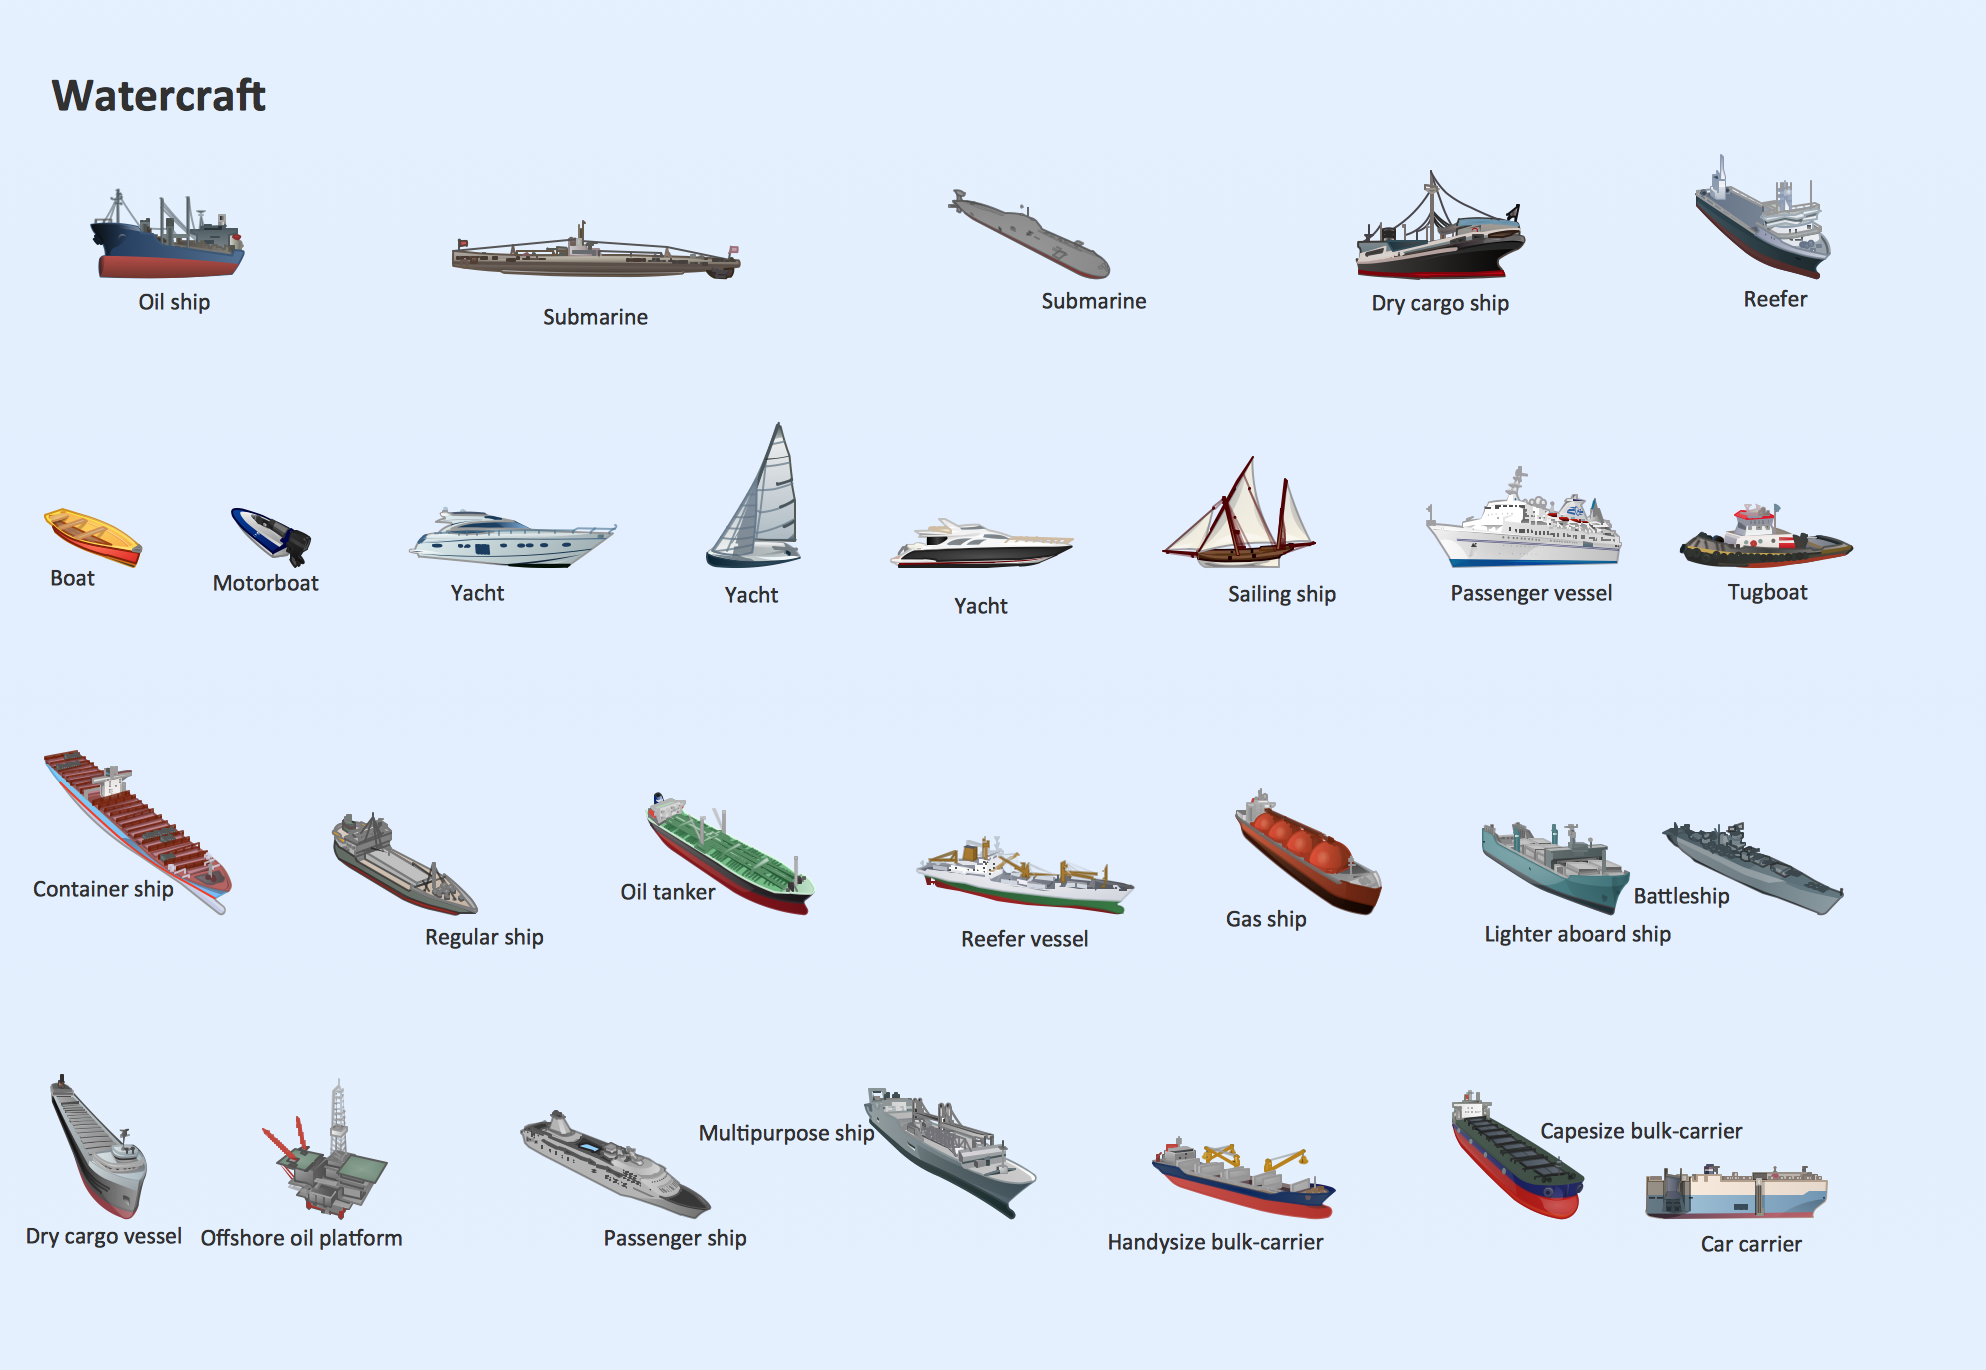
Picture: Watercraft - Design Elements
Related Solution:
Event-Driven Process Chain Diagrams for improvement throughout an organisation.
ConceptDraw DIAGRAM - software that reduces the time needed to create a business process model.
Picture: Beauty of Event-driven Process Chain (EPC) diagrams
Related Solution:
There are a lot of structured analysis and design technique methodologies used to describe systems and data sources. To visualize data structures, data flow diagrams can be used for various purposes in the area of software engineering. Nowadays these diagrams are also used in the area of business analysis and information system analysis.
This data flow diagram depicts an account processing system of a typical account department of a small manufacturing enterprise. It shows the data transmission through the order processing to shipping verification. This data flow diagram was created according to standard of Yourdon and Coad notation. The vector graphic objects of Yourdon/Coad notation symbols was delivered by ConceptDraw Data Flow Diagrams solution. The current DFD can be employed as an example of a business process model, representing the set of business events and interactions commonly engaged in a accounts receivable process.
Picture: Data Flow Diagrams
Related Solution:
You need design the Functional Block Diagram and dream to find the useful tools to draw it easier, quickly and effectively? ConceptDraw DIAGRAM offers the Block Diagrams Solution from the Diagrams Area which will help you!
Picture: Functional Block Diagram
Related Solution:
UML Communication Diagram depicts the interactions between objects or parts in terms of sequenced messages and describes both the static structure and dynamic behavior of a system.
Picture: Diagramming Software for Design UML Communication Diagrams
UML state machine's goal is to overcome the main limitations of traditional finite-state machines while retaining their main benefits. ConceptDraw is ideal for software designers and software developers who need to draw UML State Machine Diagrams.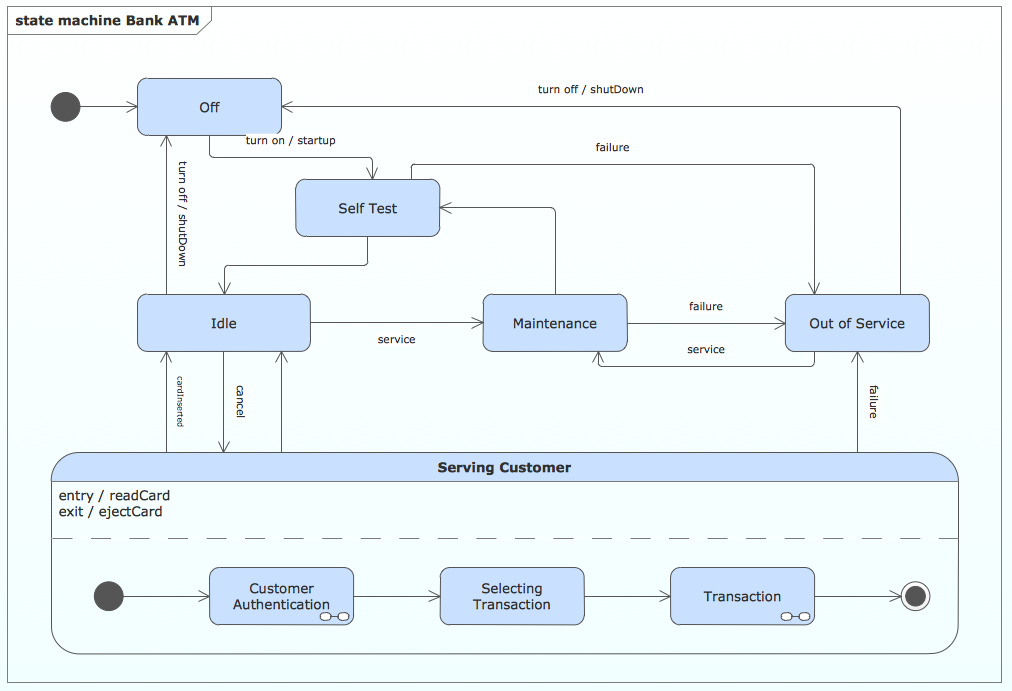
Picture: State Machine Diagram
UML Composite Structure Diagram shows the internal structure of a class and the possible interactions at this structure.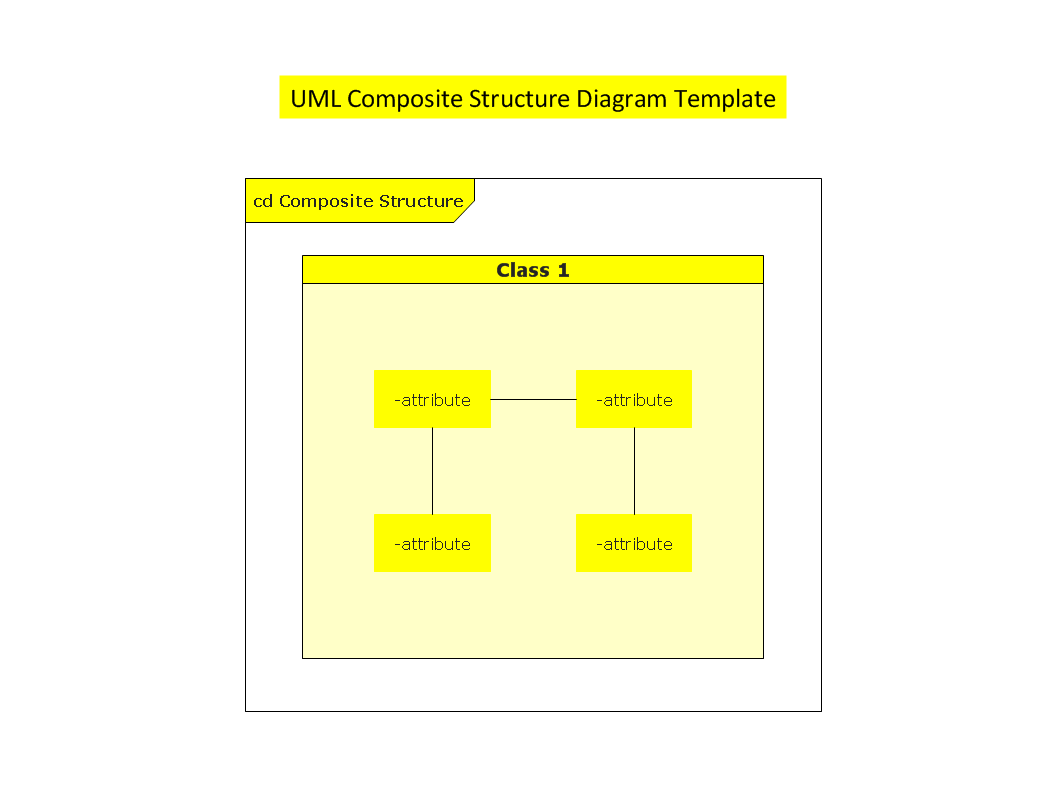
Picture: UML Composite Structure Diagram