ConceptDraw DIAGRAM - Organizational chart software
Create Organizational Chart!Use it to create Organizational charts; visualize company Organizational chart, hospital Organizational chart, hotel Organizational chart, corporate organizational chart etc. CSOdessa team is happy to provide cost effective Organigram software for companies of any size.
Organizational chart software ConceptDraw DIAGRAM allows you easy create:
Organizational Chart software ConceptDraw DIAGRAM includes: 
Read more about ConceptDraw DIAGRAM - Organizational chart softwareDownload free trial of - Organizational chart software - ConceptDraw DIAGRAM. If you have any question how to use Organizational chart software ConceptDraw DIAGRAM please email us. |

TEN RELATED HOW TO's:
A Venn diagram, sometimes referred to as a set diagram, is a diagramming style used to show all the possible logical relations between a finite amount of sets. Having ConceptDraw DIAGRAM software one allows anyone who cares for their drawings to look not only nice but also smart and professional.
Picture:
Venn Diagram Examples for Problem Solving
Computer Science. Chomsky HierarchyRelated Solution:
When using a shapes′ center connection the connection becomes dynamic, the connector will trace the contour of the object, when moving the object inside your diagram.
Using any other connection point provides a static connection, when you move connected objects the connector stays attached to the same point.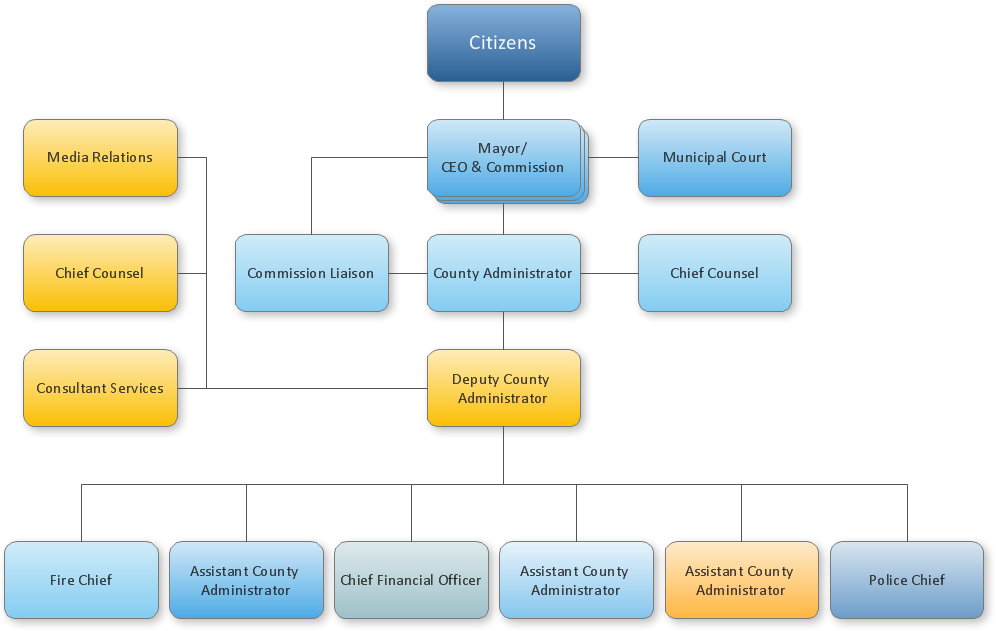
Picture: ConceptDraw Arrows10 Technology
A computer network diagram for a large network can be complicated and difficult both to understand and to draw. To learn how to deal with complex network diagrams, start with a basic network diagram, showing only the primary network devices and the connections between them. There are software tools to help you with that, such as ConceptDraw DIAGRAM , that include templates and examples for simple and common network diagrams.
The ConceptDraw solution for making computer network diagrams delivers over a thousand of vector objects, composed into the forty vector libraries that were developed to support drawing of professional-looking computer network diagrams. This diagram of computer network can be used by system administrator as a basic template for making the custom network diagram. Since the responsibilities of network or system administrator include documenting of computer network, drawing network diagrams is an important part of their work.
Picture: Basic Network Diagram
Accounting flowchart is a pictorial way to represent the flow of data in an organization and the flow of transactions process in a specific area of its accounting or financial department. Accounting Flowcharts solution contains the full set of standardized accounting flowchart symbols which will help you design in minutes various types of Accounting Flowcharts including such popular diagrams which represent the whole accounting process: Purchasing Flowchart, Receiving Flowchart, Voucher Payable Flowchart, Treasurer Flowchart, Payment Flowchart.
Picture: Accounting Flowchart Purchasing Receiving Payable and Payment
Related Solution:
The human organism is so constituted that for a full life you need a wide range of nutrients, minerals and vitamins. To get all this, it is necessary to enrich your nutrition by natural and healthy food. The same microelements and nutrients are contained in different foods, so it is very important to create your own healthy diet plan, based on your preferences and containing the balance of nutrients suitable for you.
ConceptDraw DIAGRAM diagramming and vector drawing software extended with Health Food solution from the Food and Beverage area of ConceptDraw Solution Park contains powerful tools for designing healthy diet plan.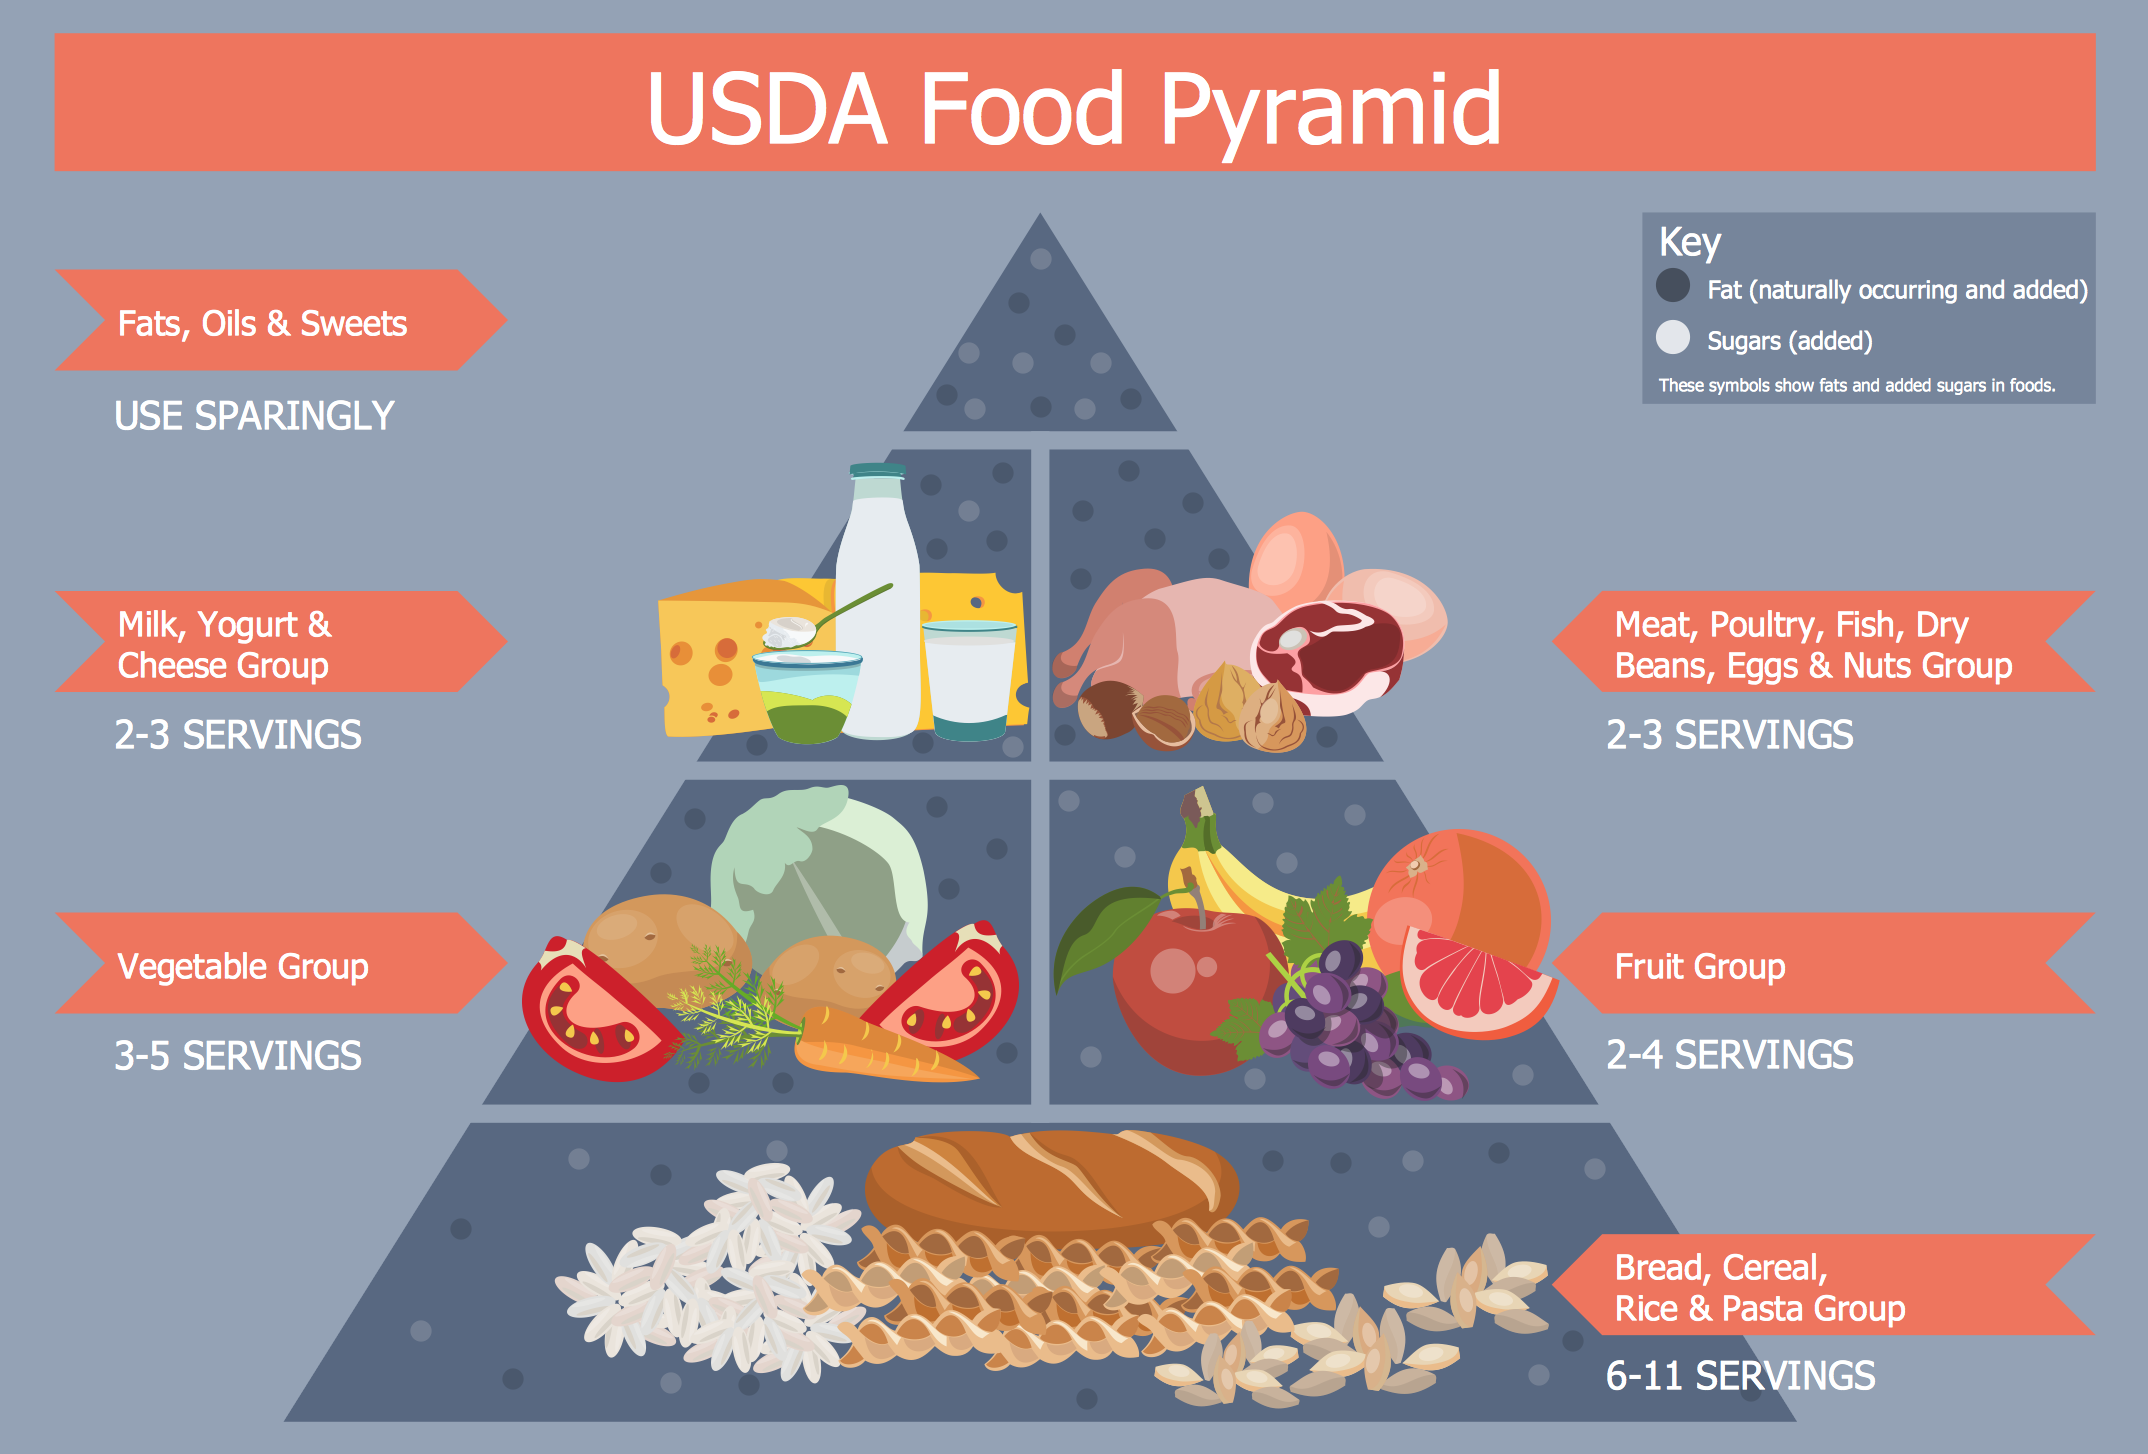
Picture: Healthy Diet Plan
Related Solution:
Process mapping helps with sharing business results and reorganizing workflow. In almost every case, after creating a sales process flowchart the steps that are redundant become obvious for a manager. It's easy to find a flowchart examples that will help in developing one for your business.
This sales process flowchart consists of a sequence of steps that represent a simple sale process. Each step is shown graphically by a rectangle representing processing steps or an activity, or a diamond representing a decision. These rectangles are linked by arrows, that indicate the direction of the sales workflow. ConceptDraw Sales Flowcharts solution delivers a the full set of classical flowchart notation symbols, along with sales-related icons and pictograms.
Picture:
Sales Process Flowchart
Flowchart ExamplesRelated Solutions:
Risk Diagram (PDPC) - ConceptDraw OFFICE suite is a software for Risks Diagram making. This diagram identifies possible risks in accomplishing corrective actions. With the Risks Diagram, one analyzes each action separately in a tree of all actions and develops a preventive action in response of each potential obstacles or circumstances which may be a risk.
Picture: CORRECTIVE ACTIONS PLANNING. Risk Diagram (PDPC)
Compare flowchart software by type, features, and workflow fit. Learn the difference between desktop and online tools and choose the right solution for documentation or collaboration.
Picture: Flowchart Software: Tools for Process and Workflow Diagramming
Related Solution:
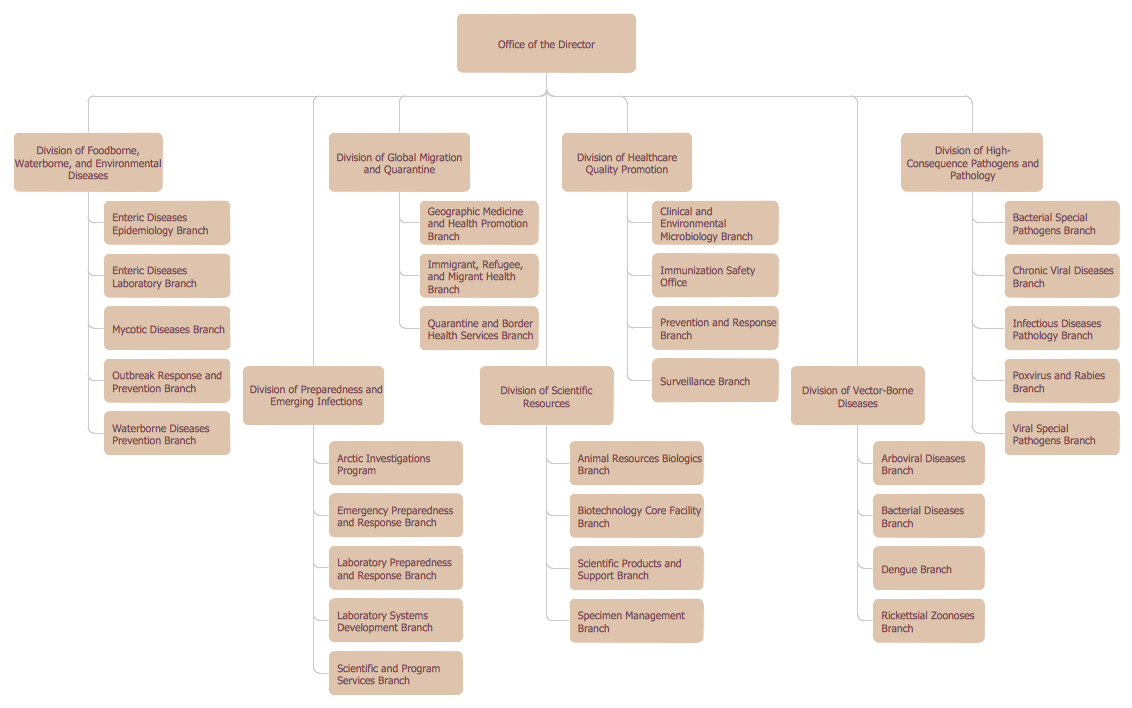
You need design the Marketing Organization Chart and look for effective software? Now it's incredibly easy to do this in ConceptDraw DIAGRAM which was supplied with Marketing Diagrams Solution from the Marketing Area of ConceptDraw Solution Park.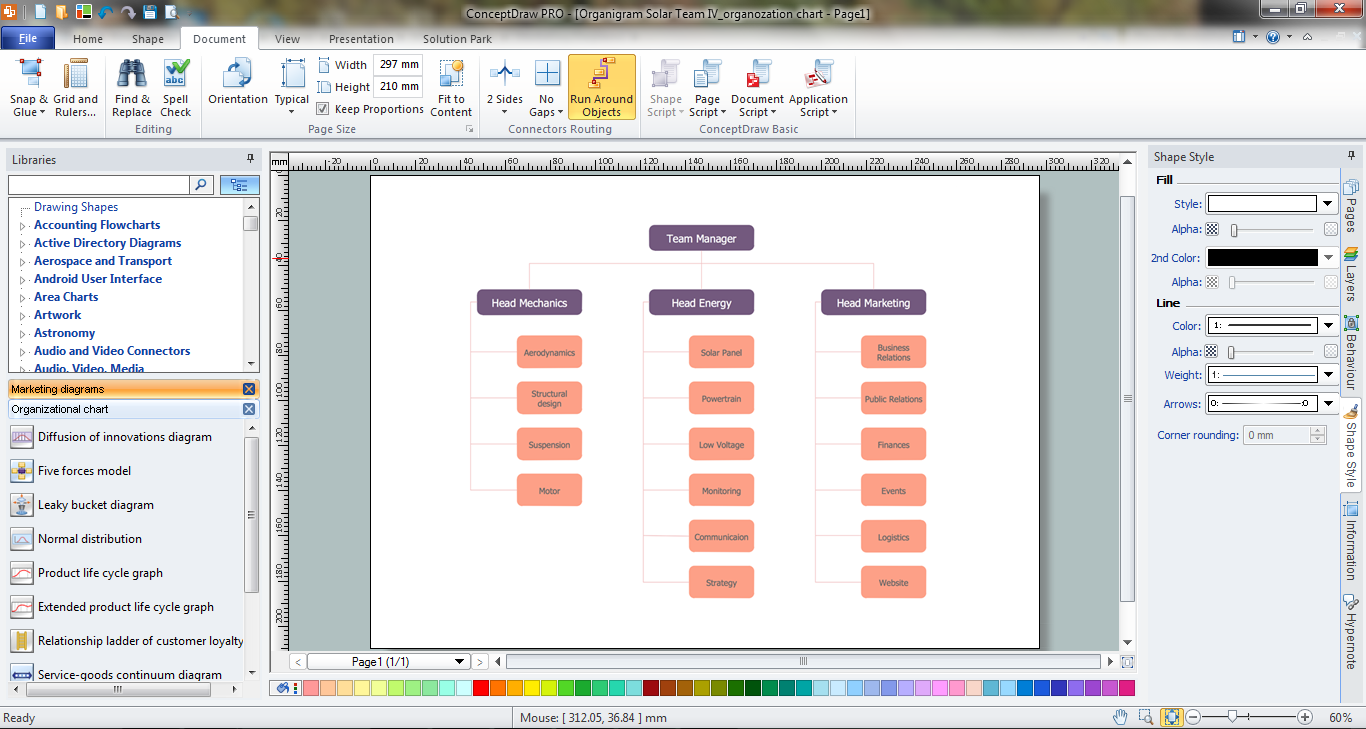
Picture: Marketing Organization Chart
Related Solution:
ConceptDraw DIAGRAM is a flowchart creating software. This software includes over 20 vector stencils in libraries. These objects allow you to create well-designed flowcharts.
Put an initial object from library to a page and use RapidDraw technology clicking on direction arrows to add new objects to the flowchart. This way you can make flowchart quickly.
Picture: How To Create a Flow Chart in ConceptDraw
Related Solution:
ConceptDraw
DIAGRAM 18